iBusiness
Vol.3 No.4(2011), Article ID:9166,8 pages DOI:10.4236/ib.2011.34046
Effect of Quality Assurance (QA) BDS on the Export Activities of SME in the Plastic Sub-Sector
![]()
1Huazhong University of Science and Technology, Wuhan, China; 2College of Economics, Hue University, Hue City, Vietnam.
Email: lenuminhphuong@yahoo.com
Received October 9th, 2011; revised November 13th, 2011; accepted November 22nd, 2011.
Keywords: Quality Assurance, Business Development Services, Small and Medium Enterprise, Export Orientation, Plastic Sub-Sector
ABSTRACT
The paper aims at analyzing general characteristics of the plastic sub-sector in Ho Chi Minh City (HCMC), in-depth quality assurance (QA) implication in the sub-sector, how plastic manufacturers use business development services to improve QA and which QA variables are strongly affected export involvement. Author’s survey had assessed to plastic manufacturers and service suppliers to determine the position of demand and supply, then find the potential improvement in BDS market for both demand and supply size. To recognize the attitude of plastic manufacturers in terms of QA awareness and identify the difficulties and weakness of service suppliers are formulated the general picture of QA in plastic sub-sector. The binominal logit model is used to assess the influence of explanatory variables, which are mainly concerned QA variables, on the probability that firm involve in international market. Our econometric analysis indicates that quality assurance level, automatic level, source of machine and ratio of quality assurance personnel are positively significant for the likelihood of international business. Interestingly, non-export group are likely to use quality assurance business development services rather than export group. QA business development services attract more concern for donors and government due to low value added for plastic exporters’ use.
1. Introduction
Vietnam has made numerous essential legal frameworks and institutional changes to establish favorable environment for small and medium enterprises (SMEs), especially the law on Enterprises in 2000 resulting 21,000 SMEs officially registered [1]. However, a recent study of Mekong Project Development Facility (MPDF) and Vietnam’s Center for Economic Management found that SMEs face numerous obstacles such as unclear administrative procedures and problems with capital mobilization, land and construction permits, tax issues, investment incentives [1].
According to the report of the Ho Chi Minh City Plastic Association, Vietnam’s plastic industry has a high growth rate of 15 - 20 percent per annum over the past 10 years. Especially, the share of the total plastic output in Ho Chi Minh City (HCMC) goes up to 80 percent of the national plastic output. The survey of Swisscontact (SC) plastic industry in HCMC in 2002 showed that nearly 25 percent of the number of plastic manufacturers has directly exported to international market, appropriate to 29 percent of total plastic manufacturers that have indirectly exported to other sub-sectors and the rest exclusively supply for the domestic market.
For SMEs, business development services (BDS) are considered as a lubricant in business performance. Furthermore, BDS is the most important tool to help SMEs access international market. The demand for outsourcing services is becoming valid and impacting process standards on quality assurance. So dynamic SMEs, which have been challenged to such standards are looking for export market. Quality assurance (QA) is a background for formulation quality management. International standard organization (ISO) 9000 is the most widely recognized international standard to date.
Exporting enterprises should have such internal factors: excellent features in technical production, management and quality assurance system. Firms would increasingly rely on professional external services than in-house services. Especially, firms confront with external factors skew BDS rather than in-house services. The following relationships therefore, are hypothesized:
1) There is a significant impact of QA BDS on the export activities of SMEs in the plastic sub-sector in HCMC.
2) The differences in QA system, man, machine, and firm size are determinants for export status of plastic manufacturers in HCMC.
The remainder of the paper is composed as follows. In the next section, we introduce the data and methodology. In Section 3, we summary survey findings. The final section presents conclusions from logit model and some recommendation from the survey findings.
2. Data and Methodology
2.1. Data
2.1.1. Services Providers
The BDS provider list is collected from secondary data from Vietnam Chamber of commerce and industry (VCCI), and 2005 Vietnam business directory. 49 services providers and 8 certification bodies were derived from these sources.
Three certification bodies and six services providers were randomly interviewed in stratified simple groups that were divided into strata followed by legal and types of services criteria.
2.1.2. SMEs in Plastic Sub-Sector
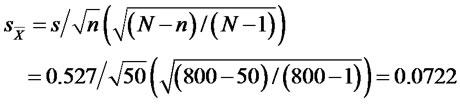
SC has the current list of 800 plastic manufacturers within and in the periphery of HCMC. The formula of sample size is showed below:

Source: [2]
The ratio of sample size to population should be larger than 0.05 [2]. The confidence interval for the mean is determined as following:
95% conf. int.
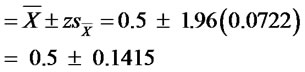
95% conf. int: 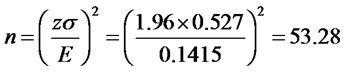
Due to the limitation of time and budget, the size of a representative sample is defined at 45 plastic manufacturers, 20 plastic manufacturers of which have export revenues and 25 others have not; 25 non-exporting plastic manufacturers conform to the size.
2.2. Analytical Method
To recognize the attitude of plastic manufacturers in terms of QA awareness, the use and retention of QA BDS are formulated and the difficulties and determinants of SMEs in access QA, the weaknesses of services suppliers are identified in the general picture of QA BDS market. General information of plastic manufacturers is important as immediate proxies to analyze main variables. Next, the binominal logit model is used to assess the influence of explanatory variables, which are mainly concerned QA variables, on the probability that firms are involved in the international market.
Descriptive analysis explores the demand and supply of QA BDS and general characteristics of plastic manufacturers. Logistic model will reveal what variables are significant in affecting export activities. The primary data were collected from two surveys, one for SMEs— the BDS users and one for QA BDS providers that apply the sub-sector development approach and the BDS market development approach.
Identifying SMEs’ constraints is not new in literature, but the in-depth analysis into the existing quality assurance system and quality assurance BDS is not popular in Vietnam as well as in the world. BDS market is considered as underdeveloped in Vietnam, so it is necessary to understand how the BDS market works. We would like to acknowledge the interesting linkage between QA BDS and SME’s QA system.
Guiding questions for services providers are based on my previous research about market information services for general information and developed according to the quality assurance aspects. The questionnaire used in SME’s survey is based on the questionnaire by [3] and [4] as regard to export aspect; the determinant of SME is consulted from the questionnaire by [5]; supplements of the quality assurance of BDS are supported from previous survey about BDS market, and the Quality Assurance Theory is applied for acquiring knowledge of QA system in the plastic sub-sector.
2.3. Transforming Concepts into Variables
2.3.1. Firm Size
Firm size is a traditional variable included not only in export orientation but also in almost all of the researches about business operations, for example, technology application, productivity, etc. Most of these studies suggest that firm size has positively related to export status. Moreover, employment is a good proxy for the analysis, because employment is easier to acquire information than turnover or asset.
2.3.2. Quality Assurance Factors
Quality is mainly based on 4 factors MEN, MACHINE, MATERIAL, and METHOD. However, MATERIAL is not the focus in our research because nearly 90 percent of plastic materials are imported from most Asian countries. It is, therefore, difficult to analyze the variance of material quality effect on the quality of products and also export status. MEN can be expressed under the ratio of QA personnel in the total number of employees and the QA BDS. METHOD can be calculated via QA level. MACHINE can be denoted under the expression automatic level and source of machine.
2.3.3. Ratio of Quality Assurance Personnel in the Total Employees (QARATIO)
In the survey of the 32 Ghanaian firms, [6] concluded that competent firms have larger proportions of employees in quality control and maintenance (6.5 percent and 1.8 percent) than other firms. We expect that competent firms produce higher product quality; the ratio of quality assurance personnel in the total employees of exporting enterprises therefore is higher than that of the non-exporting enterprises.
2.3.4. Number of Use QA BDS (NOQABDS)
The higher level of automation, the more training will be required and oriented to the acquisition of these skills and to multitasking and multi-skilling [7]. BDS is popular in the form of training and advisory, and is considered as a tool to expand business. QA BDS specifically focuses on quality improvement and production process procedures. QA BDS improve not only QA level but also indirectly product quality through to the engineers, managers and workers who have obtained QA BDS. Reference [8] concluded that business management does not improve immediately through training but the training process can gradually impact on it. Therefore, whether or not there is a positive impact of QA BDS on QA system as well as export orientation will be the focus of model.
2.3.5. Level of Quality Assurance (QALEVEL)
To get the value of the variable, the respondents must answer 17 questions, which are related to 4 stages of a production process. The value of variable can fluctuate between 1 and 17. The design, manufacturing and acceptance stages relate to the 4 factors affected the quality of product (MEN, MATERIAL, METHOD and MACHINE). The variable can be confirmed as in the definition of [8]. It is very useful to enter the variable in the model because only 8 firms have ISO 9000, whereas we could not assume that all enterprises without ISO 9000 have the same QA level. We expect there is positive relation between export status and QA level.
2.3.6. Automatic Machine (AUTOLEVEL)
To unify the automatic level of the plastic industry, we attribute to the fact that automatic, semi-automatic and mechanization levels receive weighted value at 3, 2 and 1. Therefore, automatic level is the sum of the percentage of each automatic level multiplied by the weighted value.
AUTOLEVEL = percent of mechanization ´ 1 + percent of semi-automatic ´ 2 + percent of automatic ´ 3 After getting the value of automatic level, we attribute the value at 2 or above, so AUTOLEVEL receives value at 1. Otherwise, the value of automatic level is less than 2, so AUTOLEVEL receives value at 0. The variable is transformed under the dummy variable. We expect that exported products require more complicated techniques than domestic consumption; therefore, positive sign is our expectation.
2.3.7. Source of Machine (SOURMA)
Based on the quality grade estimated by the surveyed plastic manufacturers, four grades receive the weighted values of: 1, 1.5, 2 and 3 respectively.
SOURMA = percent of machine from Domestic ´ 1 + percent of machine from Asia second-hand ´ 1.5 + percent of Asia ´ 2 + percent of machine from Japan, Europe and America ´ 3 The variable also applies dummy variable as AUTOLEVEL. The level of source machine being less than 2 will get the value of dummy variable at 0; the level of source machine being equal to 2 or more than 2 will get the value of dummy variable at 1. We expect that machines imported from NICs and developed countries have a higher technical capacity, more modern and automatic characteristics; and finally can produce high product quality.
3. Survey Findings
3.1. Assessment on Service Provider
3.1.1. Service Providers
Although the number of private enterprises accounts for over 60 percent, the market share is not compatible with this size. The largest segment markets are reserved to foreign and state-owned enterprises. Responding to the question of “how to access clients?”, the general answer of most respondents to service providers is “most sources of client information are from clients to whom they supplied services before, and from personal relationship and friends”. Furthermore, advertising methods do not attract quality assurance service providers. Almost all clients of private service enterprises come from SMEs because private service enterprises provide competitive prices. Some experts of private providers affirm that their price is 30 percent less than that of foreign providers.
No regulation exists in QA market and the venture capital is small because private services providers do not need more fixed cost; besides, advertisement is considered as ineffective in improving these providers’ reputation. Therefore, private service providers have more chances to easily join the market. Moreover, some individuals that have no need to register can operate in market legally. Brain drain is a critical problem in QA market. Normally, after three or more years working in large foreign services providers, some experts withdraw and form company to work independently.
Services of the private sector are not diversified in comparison with those of foreign and state-own enterprises because of lack of infrastructure, lack of highly skilled experts, and small business scale. The services of small enterprises are mostly counseling, whereas big service providers supply a variety of services: counseling, training, verification and others for all sectors.
3.1.2. Certification Bodies
It is not difficult for customers to choose which certification body is appropriate to certify quality of production process. One Vietnamese certification body is being in operation and recognized internationally. 7 other international certification bodies are highly appreciated in the international market. What are the problems for a market with only 8 suppliers? Small number of certification bodies will result in high price and low quality of services.
It is apparent that the certification cost has declined over time as a result of the competition amongst certification organizations and consultant agencies. No regulation in services providers will impede the private sector on entering the market, yet no regulation for certification bodies can be harmful for services users and consumers. On the ethical aspect, if an enterprise is certified thanks to the intervention of bribery, it is the consumers who will be badly affected by the poor quality products of this enterprise. Some experts have said that about 30 percent users having certificate have not real abilities that are certified by the certification body. Therefore, both foreign and domestic certification bodies should be put under government control and quality certificates should be withdrawn if the quality does not meet prior commitments.
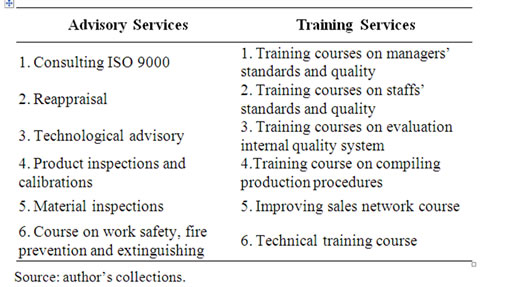
3.1.3. Existing QA BDS in HCMC
QA BDS are advisory and training services that improve the quality of products and processes. In conjunction with the definition of QA and the Vietnamese BDS market, the below services are included in Table 1.
3.2. Assessment on Plastic Manufacturers
3.2.1. General Characteristics
Comparing non-export and export groups, the percentage of employees in engineering department belonging to non-export group (11 percent) is higher than that of export group (6 percent). This could make readers astonished. Modern technique requires more quality engineers at work-site while the non-export group requires more engineers in the engineering department. This can show the difference in the awareness about quality as well as distribution in labor forces. The ratio of QA personnel decreases from micro to medium and then increases at large size. The findings revealed that enterprises with large number of employees possess a well-management system or more shift application. In-house training is favored in the plastic sub-sector but the export group also applies not only this form but also training under the foreman/supervisor’s guidance rather than merely observing from colleagues.
3.2.2. Market
Quality certificate does not make sense in regard of positive effect on export revenue. Enterprises without any quality certificates have highest international market share (17.77 percent) while enterprises having quality certificates have less export share than enterprises without quality certificate (13.75 for ISO 9000 and 11.67 for other certificates). Enterprises having quality certificate supply more than 50 percent of their market share to other industries.
We find that the median of foreign market of plastic manufacturers is 3.8. The average export propensity of 20 surveyed enterprises is at 36.55 percent. The popular international markets for plastic sub-sector are Japan, Taiwan and other Asian countries. Half of them penetrate into USA and Europe markets but their market shares are not too large.
3.2.3. Technology in the Plastic Sub-Sector
The findings present that machines in the plastic subsector are mainly characterized as semi-automatic. Some respondents told that they do not need to buy machines from America, European countries, Japan and other developed countries, because the plastic technologies have developed so fast and SMEs lack capital; therefore, they need short time rather than long time capital circle.
3.2.4. Quality Assurance of Plastic Manufacturers
Regarding the difficulties in applying quality assurance system, we suggest four determinants: cost, resource, competence and distrust. 42 percent of respondents answered resources, 24 percent answered cost, 16 percent competence, and the rest distrust the quality assurance system. The insufficient awareness and understanding of the benefit of the quality assurance system from most managers obstruct quality product development in the plastic sub-sector.
3.2.5. Quality Assurance BDS
More than 15 percent respondents show their attitudes towards service providers: “doubts about the capacity of services provider” and “dissatisfaction with the insufficient information about the final price of the services”. In short, services should be practical and appropriate to business requirements. QA BDS is less likely to affect the QA system to export group than to non-export group. The negative sign seems to contradict the widely held view that benefits usually arise from QA BDS use. An obvious explanation for the results is that Vietnam BDS market is underdeveloped, so low added value is reflected on exporters’ use. QA BDS may be effective on the quality system but the relationship between QA BDS and export status may be less weighted.
3.3. Econometric Analysis
3.3.1. Regression Results
We have used the binomial logit model in order to access the impact of determinants on the probability that enterprises are engaged in export activities. Our dependent variable is a binary (dummy) variable that takes the value of 1 when a firm exports their product, and takes the value of 0 when the firm is not engaged in export activities. The regression result presents in Table 2.
Log likelihood = –8.7482489
 = 44.33 Dependent variable: EXPORT The model has 2 variables being significant at 3 percent level (AUTOLEVEL and SOURMA), three variables being significant at less than 8 percent level (QALEVEL, QARATIO and NOQABDS). The one insignificant variable (SIZE) is far from significant and we exclude SIZE out of the model to maintain good model. This indicates that exports are intensive in actual QA implication rather than the size of business, which runs and counters the predictions about positive relationship between the size of business and export involvement.
To know how one unit change in QALEVEL and NOQABDS impact the probability of export, we apply below equation.
We suppose that initial probability takes three scenarios: 30, 50 and 70 percent.
Table 3 shows that if enterprises’ probability is at 30 percent, one unit increase in number of use QA BDS will reduce 4.95 percent points of export probability; one unit increase in QALEVEL will increase 23.83 percent points of export probability. If AUTOLEVEL and SOURMA, which are two dummy variables expressing machine characteristics, fall into value at 1, the probability jumps up to 96 and 90 percent for AUTOLEVEL and SOURMA respectively. Therefore, there is non-linear function through to the percent increase in probability differing at each initial probability. We can conclude that MACHINE is the main constituting factor in export status.
The positive effect of the ratio of quality assurance personnel in export is significant. Therefore, quality assurance personnel are one of the internal factors that have a positive effect on product quality.
Modern techniques prevent firms from exiting export market, as associated odds ratio (62.35) is positive and significant at the level of 3 percent. Firms with old technology (Domestic and Asia second-hand) are more likely to supply domestic market that aims at lower income consumers and requires non-sophisticated technique. Those sources of machines being significant at 4 percent associated positive odds ratio (21) in export suggests
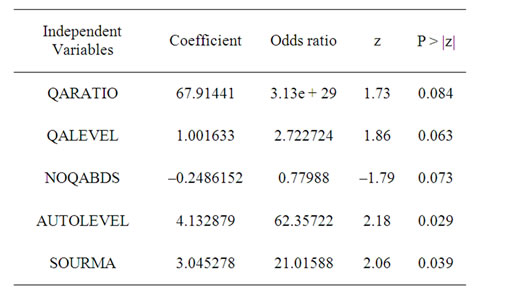
Table 2. Restricted model.
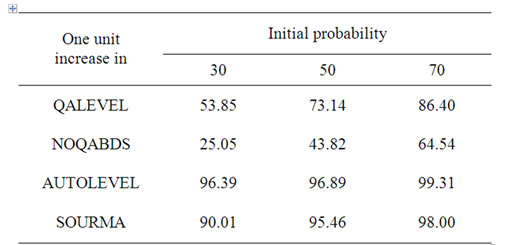
Table 3. Estimated probability to export status (percent).
that firms which use some NICs Japanese, European, American machines and machines from other developed countries are likely to conduct export involvement. Source of machines and automatic level are the two characteristics of machines. The formation of two variables is founded on the quality grades of machines that can produce good quality products. However, the meaning of two variables is different, as a result, the results are quite different in terms of odds ratio or coefficient that means automatic level highly influences the export status than source of machines.
One unit increases in QALEVEL effects different level of export probability. One unit increases in QALEVEL at initial probability at 30, 50 and 70 resulting in an increase of 23.85, 23.14 and 16.40 percentage points in export probability. At the initial probability at 30 and 50, one-unit changes in QALEVEL have nearly similar effects on export probability.
One interesting finding from logit model is contrary to what we assumed that QA BDS improve the business condition to export. Though the variable of number of use QA BDS is significant, the negative sign for the number of QA BDS is of some concern. It can be explained that QA BDS is less likely to affect the QA system to export group than to non-export group. The negative sign seems to contradict the widely held view that benefits usually arise from QA BDS use. An obvious explanation for the results is that Vietnam BDS market is underdeveloped, so low added value is reflected on exporters’ use. The BDS is only intermediate and does not have direct proxy impact on export. QA BDS may be effective on the quality system but the relationship between QA BDS and export status may be less weighted. The level of quality assurance may shadow the effect of QA BDS. The effect of QA BDS takes place via the more indirect process of QA adoption, which may more likely be assimilated by non-exporters, than the exporters with the existing logical quality assurance system. The sign of QA BDS is not the same as our expectation but it is appropriate to QA BDS per employee and explanation the findings of [8].
3.3.2. Graph
This part of analysis seeks to determine the relationship between links within non-exporter and the likelihood of exporters possessing semi-automatic and mechanical machine. The result suggests that the automatic and source of machine are important determinants of spillovers between export and non-export groups. We apply marginal effect to break the difference level of quality assurance and quality assurance ratio from export and non-export groups. This section tries to view a probability of response to variation in independent variable. We will perform the graph in Eviews [9] and guidelines of [10].
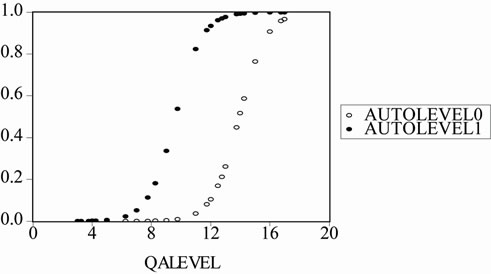
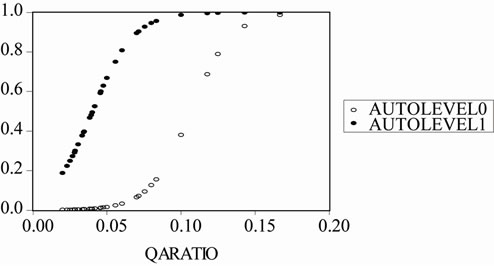
Two Figures 1(a) and (b) above show the impact of quality assurance level on the probability to export. Given the value of QA level, firms have semi-automatic machines (for Figure 1(a)) and source of machines (for Figure 1(b)) have a higher probability to export than those firms that possess machines characterized below automatic level. The gap between two curves indicates the marginal effect of semi-automatic machines on the probability to export. From Figure 1(a), when the probability to export is at 0.5, the marginal effect of semiautomatic machines is at 4.5 QA mark. That means if enterprises have machines lower than semi-automatic level, they should have quality assurance level at 14 marks instead of 9.5 marks. In addition, if quality assurance level is at 14, probability to export of enterprises with semi-automatic machines and with less than semiautomatic machines is at 100 percent and 50 percent respectively.
Comparing the marginal effect of semi-automatic level and the source of machines, we find that the pattern of two pictures is not very different but source of machines is less effective than semi-automatic level.
Two Figures 2(a) and (b) plot probability to export against the change in the ratio of quality assurance personnel in the total employees. There is a large difference between the marginal effect of semi-automatic machines (0.06) and source of machines (0.04) with the probability
 (a)
(a)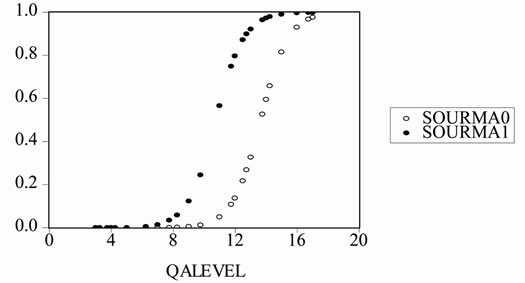 (b)
(b)
Figure 1. The impact of QALEVEL on the probability to export.
to export at 0.5. Comparing between
Figure 1(a) and Figure 2(a), the gap between semi-automatic and mechanization is larger than that between the different sources of machines. The pattern of Figure 1(a) and (b) is similar to the pattern of Figures 2(a) and (b). It again affirms that AUTOLEVEL has more weighted impact on export orientation than source of machine.
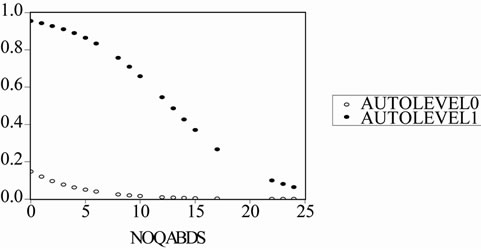
Two Figures 3(a) and (b) plot the predicted probability of export against the number of use QA BDS. Because coefficient of NOQABDS is negative, therefore the pattern of Figures 3(a) and (b) is inverse the pattern from Figure 1(a) to Figure 2(b). Given the mean value of other variables in the model, there is not a good combination between NO-QABDS and semi-automatic machines as well as NO-QABDS and sources of machines. That can be explained by the explanation: No matter how many NOQABDS enterprises use, they have not a chance to export if they don’t have semi-automatic machines as well as source of machines from NICs or developed countries. Despite an increase in NOQABDS, the NOQABDS have no capability to reduce significant percent of probability to export. As mentioned in the previous part, NOQABDS is less likely of use for non-exporting enterprises.
4. Conclusions
4.1. Conclusions from Logit Model
The finding might indicate that the impact of domestic market through to the proxies’ quality assurance, automatic level, source of machine and ratio of quality assurance personnel in total employees is not limited to competition while the number of use of QA BDS are more likely to affect the non-export group. These variables including men, methods, and machines positively affect the international involvement of business as being expected.
The higher automatic level requires more demanding supervisions and less manual work, which means much responsibility for planning, productivity and quality of work, is required. The operator when working with automatic machines needs higher education in technical skills rather than when working with mechanical machines. Automatic machines may require more precise technical knowledge than mechanical machines do. Therefore, automatic machine satisfy the international market than the low automatic level. Moreover, these explanations satisfy the reason why the ratio of quality assurance personnel in total employees of export group is higher than that of the non-export group. Source of machine from developed countries and some NICs contributes to successful involvement in international market. But source of machine is less effective on export orientation than automatic level.
 (a)
(a)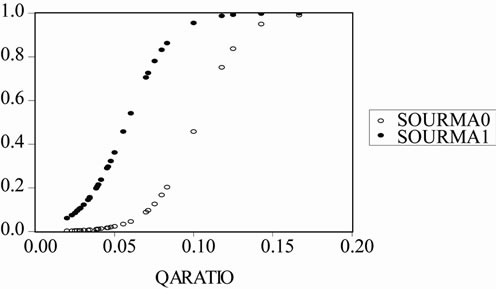 (b)
(b)
Figure 2. The impact of ratio of QA personnel in total employees on the probability to export.
 (a)
(a)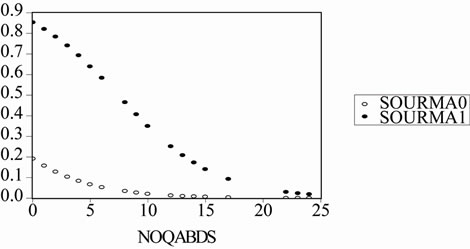 b)
b)
Figure 3. The impact of use QA BDS on the probability to export.
Less manual work is required with higher automatic machines, which increases accuracy. Besides, higher automatic machines clearly prove safety procedures using for product. Mechanization requires more manual work and accuracy is limited.
Systematic quality assurance activities are obligatory to export plastic products. Despite source of machine and automatic level, plastic manufacturers can export if they have excellent quality system. The deeper the adoption in quality assurance system, the higher probability that enterprises have to be potentially involved in international market. The ratio of quality assurance is less effective than quality assurance level. Finally, NOQABDS is ineffective to the export orientation but may be more effective for non-exporting enterprises to improve product quality. QA BDS attract some concern for donors and the government because using QA BDS reflects low value added for exporters’ use.
In sum, the implication level of quality assurance, automatic level and source of machine are all found be positively significant in explaining the likelihood that firms link in international market.
4.2. Recommendations
QA BDS do not impact QA system in short-term; therefore, QA promotion program should be lasting in longterm. The promotion program can be divided in two periods and two grades. Firstly, the QA awareness campaigns, education and technology upgrading quality assurance in the plastic sub-sector promote compliance to process standard. Quality awareness of personnel by training, introduction of quality improvement process, outlines of procedures that improve management system is our recommendations to improve quality assurance system.
Secondly, programs should concentrate on promoting the volume in BDS market through to voucher system for micro and small enterprises and advisory services that are necessary for business on the road of implementation QA. Voucher program is one of the effective tools to encourage SMEs who have never used services, and service providers who have never contacted small enterprises. Moreover, training should focus not only on quality assurance personnel but also on people who work with them in the process of upgrading quality procedures.
Plastic materials are the most critical problem that obstructs the development of the plastic sub-sector. The government should invest in this area to increase comparative advantages in the international market.
Leasing is not popular to plastic manufacturers, but it is one of the ways to help them improve technology. Moreover, leasing is on progress of SC’s intervention. The policy of restriction in imported old-technology conduct has limited modern diffusion of technology. To impede export status of plastic manufacturers, imported machines help to shorten technological distance between some NICs countries and developed countries that import a large plastic output.
5. Acknowledgements
I am extremely grateful to the staff of the Swisscontact SME Promotion Program in Vietnam, especially Mr Paul Weijers, the program manager, who offers me advice and financial assistance for data collection for this research. My special thanks to all those who help in the research, in particular, Dr. Teoman Pamukcu and to all lecturers staffs for their care, advice, warm support and interesting lectures.
REFERENCES
- World Bank, “A Strategy with Four Pillars India: The World Bank Group Is Developing an Integrated Approach to SME Development in the World’s Second Most Populous Country,” 2001. http://www.ifc.org/sme/acrobat/sme_annual_2001_CH2.pdf
- L. J. Kazmier and N. F. Pohl, “Basic Statistics for Business and Economics,” McGraw-Hill Publishing Company, New York, 1984.
- I. Bamberger, “Product/Market Strategy of Small and Medium-Sized Enterprises,” Ashgate Publishing Limited, Aldershot, 1994.
- S. Morris, R. Basant, et al., “The Growth and Transformation of Small Firms in India,” Oxford University Press, New Delhi, 2001.
- G. C. Reid, “Small Business Enterprise: An Economic Analysis,” Routledge Ltd, London, 1993.
- S. Lall and G. Wignaraja, “Skill and Capabilities: Ghana’s Industrial Competitiveness,” In: M. Goldfrey, Ed., Skill Development for International Competitiveness, Edward Elgar Publishing Limited, Cheltenham, 1997, pp. 247-273.
- K. L. Arnold and M. Holler, “Quality Assurance: Method and Technologies,” Mc Graw-Hill Book Co, Singapore, 1995.
- G. Yoguel and D. Milesi, “Technological and Organizational Capabilities for Development of Competitive Advantages—The Case of Successful SME Exporters in Argentina,” 2000. hptt://www.druid.dk-conferences-nw-paper1-yougel_milesi.pdf
- Quantitative Micro Software, “Eviews 4.0 User’s Guide,” LLC, 2000.
- T. Pamukcu, “Trade Liberalization and Innovation Decisions of Firms: A Case Study for Turkish Manufacturing Industries,” The 7th Annual conference of the Economic Research Forum for Arab Countries, Iran and Turkey, Amman, 26-29 October 2000, pp. 1-26.