Journal of Geographic Information System
Vol.10 No.06(2018), Article ID:89223,17 pages
10.4236/jgis.2018.106037
Spatial Analysis of Federal Protected Areas and Priority Areas for Biodiversity Conservation in Brazil
Valdir Adilson Steinke, Sandra Maria da Silva Barbosa, Venicius Juvêncio de Miranda Mendes, Vinicius Galvão Zanatto, Gabriella Emilly Pessoa, Gustavo Bayma
Department of Geography, University of Brasília, Brasília, Brazil

Copyright © 2018 by authors and Scientific Research Publishing Inc.
This work is licensed under the Creative Commons Attribution International License (CC BY 4.0).
http://creativecommons.org/licenses/by/4.0/


Received: October 26, 2018; Accepted: December 15, 2018; Published: December 19, 2018
ABSTRACT
This study presents a spatial analysis of priority areas for biodiversity conservation (PABCs) in Brazil and their coverage by federal protected areas as an indicator of the level of protection afforded to biodiversity in the country and the convergence of environmental protection policies in the sphere of federal government. Georeferenced data were processed using a geographic information system, enabling the calculation of areas, analyses of superimpositions, localizations, and the obtainment of other information using spatial features manipulated in this system. A comparative analysis is done of the PABCs mapped in two periods (2003 and 2007) to ascertain the evolution of this public policy instrument in detecting environmental priorities in protected areas. The improved coverage of PABCs by protected areas in the more recent mapping indicates a good convergence of environmental policies, which are enhanced by technical improvements to mapping procedures and methods for identifying such areas. As a result, the priority areas for biodiversity conservation could become a protected area regulated and recognized by the federal government.
Keywords:
Protected Areas, Environment, Public Policies, Spatial Information, Geoprocessing, Priority Areas for Biodiversity Conservation

1. Introduction
Brazil has been termed a megadiverse country because it harbors such a large proportion of the planet’s biodiversity: 15% - 20%. It was also the first signatory in the UN Convention on Biological Diversity (CBD). Conservation International has put it at the top of a ranking of 17 countries that host at least 70% of the planet’s animal and plant species. Brazil’s biodiversity is attested by its diversity of ecosystems, biological species, endemic species, and genetic heritage. Due to the Brazilian continental dimensions and great geomorphological and climatic variations, Brazil hosts six biomes and a coastal marine ecosystem [1]. Two of Brazilian biomes are biodiversity hotspots: the Cerrado and the Atlantic Forest. To be classified as a hotspot, the area must contain at least 0.5% (1500) of the 300,000 known plant species in the world and it must also have lost 70% of its primary vegetation [2]. A hotspot is therefore a highly biodiverse area that is under considerable anthropogenic pressure.
The protection of nature, specially biodiversity, and the sustainable use of natural resources are high on the contemporary agenda, being discussed widely and frequently around the world. This is resulted by the concerns about the consequences of the rapid environmental transformations being affected by man’s action [3]. In response, several countries have started holding international events and conventions in a bid to establish regulations for the natural resources use, which are still being exploited unsustainably, potentially leading to shortages or unforeseen environmental impacts.
One outcome of the coordinated world governments action for the creation of nature conservation measures was the Convention on Biological Diversity (CBD), signed in Rio de Janeiro in June 1992. One basic principle espoused in this document is that the states have the sovereign right to exploit their own resources, based on their own environmental laws. These countries should take measures to ensure that their activities do not harm the environment [4].
The CBD goal is the conservation of biological diversity, with the maintenance of the variety of terrestrial, airborne, and aquatic organisms, the sustainable use of biodiversity and its components, and the fair and equitable use of the benefits it promotes [5]. The establishment and management of protected areas constitute one of the most important measures. It assures that the world’s natural resources are conserved in order to meet society’s present and future environmental needs.
The eighth CBD article establishes that each party should set up a system of protected areas and measures to conserve biological diversity and promote the protection of ecosystems and natural habitats [6]. As a result, a law was approved in Brazil on July 18, 2000 (law #9.985), creating the National System of Protected Areas (Sistema Nacional de Unidades de Conservação da Natureza, SNUC).
To fulfill the CBD goals and requirements, Brazil had to develop a national biodiversity policy, which was instated through Federal Executive Order #4.339 on August 22, 2002. It also created a national program for biological diversity (Programa Nacional de Diversidade Biológica, PRONABIO), which executive component is the Project for the Conservation and Sustainable Use of Brazilian Biological Diversity (Projeto de Conservação e Utilização Sustentável da Diversidade Biológica Brasileira, PROBIO).
On May 21, 2003, another executive order (#4.703) was issued to rename the program to National Biodiversity Commission (Comissão Nacional da Biodiversidade, CONABIO) [7]. This commission identifies priority actions and encourages sub-projects that involve public-private partnerships, generating and communicating information and knowledge on the topic, which provides technical and financial support for their implementation [8].
As such, initiatives to identify global conservation priorities are rooted mainly in criteria like biological diversity indices and levels of threat to ecosystems. Regional priorities are translated into concrete actions by mapping and identifying Priority Areas for Biodiversity Conservation (PABCs). This is an objective, participative process, which results feed into the planning and execution of conservation actions and protected areas creation. It is understood that knowing the areas and the priority actions for the conservation and sustainable use of natural resources is a key prerequisite for environmental management [9].
The nationwide PABCs mapping was first done in 2003 and subsequently reviewed in 2007, with some partial updates since then. For the 2003 mapping process, PROBIO supported five major evaluations in workshops, which were divided per biome and involved specialists and other stakeholders. The results of these meetings were consolidated in the Map of Priority Areas for the Conservation, Sustainable Use, and Sharing of the Benefits of Brazilian Biodiversity (Mapa das ÁreasPrioritárias para a Conservação, UtilizaçãoSustentável e Repartição de Benefícios da BiodiversidadeBrasileira), published by the Ministry of the Environment in November 2003 and reedited in May 2004, through ministry directive #126 of May 27, 2004.
The Map of Priority Areas for Conservation is designed to assist in the formulation and execution of public policies, programs, projects, and activities under the responsibility of the federal government for:1) the in-situ conservation of biodiversity; 2) the sustainable use of components of biodiversity; 3) the sharing of benefits derived from access to genetic resources and associated traditional knowledge; 4) research and inventories of biodiversity; 5) the restoration of degraded areas and overexploited or endangered species; and 6) the enhancement of the economic value of biodiversity.
The 2007 map includes updates made by the Ministry of the Environment, which were done, preferentially, according to the Systematic Conservation Planning approach defined by the National Biodiversity Commission (CONABIO) in deliberation #39 of December 14, 2005. This approach is based on core ecological concepts, including representativeness, complementarity, efficiency, flexibility, vulnerability, and irreplaceability.
The aim of this study is to analyze the compliance of the Priority Areas for Biodiversity Conservation program by ascertaining the percentage coverage of PABCs different classes by the two types of federal protected area. The percentages of biomes included in these areas are calculated, as is the alignment with current trends in the protection of the most endangered biomes in Brazil, like the Atlantic Forest and the Cerrado [10]. The spatial relationships between these two themes are assessed using geotechnical instruments, which are widely used by diverse areas of knowledge [11].
Geospatial technologies are undergoing constant improvements. Today, there is great potential for geoprocessing systems and tools capable of meeting diverse service requirements. This is a boon for spatial analyses, as it reduces the time taken and costs incurred in producing data, while enhancing the quality of the information [12]. The modernization of the systems, with the alignment and improvement of geospatial and geotechnical standards, data storage and database sharing tends to enable more effective information management. Consequently, these factors are potentially benefitting large-scale land management processes, which in turn helps ensure the compliance of environmental conservation endeavors [13].
It is important to affirm that this study was never done before in Brazil. This research does a significant diagnosis for the Brazilian environmental management, specially when thinking about territory management and biodiversity conservation for the next 20 years.
2. Materials and Methods
The PABC polygons [14] were used in such way that their locations could be compared with the locations of the protected areas so as to identify how much protection they are afforded. It was considered both of their classification level (given by PROBIO) and the representativeness of the protected areas in each biome. The result of this spatial analysis indicated the coherence and internal integration of environmental policies and strategies designed to protect areas of ecological importance from a social and biological diversity perspective.
The database for the spatial analysis is composed of vector themes in the shapefile format (public domain) acquired from the official websites of the information producers: the PABCs from the Ministry of the Environment1,2 and the protected areas from ICMBio3. The database of Brazilian biomes was acquired in 2017 from the IBGE website4, and the polygon of the Exclusive Ecological Zone was obtained from the Department of Hydrography and Shipping5. The software used for the spatial analyses was ArcGis 10.1. The geographical reference adopted in producing and representing the data was the geographical projection based on the SIRGAS2000 datum. The methods for defining protected areas and PABCs are regulated by institutional rules and resolutions. For federal protected areas, the National System of Protected Areas (SNUC) is the main regulation for their creation and management. The guidance issued by ICMBio on September 18, 2007, and May 17, 2008 (Instruções Normativas 3 and 5, respectively), presents supporting legal framework and needed studies, while also defining what procedures and actions are to be taken by society and by the state for a protected area to be proposed and created [15] [16].
Most of the PABCs were identified in regional biodiversity workshops run by Conservation International, where reliable information was gathered about the biological, social, and economic features of the region, which was evaluated by a multidisciplinary group of specialists. It is based on the set of national biomes and the coastal marine ecosystem. The updates are priorities of the Ministry of the Environment and are consistent with the recommendations of the CBD, Systematic Conservation Planning, and CONABIO guidelines. Data analyses are conducted using specific spatial modeling tools and GISs. According to Executive Order #5.092 of May 21, 2004, the Ministry of the Environment is responsible for setting the rules for the identification of these areas.
Given the difficulty of compiling environmental information on the whole territory from different sources and spheres of government into a single centralized database, this study is restricted to federal protected areas. The methodological differences adopted in producing the spatial data and the difficulty in acquiring data from other public entities hamper the compatibility, standardization, and unification of information. Limitations like the reliability of spatial information for regional and nationwide studies are responsible for the incomplete diagnoses and results on to the real coverage of protected areas in Brazil. Even so, these studies constitute important indicators for environmental assessments, and could serve as parameters for decision-making processes and the development of environmental policies [17].
By intersecting the PABCs layers and protected areas in a GIS, the area of each PABC class could be calculated per type of protected area. The areas of the PABCs were rated using the PROBIO classification, according to their conservation priority: 1) extremely high, 2) very high, 3) high, 4) insufficiently known, and 5) new areas known by regional groups. The federal protected areas were classified into “full protection” and “sustainable use,” as set forth in the National System of Protected Areas (SNUC; Figure 1) [18].
As we are dealing here with themes with spatial coverage and a geographical lag, the Albers equal-area conical projection for South America was used to calculate the area―a reference system that enables area calculations in metric units for large geographical areas [19]. The biome layer formed the geographical basis for the evaluations of the protected areas and priority areas for biodiversity conservation.
3. Results and Discussion
By April 2018, 324 land and coastal marine protected areas had been created,

Figure 1. Distribution of federal protected areas in Brazilian biomes. Produced in April 2018 by Sandra Barbosa.
summing approximately 794,000 km2, or little over 9% of Brazilian national territory. Since then, four new protected areas have been created in the Exclusive Ecological Zone, summing around 910,000 km2, extending until 200 nautical miles.
After the layers of information on PABCs and protected areas had been crossed, it was found that 74.3% of the PABCs mapped in 2003 were covered by federal protected areas, since 590,000 km2 of the 790,000 km2 of protected areas are in PABCs. For the 2007 mapping by the Ministry of the Environment using the revised data, the coverage reached 97.2%, since 777,000 km2 of the official areas of federal protected areas are in PABCs (Table 1).
This suggests that this public policy instrument is very well aligned with national and sectorial environmental conservation policies, in view of the evolution of the methods for mapping PABCs. For them to be fully covered by protected areas, greater integration and standardization of environmental information and policies in all spheres of government is needed. This is being encouraged by the development of new national environmental systems for mapping and updating data.
The method for updating PABCs is refined through a participative information management process. In 2015, the Ministry of the Environment began to talk with the Ministry of Science, Technology, Innovation, and Communication for a new Information System on Brazilian Biodiversity. This Information System is consisted of an online platform combining data and information on the biodiversity of Brazil. This would enable more comprehensive studies and results concerning environmental conservation in the country. As well, a greater appraisal and follow-up capacity for the development of the processes and reviews involved, enabling the construction of centralized databases and the standardization of information for decision-making processes.
3.1. Presentation of the Results of the Superimposition of the PABCs per Type of Protected Area Per Biome
Having presented the size of each layer under analysis, tables, graphics, and maps are now used to show the evolution of this public policymaking instrument. It was compared the data on the PABCs mapped out at two different times in relationship with the coverage of federal protected areas in each biome.
From Table 2 and Table 3 it can be seen that the area of PABCs has increased in all biomes except the Pantanal, where it remains unchanged at 60,000 km2. The greatest increase has been seen in the coastal marine ecosystem, 40% of which had PABCs designated in 2003, a figure that had risen to 92% by 2007. Apart from the Pantanal, the Cerrado was the biome with the lowest increase in PABC coverage in the updated version, rising from 682,000 km2 in 2003 to 824,000 km2 in 2007.

Table 1. General data on protected areas and priority areas for biodiversity conservation in Brazil.
Source: Data extracted from the polygons available in official Ministry of Environment databases in 2018.
Table 2. Priority areas for biodiversity conservation per biome (2003).
Source: Data extracted from the polygons available in official Ministry of Environment databases in 2018.
Table 3. Priority areas for biodiversity conservation per biome (2007).
Source: Data extracted from the polygons available in official Ministry of Environment databases in 2018.
In the next stage of the temporal analysis, to ascertain how much the PABCs are overlapped by federal protected areas per biome, the 2003 PABCs map (Figure 2) shows a relatively low superimposition of the two elements. Even though all the biomes contain different classes of priority areas for biodiversity conservation, there is generally a low overlap with protected areas. Some situations are concerning, such as the Pampas in southern Brazil. This area is an ecologically sensitive region that has historically suffered strong anthropogenic pressure, which has just one federal protected area.
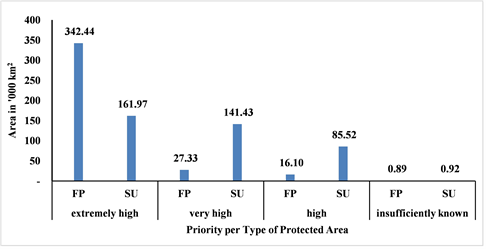
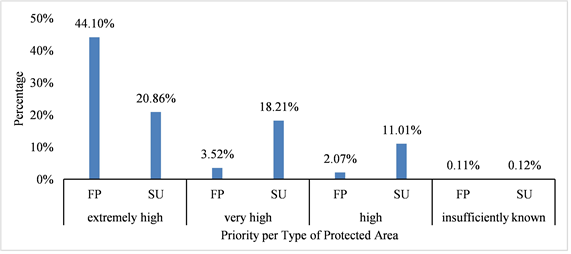
Alongside the spatial analysis shown in Figure 2, the percentages evaluation of the two categories of protected areas and PABCs different classes is important for finding out whether the areas indicated as priority were already protected by federalinstitutions. Graphic 1 presents these data in km2 and Graphic 2 shows the percentage these areas represent per category of protected area.
Graphic 1 and Graphic 2 indicate that in 2003, protected areas were mainly restricted to the highest priority PABCs. These data indicate that the protected areas created until then had an important function for conserving the most sensitive areas. However, lower coverage for areas of high priority, areas that were little known, and new areas known by regional groups.

Figure 2. Coverage of the PABCs by protected areas (2003).
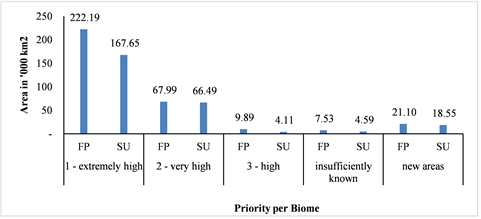
Graphic 1. Geographical area overage of PABCs (2003) by each type of protected area. Legend: FP―full protection; SU―sustainable use.
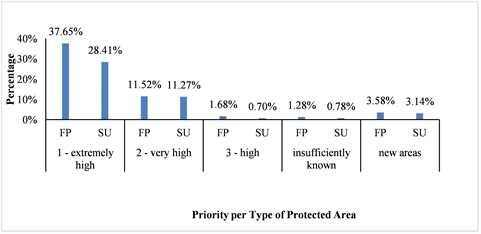
Graphic 2. Percentage coverage of PABCs (2003) by each type of protected area. Legend: FP―full protection; SU―sustainable use.
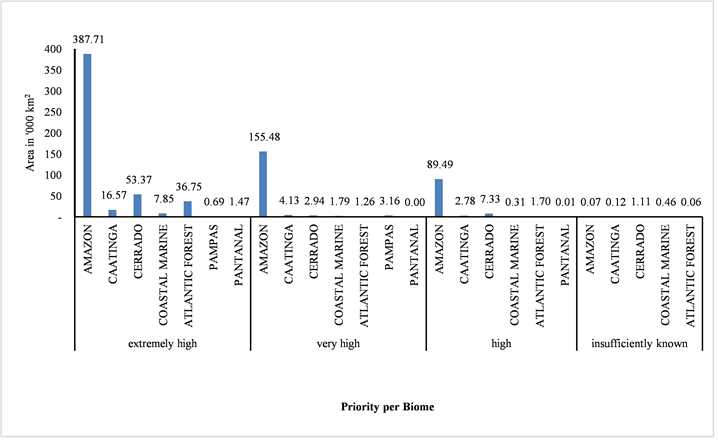
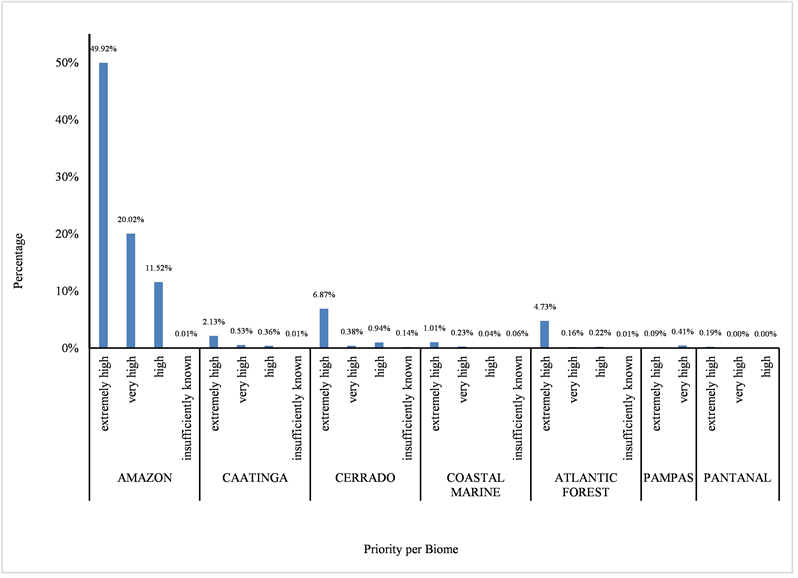
The analysis of the coverage of PABCs (2003) per biome (Figure 3 and Graphic 3 and Graphic 4) reveals a higher concentration of these areas in the Amazon. This result is consistent with the historical conception and responsibility to give far greater attention to this biome than to the others in Brazil. Not least, because of its importance in controlling planetary climate change [20]. Furthermore, although over 1% of the Cerrado, Caatinga, and Atlantic Forest biomes is protected, this protection is only afforded for the highest priority PABCs (classed as extremely high and very high priority), which is consistent with the previous argument.

Figure 3. PABCs per Brazilian biomes (2003).
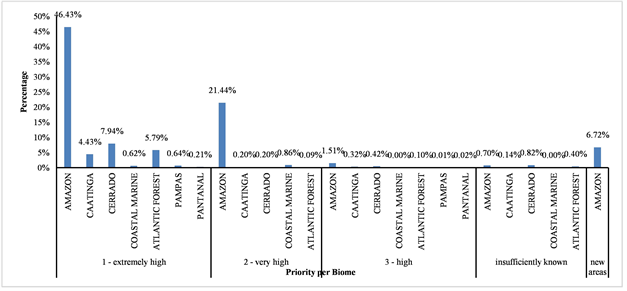
Graphic 3. Percentage coverage of PABCs (2003) per biome.
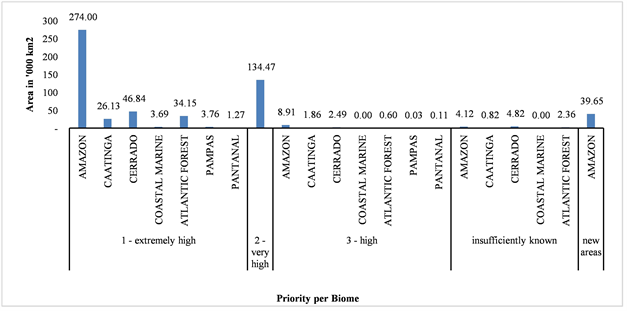
Graphic 4. Geographical coverage of PABCs (2003) per biome.
3.2. Coverage of PABCs Mapped in 2007 by Each Type of Federal Protected Area in Each Biome
In the next stage of the temporal analysis, the PABCs superimposition with federal protected areas in each biome was ascertained, based on the 2007 PABCs map (Figure 4). There is a clear visual difference in the overlapping of these two elements compared with the 2003 map. Although in both maps all biomes were covered by all the PABC categories, with some coverage by protected areas, the coverage was more comprehensive in 2007 than in 2003. However, the representativeness of the protected areas in the biomes remained fairly low. In addition, the situations of greatest concern, such as in the Pampas in southern Brazil, continued to prevail. This is witnessed by the continued existence of just one federal protected area there (Graphic 7 and Graphic 8).
Alongside the spatial analysis in the map above, ascertaining the percentages per category of protected area. Also, PABC and their coverage in the biomes is important for finding out whether the areas indicated as priorities for conservation in 2007 continued to be a priority due to the introduction of new protected areas (of either category) and thereby received protection by law. Graphic 5 shows these data in geographical areas and Graphic 6 shows the percentages these areas represent in each category of protected area.
The graphics above indicate the PABCs mapping evolution between 2003 and 2007, showing a significant increase in the area and percentage coverage of PABCs by protected areas. However, the highest priority PABCs continue to be the protected areas. When the PABCs analysis mapped in 2007 addresses coverage of biomes, the data (Figure 5 and Graphic 7 and Graphic 8) continue to reveal higher concentration in the Amazon than in any other biome in Brazil.
4. Concluding Remarks
In this study, some inconsistency was found between the classes attributed to spatial data by IBGE’s biome polygons and by PROBIO’s PABCs. In practically

Figure 4. Coverage of PABCs by type of protected area (2007).

Figure 5. Coverage of PABCs in each biome of Brazil (2007).
Graphic 5. Geographical area of PABCs (2007) covered by each type of protected area.
Graphic 6. Percentage of PABCs (2007) covered by each type of protected area.
Graphic 7. Geographical area of biomes covered by different classes of PABCs (2007).
Graphic 8. Percentage of biomes covered by different classes of PABCs (2007).
all the biomes, near their borders, there were found to be PABCs with a different classification from the biome class they were in. This could indicate that the coverage and definition of spatial elements for the environmental characterization of an area using geotechnical instruments are not absolute. And in this case, there could be divergences in the characterization and classification of elements superimposed with the biome polygons defined by IBGE.
This study was therefore done considering the IBGE borders of the different Brazilian biomes, assessing the PABCs coherence outside these borders but defined as belonging to the biome. The most representative cases were the Pantanal and the Atlantic Forest, in which several PABCs were found to be outside the borders of the biomes and with a different classification. This could thus interfere in the final percentages. In the Pantanal―the most emblematic case―large polygons outside the biome were ruled out of the analysis because they interfered significantly in the final results, potentially leading to a false diagnosis. This analysis was therefore done considering as many of the original attributes of the polygons from each of the themes as possible, assessing their spatial compatibility.
In view of the fact that the concept of conservation has been adapted and reformulated over time, the justifications and methods for defining protected areas reflect political priorities from the 1970s and 1980s, as opposed to the work done by PROBIO in 2004, updated in 2007. Further, it is worth noting that the institutions responsible for mapping the PABCs presented here used the same conceptions for conservation/preservation area. Thereby, it is generated areas with different levels of priority for each layer of information―protected area and PABC. In other words, one protected area could contain PABCs with different priority levels. Taking this assumption and drawing primarily on data on protected areas, in each biome, it was found that the protected areas are well aligned with the instrument used by the Ministry of the Environment. The instrument is used to define priority areas for biodiversity conservation covering much of their area. Those areas rose from 75% representativeness in the 2003 mapping to 98% in 2007. Almost the whole area covered by protected areas is considered to be important for environmental conservation.
One biome stands out amongst all the others: The Amazon. With a much larger geographical area, occupying almost 50% of the country, and with the greatest number of federal protected areas and PABCs, it accounts alone for over 80% of all the federal protected areas in Brazil, with 15% of its entire territory protected in this way. The Amazon is a particularly high-profile biome, attracting the attention of all sectors of national and international society and a whole host of diverse interests and actors. This leaves the other biomes at a relative disadvantage in terms of protection, which together account for around 20% of all the federal protected areas. In particular, the Cerrado and Atlantic Forest deserve special attention, as their rich diversity is under increasing threat, including several endangered species.
Greater attention should also be paid to the Caatinga, which has just 4% of the federal protected areas. Also, 4% of its geographical area protected by this mechanism. Our analysis of the quantity and quality of protection showed that the protected areas in the Caatinga have fewer use restrictions and have lower ecological priority than in the original protected areas (full protection) and PABCs (of the highest priority). The creation of new protected areas in this biome could be reviewed, not only for its biological value but also for its social value, considering the restrictions on use and level of threat (45%) in the Caatinga as identified by PROBIO.
The Cerrado accounts for 8.5% of the federal protected areas, but just 3% of this biome is actually federally protected areas. However, due to the great vulnerability and fragility of this ecosystem, new protected areas should be introduced within the area indicated by PROBIO. Also, priority should be given to create new protected areas in the PABCs classified as extremely high and very high priority, thereby curbing the impacts of the existing and growing trend to convert forested land into agriculture, amongst other pressures.
The Pantanal needs several measures―preferably in the short term―to accelerate the conservation process, because it has very few protected areas inside its borders―less than 1% coverage―and mainly because it receives waters from other regions, which exacerbates its vulnerability.
The Atlantic Forest should continue at the top of the priority list for nature conservation because it is one of the most devastated biomes, stretching back to colonial times. It would also be worth adopting measures to restore degraded areas in this biome by reforesting them. In a biome that has already suffered repeated cycles of degradation and had 48% of its area identified as a priority for conservation in 2007, it is concerning that 90% of its area has no legal protection.
The Pampas and the coastal marine ecosystem each have their own particularities: the Pampas is the smallest biome in geographical terms and the coastal marine ecosystem has few PABCs for its high level of priority. They both deserve attention because their conservation needs and capacities are greater than the currently provided. In the specific case of the Pampas, the introduction of managed forests to grassland areas is a growing and worrying phenomenon.
Environmental policy gained increasing pride of place on the government agenda and, in the same way, in civil society agenda, especially in the 1980s and 1990s. The work done by PROBIO in 2002, published in 2004, serves as a parameter for evaluating the protection provided by protected areas. The process began with discussions, followed by implementation, and, finally, the assessment of the areas, which inevitably included evaluating protected areas.
Despite the time lag since the most recent mapping, it is worth assessing how many of these priority areas for biodiversity conservation could be instated as protected areas regulated and recognized by the federal government, since these areas correspond to a significant portion of the nation’s geographical area.
Conflicts of Interest
The authors declare no conflicts of interest regarding the publication of this paper.
Cite this paper
Steinke, V.A., da Silva Barbosa, S.M., de Miranda Mendes, V.J., Zanatto, V.G., Pessoa, G.E. and Bayma, G. (2018) Spatial Analysis of Federal Protected Areas and Priority Areas for Biodiversity Conservation in Brazil. Journal of Geographic Information System, 10, 718-734. https://doi.org/10.4236/jgis.2018.106037
References
- 1. Cardoso, F.H. and De Lemos, H.M. Primeiro Relatório Nacional para a Convencao sobre Diversidade Biológica.
- 2. Myers, N., et al. (2000) Biodiversity Hotspots for Conservation Priorities. Nature, 403.
- 3. Borges, C., Pereira, L., Pereira, A.A., Col, B. and Ambiental, D. (2009) Evolution of the Environmental Legislation in Brazil. Revista em Agronegócios e Meio Ambiente, 2, 447-466.
- 4. Medeiros, R. (2006) Desafios à gestao sustentável da biodiversidade no Brasil Challenge for thesustainable management ofbiodiversity in Brazil. Floresta e Ambiente, 13, 1-10.
- 5. Brasil, M.doM.A.do A Convencao sobre Diversidade Biológica - CDB. In: Decreto Legislativo, No. 2, de 5 de junho de 1992, 32.
- 6. Medeirosand, R. and Young, C.E.F. (2011) Contribuicao das unidades de conservacao brasileiras para a economia nacional: Relatório Final. 121.
- 7. Prates, A.P.L. and Irving, M.deA. (2015) Conservacao da biodiversidade e políticas públicas para as áreas protegidas no Brasil: Desafios e tendências da origem da CDB às metas de Aichi. Revista Brasileira de Políticas Públicas, Brasília, 5, 27-57.
- 8. Conservacao da biodiversidade: Legislacao e políticas públicas/Roseli Senna Ganem (org.), Brasília: Camara dos Deputados, Edicoes Camara, 2010. 437 p. (Série memória e análise de leis; n. 2).
- 9. Chávez González, H., González Guillén, M.deJ. and Hernández de la Rosa, P. (2015) Metodologías para identificar áreas prioritarias para conservación de ecosistemasnaturales. Revista Mexicana de Ciencias Forestales, 6, 8-23.
- 10. MMA (2007) áreas Prioritárias para a Conservacao, Uso Sustentável e Reparticao de Benefícios da Biodiversidade Brasileira: Atualizacao - Portaria MMA, No. 9, de 23 de janeiro de 2007.
- 11. HENRY-SILVA (2005) A importancia das unidades de conservacao na. 127-151.
- 12. Oliveira, A.P.G., Mioto, C.L., Paranhos Filho, A.C., Gamarra, R.M., Ribeiro, A.A. and Melotto, A.M. (2015) Uso de geotecnologias para o estabelecimento de áreas para corredores de biodiversidade. Revista árvore, 39, 595-602.
- 13. Rajabifard, A., Binns, A., Williamson, I., Fellow, R. and Platform, E. (2005) Creating an Enabling Platform for the Delivery of Spatial Information.
- 14. Maracchi, G., Pérarnaud, V. and Kleschenko, A. (2000) Applications of Geographical Information Systems and Remote Sensing in Agrometeorology. Agricultural and Forest Meteorology, 103, 119-136.
- 15. MMA (2004) áreas Prioritárias para Conservacao. Portaria, No. 126, 2-3.
- 16. Drummond, J., Franco, J. and Oliveira, D. (2011) Uma análise sobre a história ea situacao das unidades de conservacao no Brasil. Conservacao da Biodiversidade, 341-385.
- 17. Lemes, P., Faleiro, F.A.M.V., Tessarolo, G. and Loyola, R.D. (2011) Refinando dados espaciais para a conservacao da biodiversidade. Journal for Nature Conservation, 9, 240-243.
- 18. Tofetiand, A. and Campos, R.N. (2016) Análise Do Território Normado Pelas Unidades De Conservacao No Brasil. Revista da Anpege, 12, 299-327.
- 19. CONCAR Comissao Nacional de Cartografia (2011) Perfil de Metadados Geoespaciais do Brasil—Perfil MGB. 197.
- 20. Malhi, Y., Roberts, J.T., Betts, R.A., Killeen, T.J., Li, W. and Nobre, C.A. (2008) Climate Change, Deforestation, and the Fate of the Amazon. Science, 319, 169-172.
NOTES
2PABC (2007): http://mapas.mma.gov.br/i3geo/datadownload.htm.