Journal of Geographic Information System
Vol.5 No.5(2013), Article ID:38187,15 pages DOI:10.4236/jgis.2013.55044
A Web-Based Cancer Atlas of Saudi Arabia
1Space Research Institute, King Abdulaziz City for Science and Technology, Riyadh, Saudi Arabia
2King Faisal Specialist Hospital and Research Centre, Riyadh, Saudi Arabia
Email: *alahmadi@kacst.edu.sa
Copyright © 2013 Khalid Al-Ahmadi et al. This is an open access article distributed under the Creative Commons Attribution License, which permits unrestricted use, distribution, and reproduction in any medium, provided the original work is properly cited.
Received August 3, 2013; revised August 6, 2013; accepted September 6, 2013
Keywords: Cancer Incidence; Web-Based Mapping; GIS; Colorectal Cancer; Saudi Arabia
ABSTRACT
There is a distinct lack of online atlases to visualize and explore cancer incidence in Middle Eastern countries despite the clear benefit that such tools can deliver. This paper describes the development and implementation of a cancer Atlas of Saudi Arabia, which is a web-based client-server application with built-in analysis functions for analyzing patterns of cancer incidence. Built using ESRI’s ArcGIS Server API and ASP.NET, the atlas contains 45,532 incidences of cancer for the period from 1998 to 2004, which were provided by the Saudi Arabian National Cancer Registry. This tool is aimed at health care practitioners and researchers, who can use this tool for exploring cancer distribution and investigating trends, and as a decision support tool for service allocation. The tool allows users to map cancer incidence and undertake analyses at four spatial scales from city to national level.
1. Introduction
Cancer is a leading cause of death in the world, affecting populations in countries of varied levels of industrialization and wealth. Although 70% of cancer deaths are in low and middle income countries, the incidence in all countries, including high income countries, is expected to increase over the next few decades. In 2008, there were 7.8 million deaths attributable to cancer, and this number is expected to increase to more than 11 million in 2030 [1]. With such a global presence in public health, research is ongoing to explore not only the aetiology of the disease but also the spatial variation in the incidence of cancer. A greater understanding of the spatial distribution of different types of cancer can be used to target early screening efforts and treatments in those areas where the need is greatest.
The use of Geographic Information Systems (GIS) and spatial analysis techniques is a relatively new area of investigation in cancer research. Elevated rates of breast cancer in Cape Cod between 1982 and 1990, when compared to the state of Massachusetts as a whole, prompted Brody et al. [2] to consider the challenges of using GIS to investigate the potential environmental influences of breast cancer from hormone disrupters in drinking water or from exposure to pesticides. Subsequent analyses were reported in Brody et al. [3,4]; no evidence was found for a relationship between breast cancer and drinking water contaminated by wastewater but a small increased risk was found for some pesticides. Around the same time, Biggeri et al. [5] investigated the effect of four sources of air pollution on lung cancer, including the effect of distance. They found strong relationships between lung cancer and proximity to the city centre and an incinerator, with decreasing risk as distance from these places increased. Since then, a number of cancer studies have appeared in the literature and utilized spatial analysis and GIS for disease mapping, exposure and risk assessment [e.g. 6-10]. Beyond the methods used by these authors to map and visually assess patterns in cancer incidence/ mortality, advanced spatial analysis methods have been applied to identify spatial clusters of different cancers. For example, Wang [11] applied the R statistic of Rogerson [12] to look for spatially significant clusters of breast, lung, colorectal and prostate cancers in Illinois for the period from 1986 to 2001. Vieira et al. [13] used a similar approach to assess potential clusters in the incidence of breast, lung and colorectal cancers in Massachusetts. In this study, the authors considered length of residence (up to forty years prior to diagnosis) to adjust for population movement. Using generalized additive models, they found that after adjusting for confounders, breast cancer hotspots increased and were statistically significant near a military base and groundwater plumes.
Interest in GIS as an analytic tool for cancer incidence analysis remains strong, as evidenced by recent publications (see, for example, [14,15]). However, the focus to date has been largely on breast and lung cancer, perhaps due to larger numbers of diagnosed cases and the interest in potential environmental determinants of these cancer types.
All of the above examples have been concerned with the investigation of case studies based on a small number of cancers or they have a limited spatial focus. To provide a more comprehensive overview of cancer incidence or mortality, a number of different cancer atlases have been developed (see [16] for an overview of selected atlases). The Atlas of Cancer Mortality of the United States for the period from 1950-1994 was originally published in hard copy, but with rapid changes in IT and the internet, web-based applications have become a more common way to rapidly disseminate this type of information to a wider audience. Initially a method of static map dissemination, recent advances in Web 2.0 technology [17] mean that advanced spatial analysis functionality can now be embedded into a web-based GIS as a lightweight browser application. The Atlas of Cancer Mortality is now available as an online atlas with both static and dynamic mapping capabilities [18]. Other online atlases include the Pennsylvania Center Atlas (PACA) [19,20], the Interactive Cancer Atlas (InCA) for the US, [21], the Cancer e-Atlas, covering Yorkshire and Humberside in the UK [22], and the Atlas of Cancer in India [23]. Some of the online versions allow for the dynamic production of maps that can illustrate the type of cancer, age and gender of patients by area as well as basic statistics on cancer incidence. Online tools with a broader health focus are also available, for example to assess local health outcomes in the city of London, such as the London Healthcare Benchmarking Tool [24] and the Health Needs Assessment Toolkit [25]. These sites allow healthcare professionals, decision makers and the public to create maps or charts for downloading and to show how the various health outcomes in their local area compared to other areas in London. The geographic focus of existing online cancer atlases and broader health online applications has remained on more developed countries, with other highly populated regions in the world underrepresented.
Reflecting this unintentional “global north” perspective, there is a distinct lack of online atlases to visualize and analyze cancer incidence in Middle Eastern countries despite the clear benefit that such tools can deliver. This paper describes the development and implementation of the Cancer Atlas of Saudi Arabia (CASA), which is a web-based client-server application with built-in analysis functions for analyzing patterns of cancer incidence. Built using ESRI’s ArcGIS Server API and ASP.NET, the atlas contains 45,532 incidences of cancer for the period from 1998 to 2004, which were provided by the Saudi Arabian National Cancer Registry (SCR). This tool is aimed at health care practitioners and researchers, who can use it to identify cancer “hotspots” and investigate trends, and also as a decision support tool for service allocation. The tool allows users to map cancer incidence and undertake analyses at four spatial scales from city to national level. The CASA extends the functionality of previous online cancer atlases through the provision of additional mapping types, animation, the ability to export the maps and graphs as high quality graphics, and the calculation of cancer rates that adjust for population and age. The technology used to build the CASA is also sufficiently generic that it could be easily transferred to other areas and health outcomes beyond the one presented here. The functionality of the atlas is illustrated using colorectal cancer in Saudi Arabia as an example.
2. Development of the Atlas
The functionality of the Cancer Atlas of Saudi Arabia (CASA) was driven by the requirements of the end-user, i.e. researchers and health practitioners. The literature on existing cancer atlases and cancer analysis was reviewed and the end-users were interviewed to undertake a needs assessment. It was clear from both these exercises that the atlas must be capable of both statistical and spatial analysis. As well as allowing the user to create and export maps, figures and tables showing counts of people diagnosed with cancer by cancer site, gender, age groups, stage distribution, morphological distribution, region and geography, users wanted to visualize the data at different spatial scales and over time. To analyze spatial and temporal changes simultaneously, animation capabilities were added. Table 1 lists the specifications of the CASA in comparison with those of the main online cancer atlases. Although this list is not meant to be fully comprehensive, we did not find comparable atlases for other Middle Eastern countries (in English or Arabic). From Table 1, it can be seen that the CASA was developed with a greater level of functionality and flexibility. The architecture of the system is outlined in the next section followed by a description of the data, how cancer incidence is reported and an overview of the statistical and spatial interface of the atlas.
2.1. Architecture of the System
The atlas was developed using ESRI’s ArcGIS Server API software for Flex [26]. The ESRI API provides a comprehensive set of functions for designing and creating professional cartographic products from a client computer or mobile device using a browser. The CASA is comprised of four main components, as shown in Figure 1:
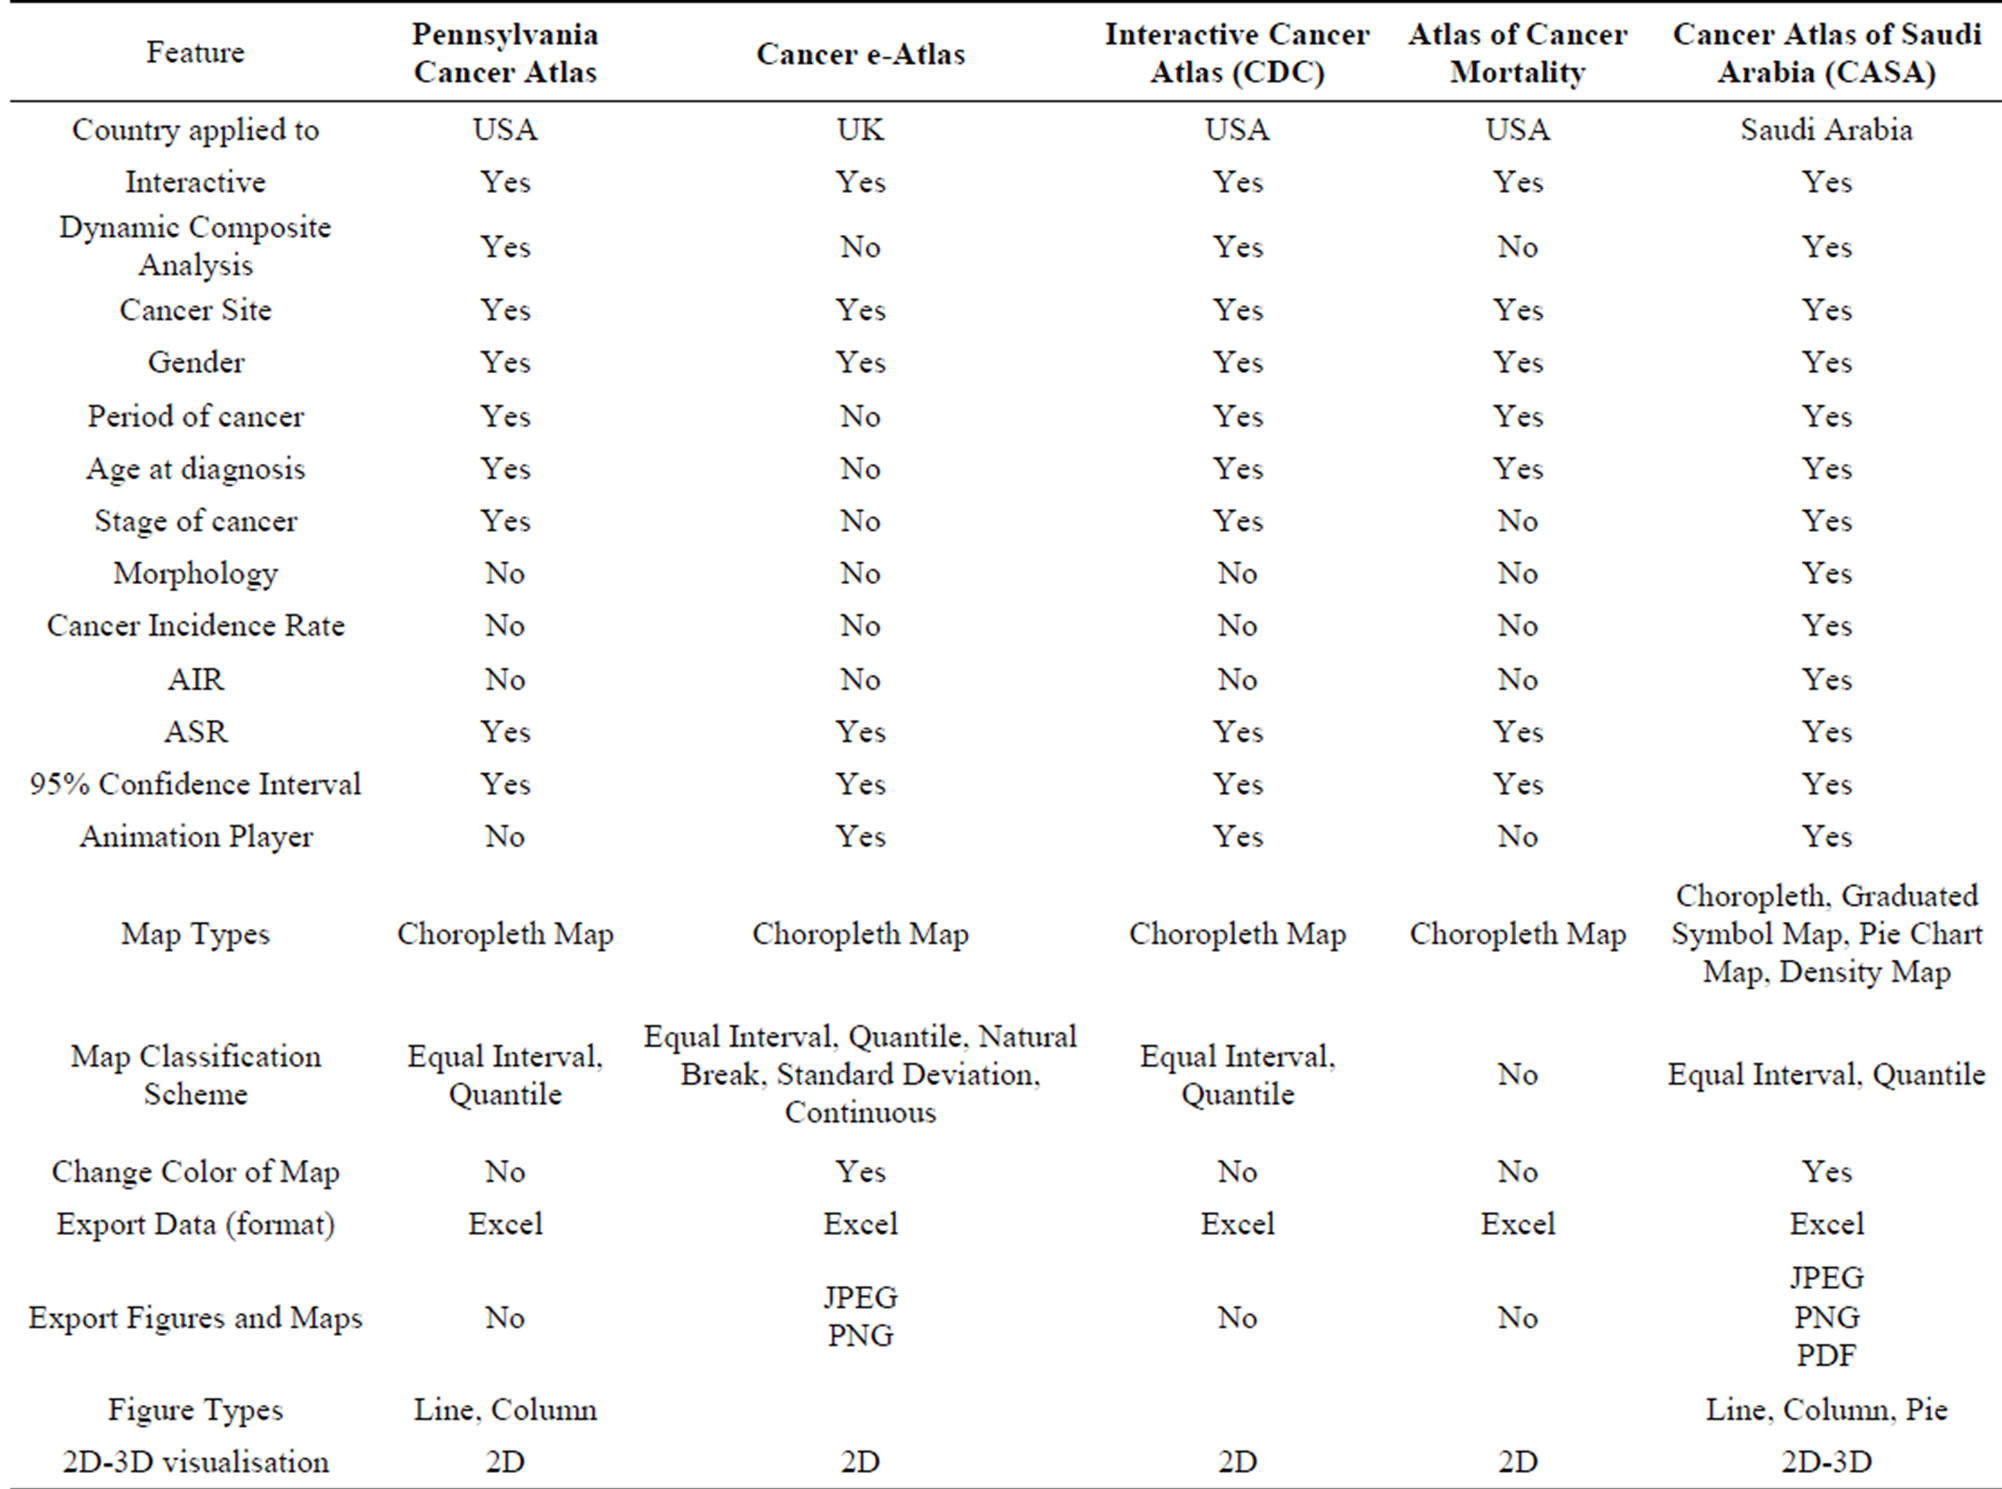
Table 1. Comparison of the features of different cancer atlases with the CASA.
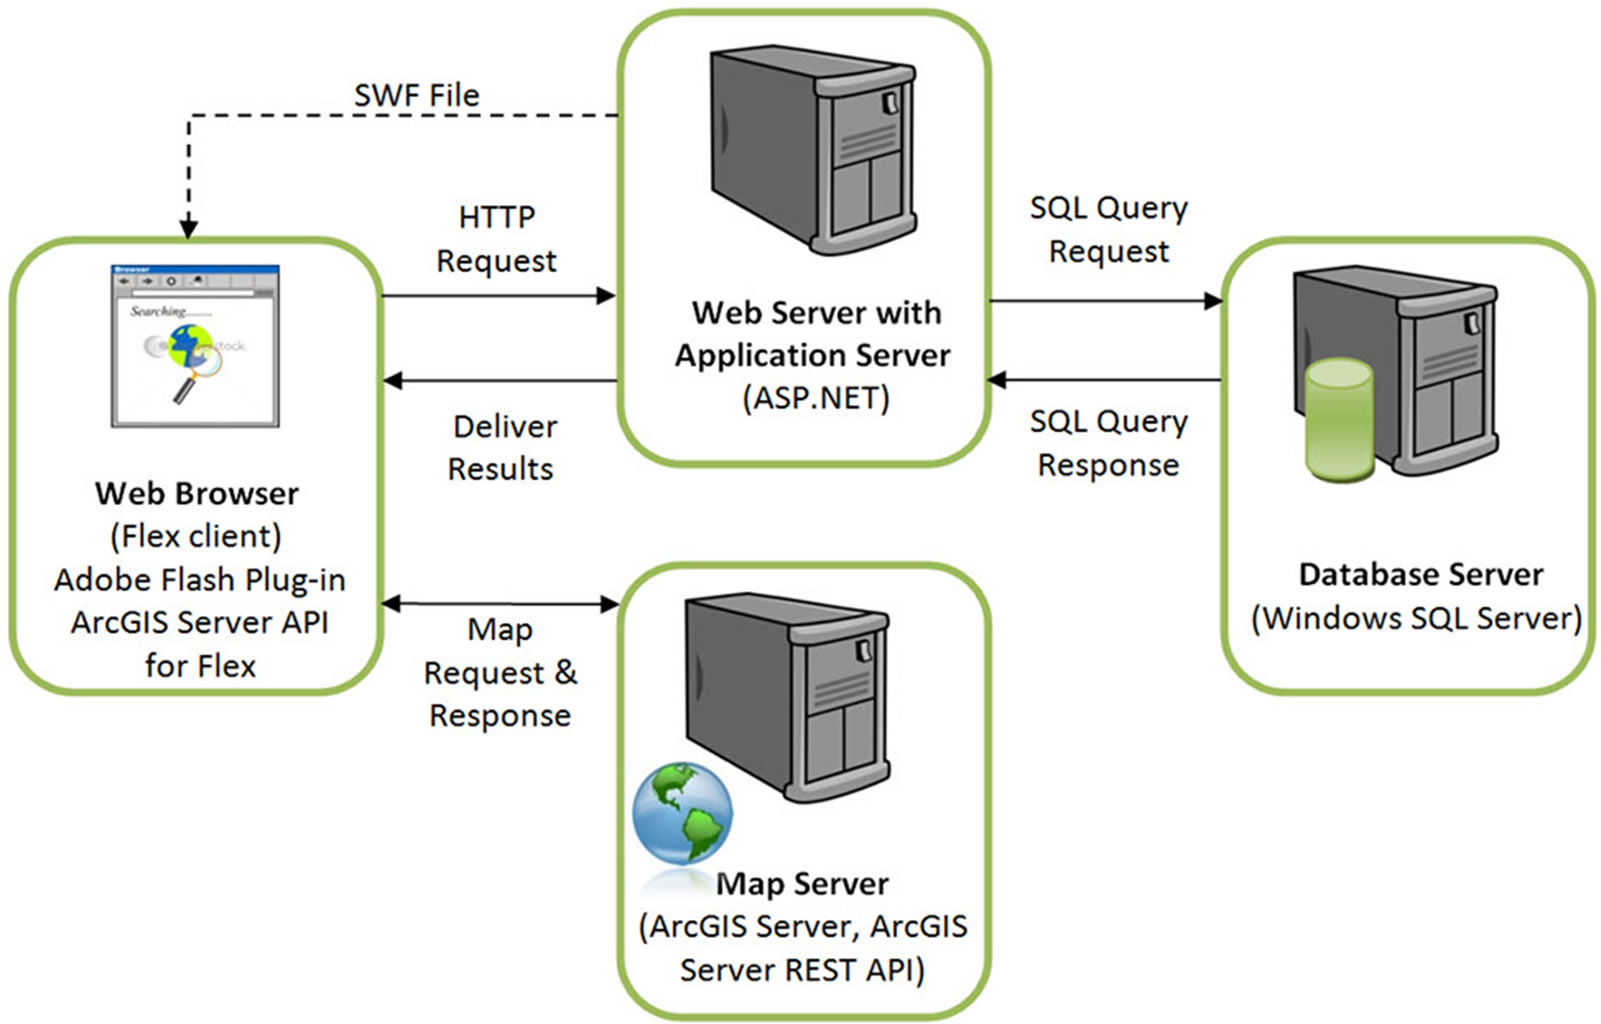
Figure 1. Architecture of the web-based cancer atlas.
• The Client: Flex was used to build the web client for the atlas, where MXML and Action Script define the layout, appearance and behavior of the application. These were compiled into a single SWF file that makes up the Flex client CASA application. Maps and analyses are displayed in the client using the functionality from the ArcGIS Server API for Flex.
• The Web and Application Server: The web server responds to client requests from the databases or the map server. ASP.NET was used to build the web application server, since it is a powerful tool for creating dynamic and interactive web applications. The cancer database is maintained in a Microsoft SQL Server and the operating system is Windows Server, so the application server interfaces with these other components seamlessly.
• The Map Server: The map server fulfills spatial queries, conducts spatial analysis, and generates and delivers maps to the client based upon requests by the users. The output from the map server can be a simple map image in a graphic format or map elements served by ArcGIS Server.
• The Database Server: The database server houses the cancer data in a relational database structure stored in Windows SQL Server 2008 (Enterprise Edition).
The design of the client interface was the single most important consideration, given that the target end-users were unlikely to have much technical knowledge and skills in computing or the principles of GIS. The design was partly driven by a review of existing atlases (Table 1), which were critiqued from a design as well as a functionality perspective. Users were also involved in the development process in order to offer the right level of GIS functionality while still providing the opportunity to create high-quality maps, charts, tables and commentaries on cancer incidence. The system is also flexible enough to allow for additional functionality to be added in the future based on feedback from the users. Choice of variables and options was designed to be as intuitive as possible. The design was implemented and tested with a set of potential users. The system provided considerable flexibility in terms of satisfying the needs of the users and high levels of responsiveness and performance during tests in an office where client computers were connected over a local network to a server in the office. The result was a web-based client-server system which is relatively straight-forward to use, offers the option of an Arabic or an English interface and worked well during feedback sessions with staff who work in the Saudi Cancer Registry. Only the English interface is shown in this paper. The atlas is currently only available on an internal network at the Saudi Cancer Registry while testing continues for the next year and feedback continues to be collected. The plan is to then open up the atlas to relevant health agencies and organizations working at the regional level in Saudi Arabia.
2.2. Data
The data were supplied by the Saudi Cancer Registry (SCR), a government agency which collects, collates and evaluates statistics on cancer incidence, survival and mortality in Saudi Arabia. The statistics on cancer incidence included the most common types of cancers which had been reported and recorded in Saudi Arabia from January 1998 to December 2004. The total number of patients diagnosed with cancer in this period was 45,532. The SCR has detailed medical information about each individual cancer case, but due to confidentiality, this data has not been made available for the atlas.
After georeferencing and cleaning the original cancer database, there were fourteen variables for each individual cancer case, including: gender, age, birth date, marital status, region, city, diagnosis date, site, topography, morphology, behavior and stage of diagnosis. The data were then aggregated for use at four spatial levels: national, regional, governorate and cities. At present there are no plans to analyze the data at a finer scale.
To estimate the annual population between 1998 and 2004, the 2004 Saudi census was used, along with annual population growth estimates [27]. Estimates were compiled for the four levels of geographical resolution. Growth rates were obtained from the Central Department of Statistics and Information (CDSI) for the whole of Saudi Arabia and the thirteen regions; as gender is not distinguishable in this data, estimates were used. Growth rates were not available at the governorate or city region so they were assigned the growth rates of the regions in which they are contained. This could be subject to the ecological fallacy [28], as areas within a region are unlikely to all be the same. However, given the data available, this was the best possible solution.
2.3. Reporting of Cancer Incidence
The rates of cancer incidence in each administrative zone over a geographical region provide an important measure of the relative risks of individual cancers in each zone. Such rates provide direct estimates of the probability or risk of cancer or other illnesses and are particularly important for epidemiological studies. The absolute or relative rates of cancer incidence are especially important for comparative studies, e.g. comparing rates of cancer incidence at two or more different times, for measuring change over time or for comparing rates in different zones. Three of the most common indices for cancer research are the crude incidence rate (CIR), the age-specific incidence rate (AIR) and the age standardized incidence rate (ASR) [29-31], which are calculated in the CASA. The CIR is expressed as the total number of incidences of cancer for each 100,000 people in the population. However, rates of cancer incidence vary greatly with age, and the crude rate is strongly influenced by the demographic structure of a population. Hence, if the population structure changes over a period, the crude rate over that period may be artificially altered. For similar reasons, one cannot compare crude rates across geographical areas with different population age structures. Therefore, in order to assess trends in the incidence of a particular type of cancer or compare the incidence over geographical areas or between different cancer registries, it is necessary to standardize the rates with respect to age through computing the AIR. The AIR is the number of particular types of cancer incidences occurring during a specific period in a population of a specific age and gender, divided by the number of the mid-year population of that age and gender. The AIR for age class i is calculated as:
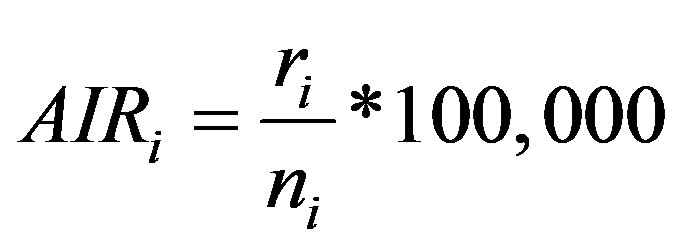 (1)
(1)
where ri is the number of incidences in the age class i and ni is the corresponding person-years of observation. The Age-Standardized Incidence Rate (ASR) is a summary measure of the rate of cancer incidence which a population would have if it had a standard age structure. Standardization is necessary when comparing several populations which differ with respect to age structure; in effect, this allows the researcher to keep age constant to see how a rate varies across areas. The most frequently used standard population is the World Standard Population. The calculated incidence of a cancer is known as the World Standardized Incidence Rate. The populations in each age-class of the Standard Population are used as weights in the standardization process. Expressed per 100,000 people, the ASR can be computed as [29]:
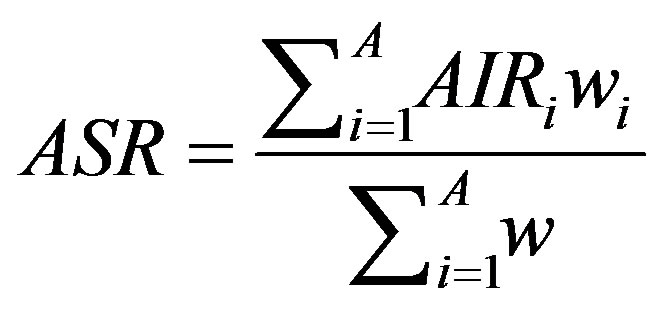 (2)
(2)
where wi is the Standard Population of the age class i where i = 1, n age classes. In a statistical sense, the ASR represents an estimate of some true parameter value (which could only be known if the units of observation were infinitely large). Therefore, it is usual to give some measure of uncertainty of the estimated rate, such as the standard error (SE) of the rate. The standard error can also be used to calculate confidence intervals (CI) for the rate, which are intuitively rather easier to interpret. Both of these measures are computed in the atlas.
2.4. Statistical and Spatial Analyses in the CASA
One of the most useful aspects of the CASA is the range of functionality beyond simple mapping and statistical analysis available in similar atlases. With the CASA, users are able to collate data over time, choose from a range of available map styles (e.g. choropleth, graduated symbol, pie charts and density maps) and calculate a range of cancer incidence rates to create exportable figures and maps. This section provides an overview of the functionality contained in the two main interfaces in the atlas, i.e. the statistical and spatial analysis windows. A detailed help file and manual are available for users of the atlas.
2.4.1. The Statistical Analysis Interface
The CASA’s statistical interface is divided into the following five sections, as shown in Figure 2: 1) analysis panel; 2) cancer site and time period panel; 3) figure panel; 4) table panel; and 5) legend panel. These five panels are linked to each other and work in a dynamic and interactive way, i.e. any action taking place in any one panel affects the results in the other panels.
The analysis panel is used to select the type of cancer analysis, which is then displayed in the figure and table panels on the right hand side. The user first selects the spatial level for analysis from a drop-down list where the options are National, Regional, Governorate or Cities. At the national level, a user can analyze and explore cancer distributions over the whole of Saudi Arabia, while at the regional level, the exploration and analysis of cancer distributions, variations, trends and patterns are conducted over the thirteen administrative regions. As for the governorate level, a user can view and analyze cancer distributions over the 118 governorates. At the city spatial level, the analysis is undertaken on cancer data over the 240 cities and towns.
Radio buttons then allow the user to select all cancers for analysis or just the most common cancers, followed by an option to choose standard or advanced analyses. This is followed by a list of types of different analyses that the user can select. When a user selects all cancers, the results will be displayed for approximately sixty types of cancer according to the International Classification of Diseases [32]. A query of the most common cancers will provide results for the top ten cancers, updated dynamically upon selection of the gender and period. Selection of the standard analysis will provide the user with thirty-two pre-defined types of analysis, which will appear as a list in the analysis panel (Supplementary Table 1). Figure 3 illustrates the results from four different analysis types.
The advanced analysis option allows users to create customized queries by adjusting different parameters, as listed in Supplementary Table 2. The statistics are then computed based on this user-defined query, which provides much more flexibility in undertaking specific analyses. An example of a user-defined query might be to display the incidence of liver cancer in males aged between
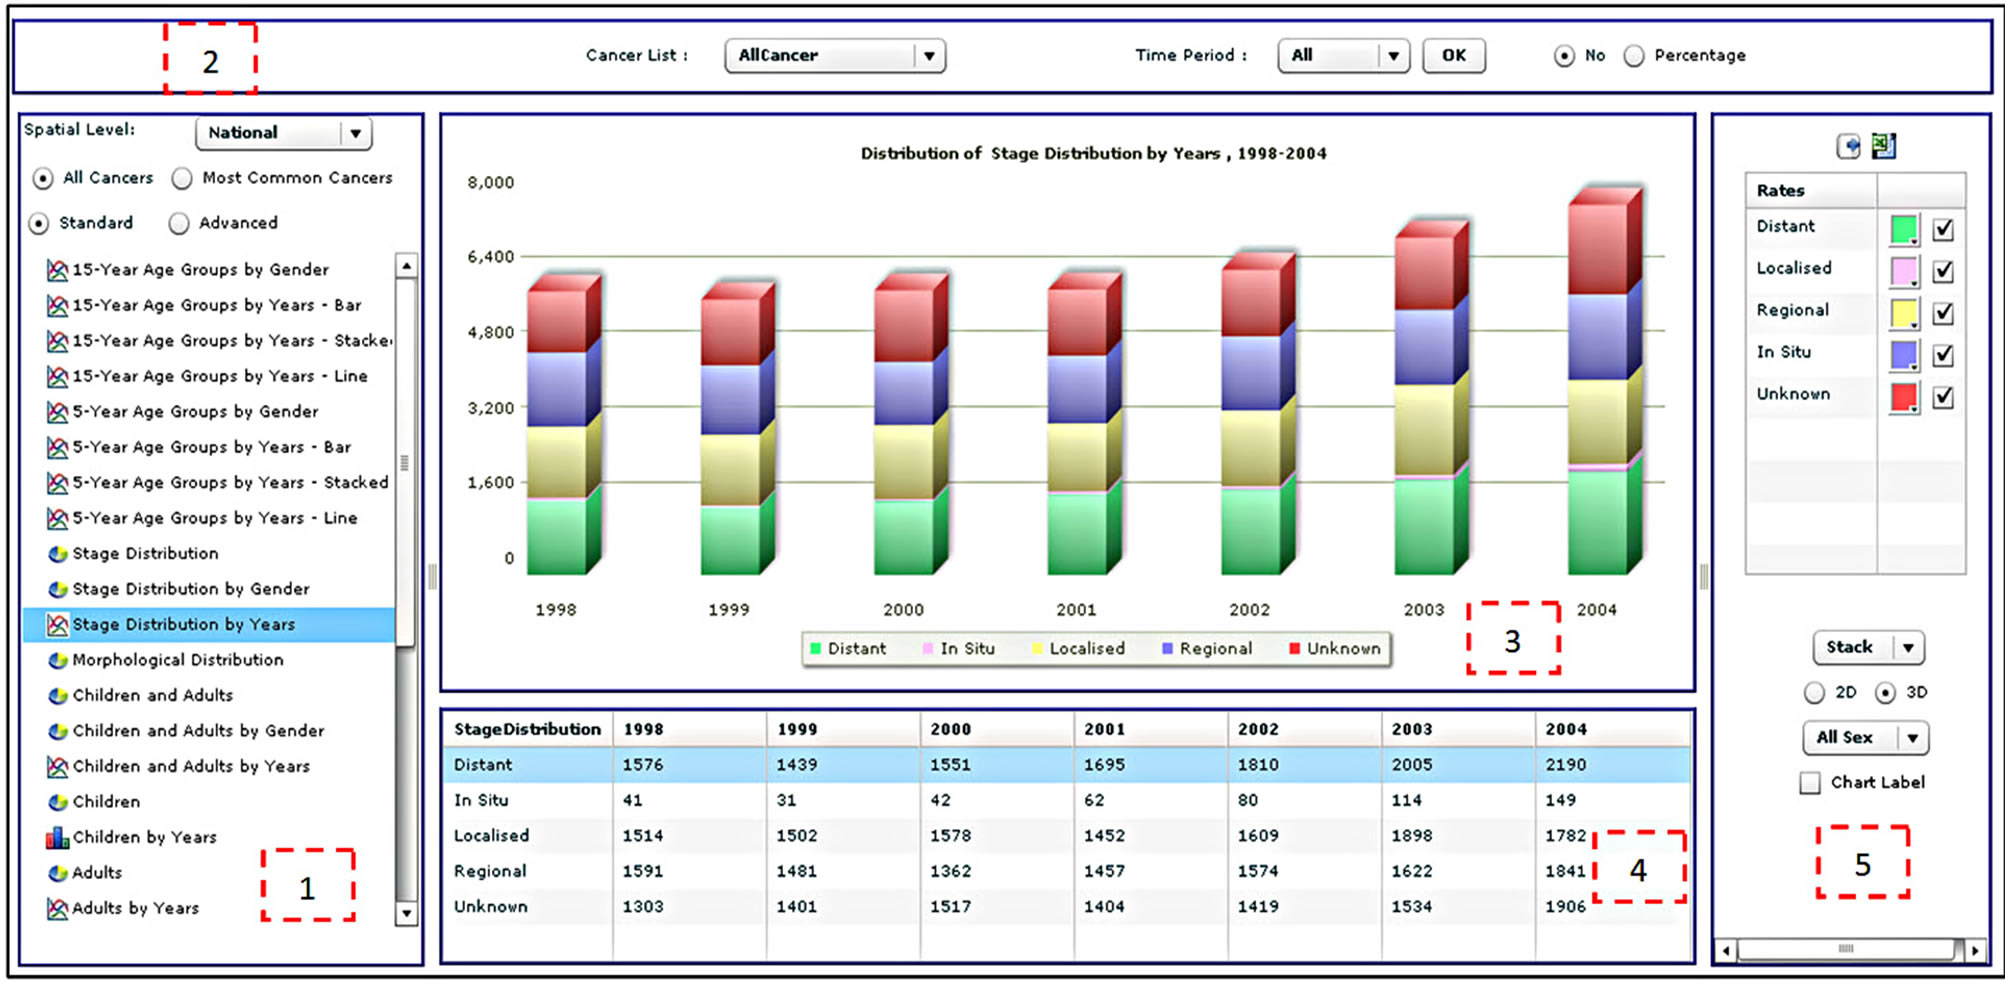
Figure 2. The statistical analysis interface of the CASA.
fifteen and twenty-nine between 1999 and 2003 with distant and regional stage distribution for all morphological distributions. By default, the CASA chooses all cancer types for analysis. The cancer site and period panel (labeled as item 2 in Figure 2) allows the user to select a specific cancer type. The user can also select all the years for analysis (1998-2004), an individual year or a subset of years. The absolute number of percentage option specifies how the data are displayed in tables and figures but does not apply to rates such as CIR, AIR and ASR. Finally, the export functions enable users to export a table as text or in Microsoft Excel format, and figures in image format such as jpeg, png or pdf.
The figure panel (item 3 in Figure 2) presents the result of an analysis in the form of a figure. This includes the figure itself, a dynamic figure title and a dynamic figure legend. The table panel (item 4 in Figure 2), which appears below the figure panel, presents the results of an analysis in tabular format. The legend panel (item 5 in Figure 2) provides the user with some interactive functions for controlling colors, figure types (bar chart, pie chart, stacked bar chart or lines), 2D or 3D and labels. A user can select the type of figure to be used to present the data.
2.4.2. The Spatial Analysis Interface
The spatial analysis tools are available in a similar interface to that of the statistical analysis (Figure 4). The main difference is that the results are displayed as maps, although the user can display figures and tables through the legend panel. The statistical analysis interface is divided into four sections: 1) analysis panel; 2) cancer site and time period panel; 3) map panel; and 4) legend panel. The function of the analysis panel is similar to the one found in the statistical analysis interface, i.e. to allow users to select across the spatial level of analysis, cancer types, standard or advanced analysis and a list of predefined analyses. The results of the analysis are displayed as a map.
The cancer site and period panel (item 2 in Figure 4) is the same in both the statistical and spatial analysis windows. The map panel (item 3 in Figure 4) presents the result of the analysis selected by the user. Different maps can be generated, such as choropleth maps, density maps, graduated symbol maps, pie chart maps and bar chart maps. Examples of different map types are shown in Figure 5. The function of the legend panel is to provide the user with some interactive capabilities to adjust map parameters such as color scheme, classification method (equal interval, quantile, natural break or standard deviation), number of classes, size of symbols and transparency level. To help researchers become familiar with these different mapping types, a manual was written which describes them in more detail. Moreover, training sessions have been held with staff to explain the different mapping types available. These sessions have also allowed us to test the atlas and gather feedback.
3. Analyzing Colorectal Cancer (CRC) Using the Cancer Atlas
It has been reported that presently very few reports deliver a descriptive epidemiology of colorectal cancer (CRC) in Saudi Arabia [33-35]. Hence, this section provides the results of an analysis of CRC in Saudi Arabia, to illus-
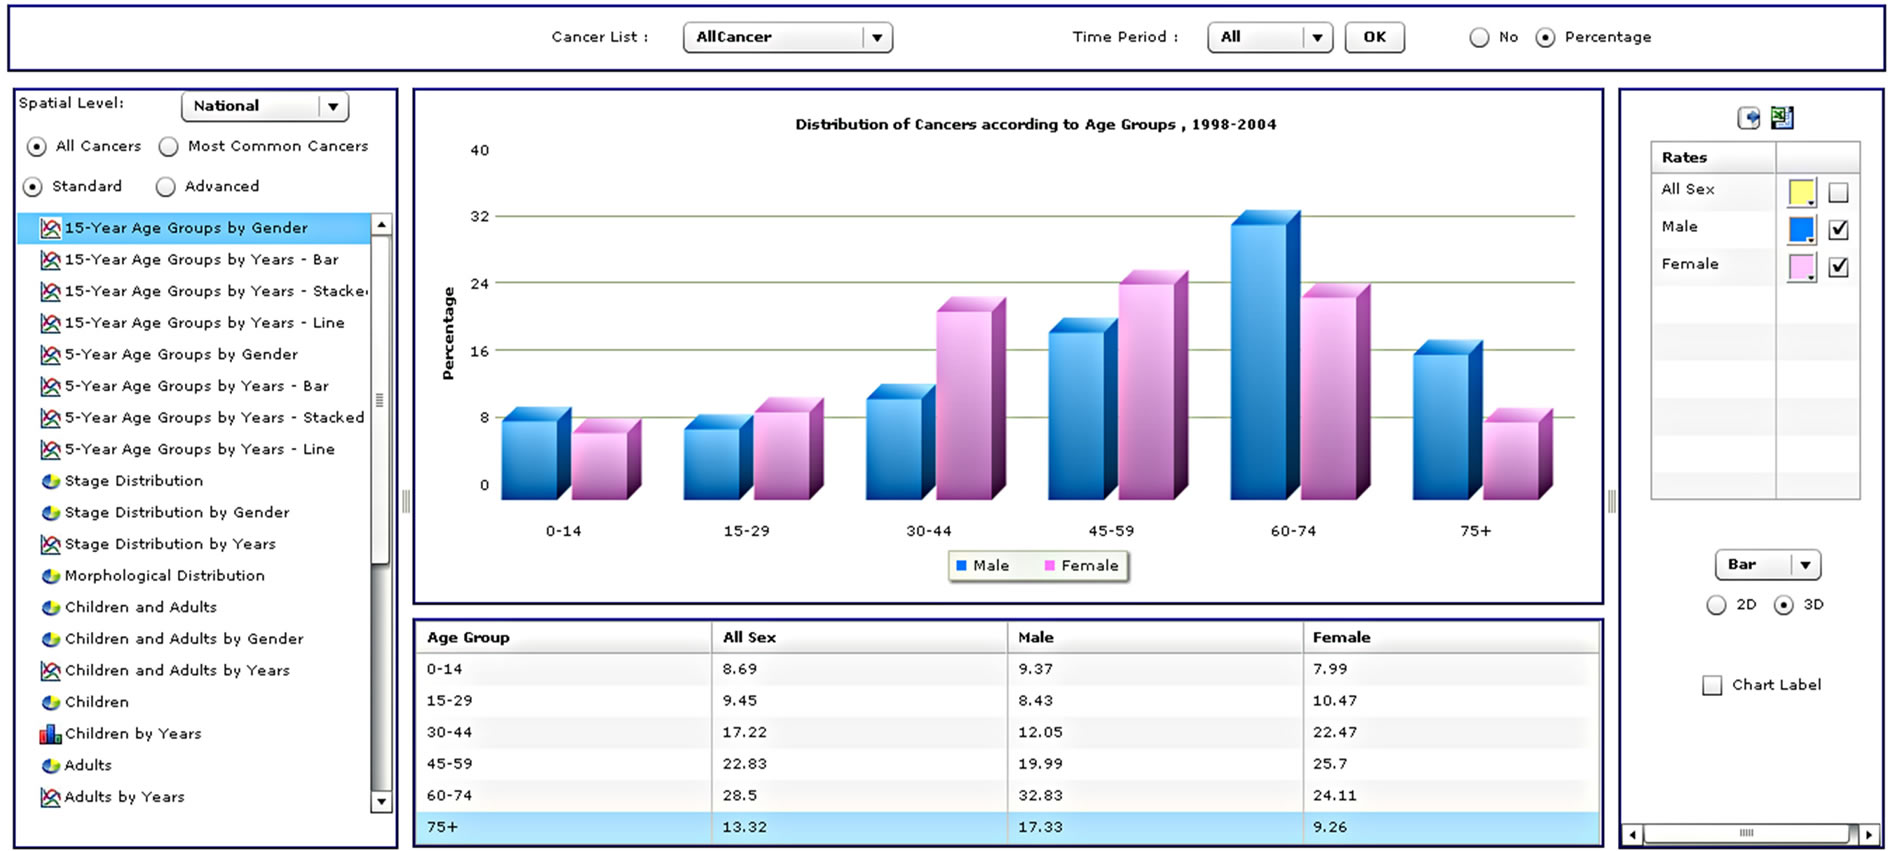
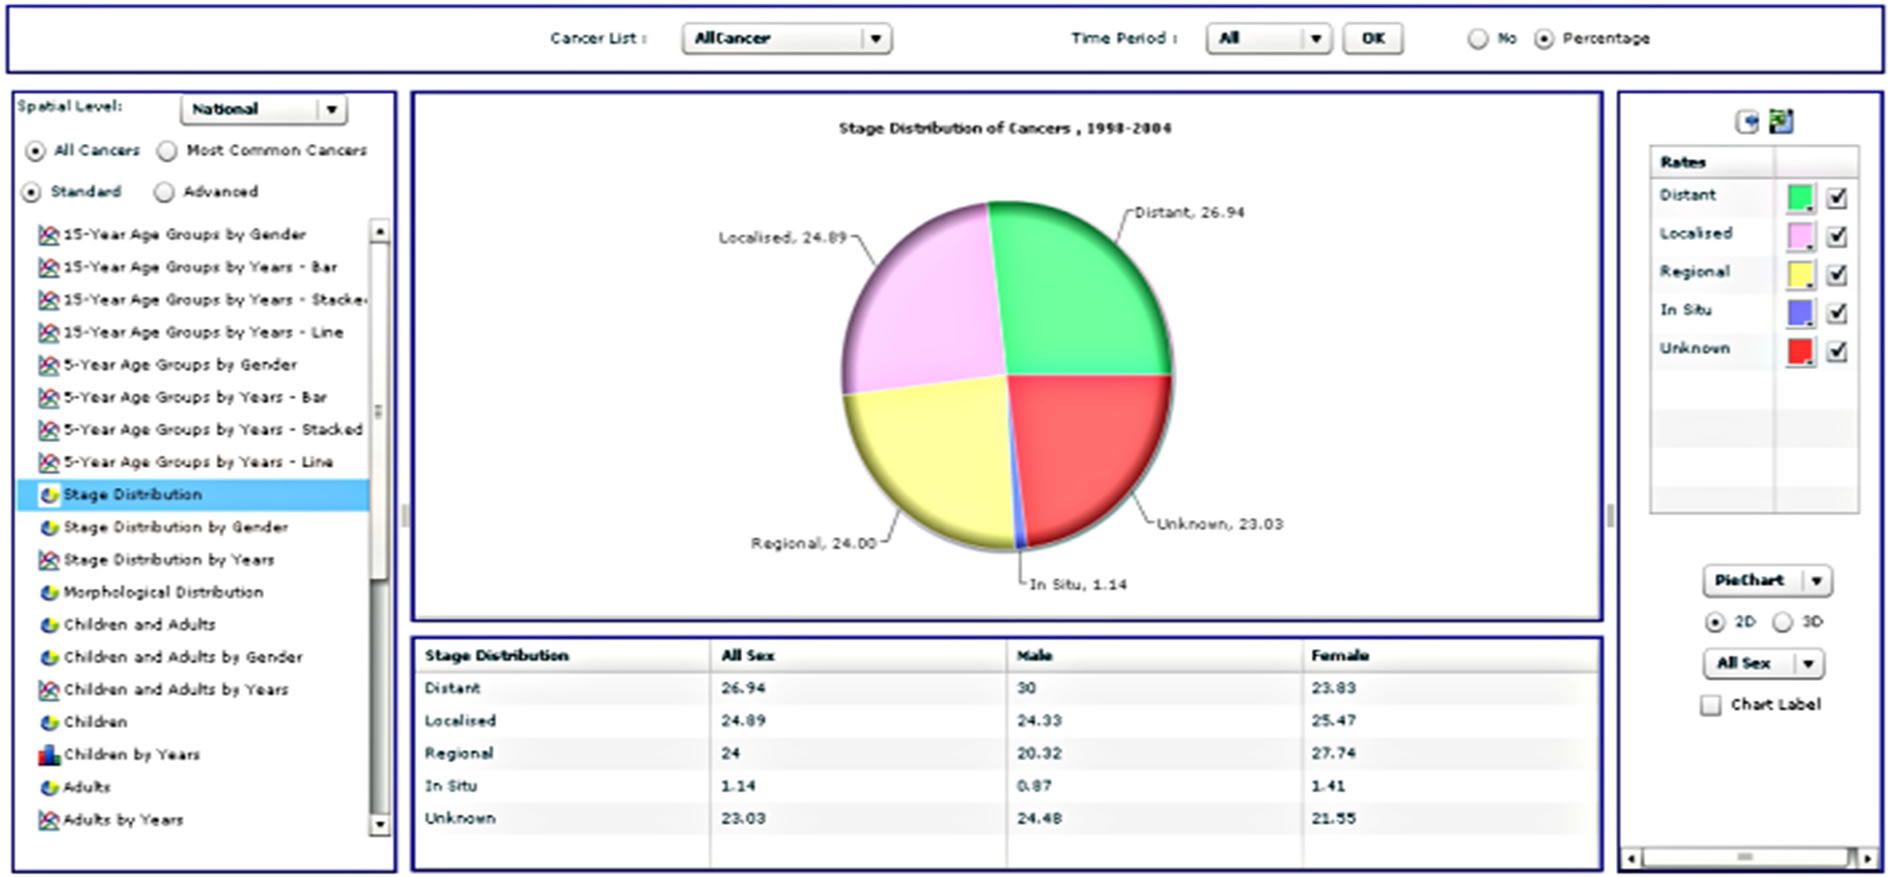
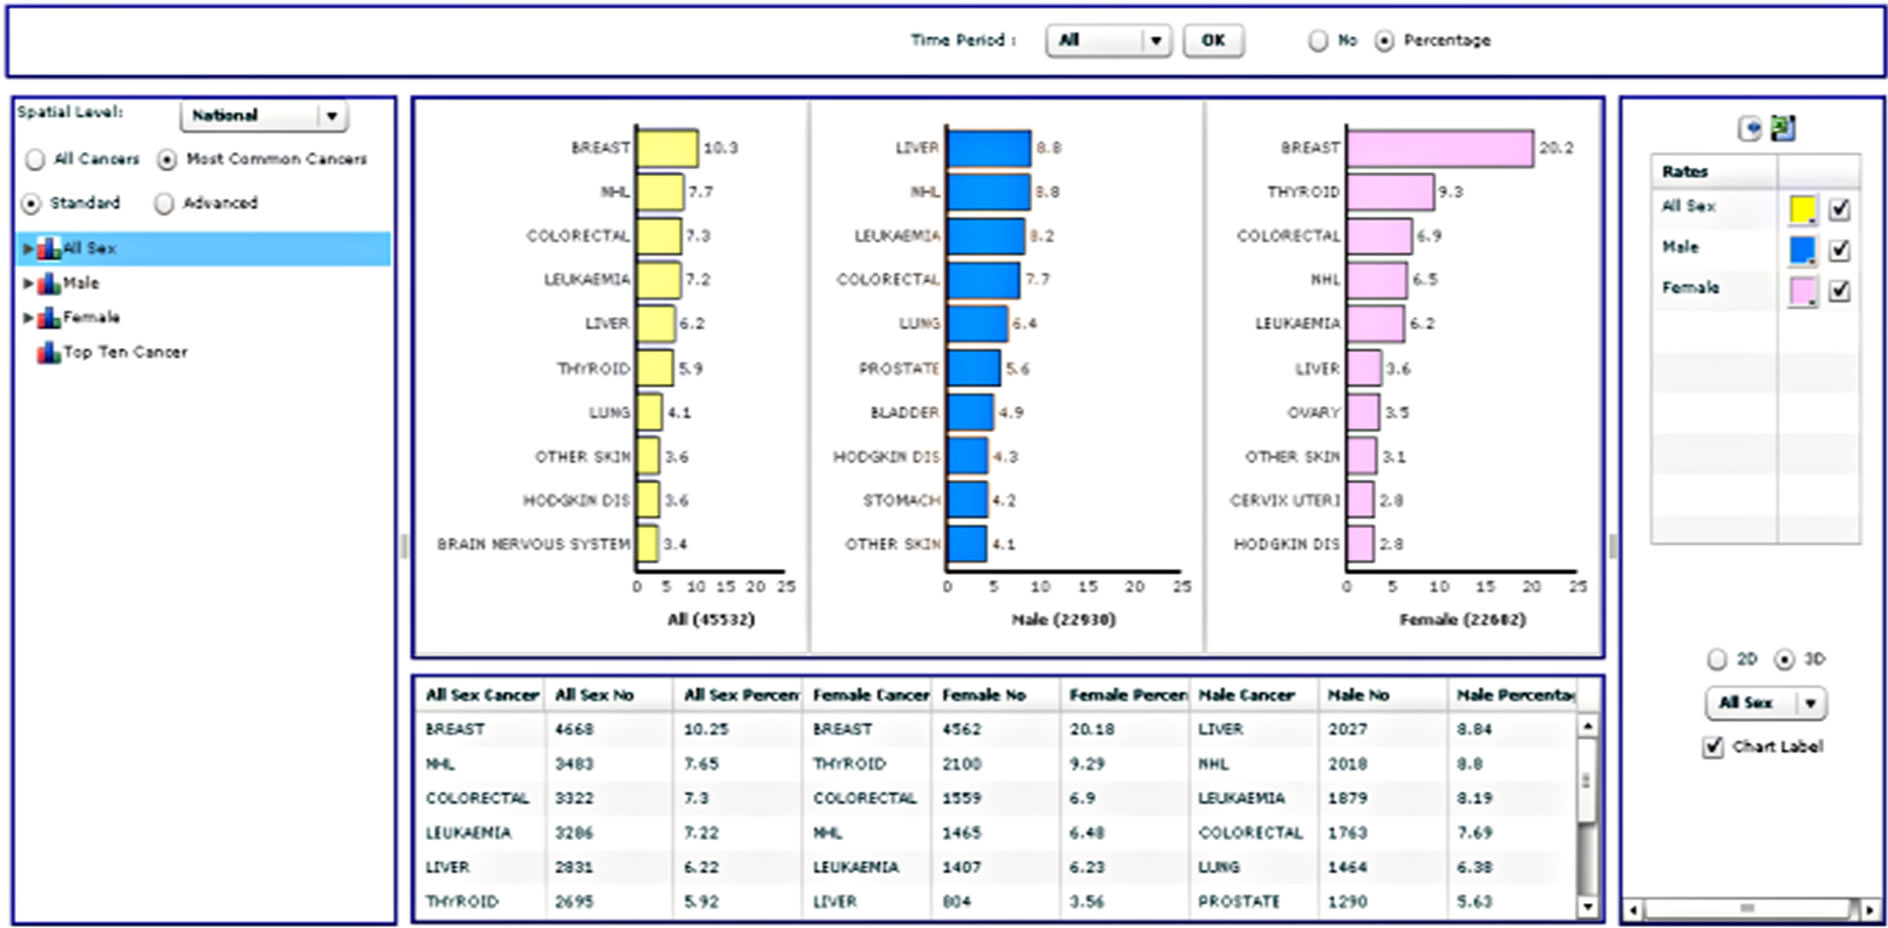
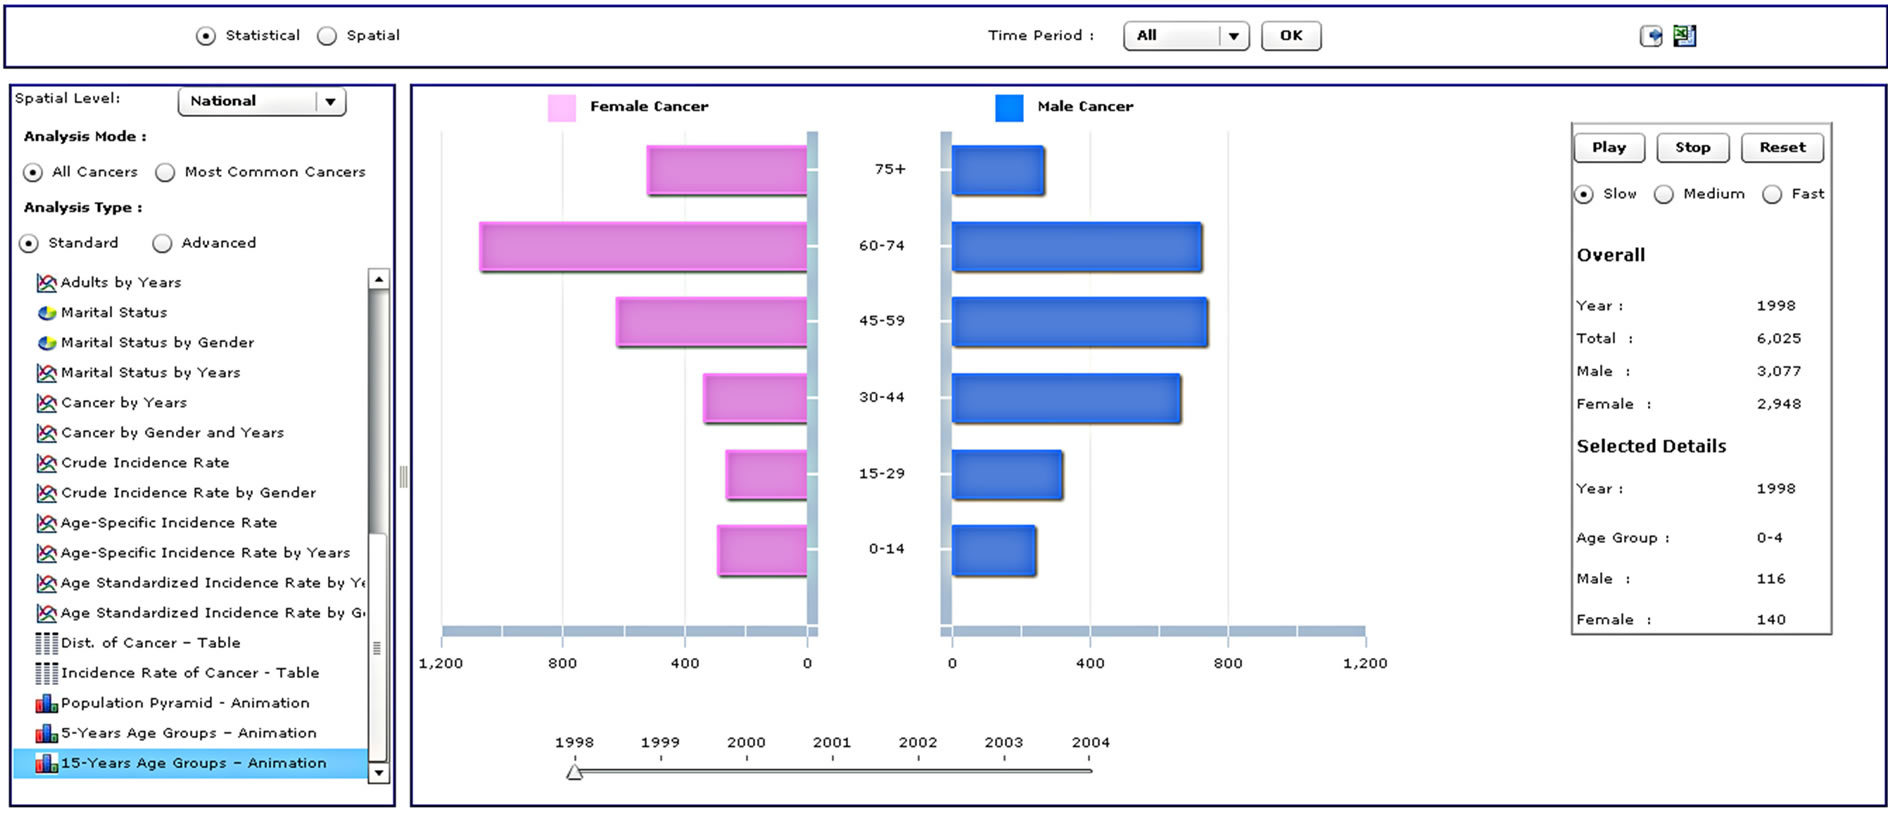
Figure 3. Four different analysis types from the standard analysis list.
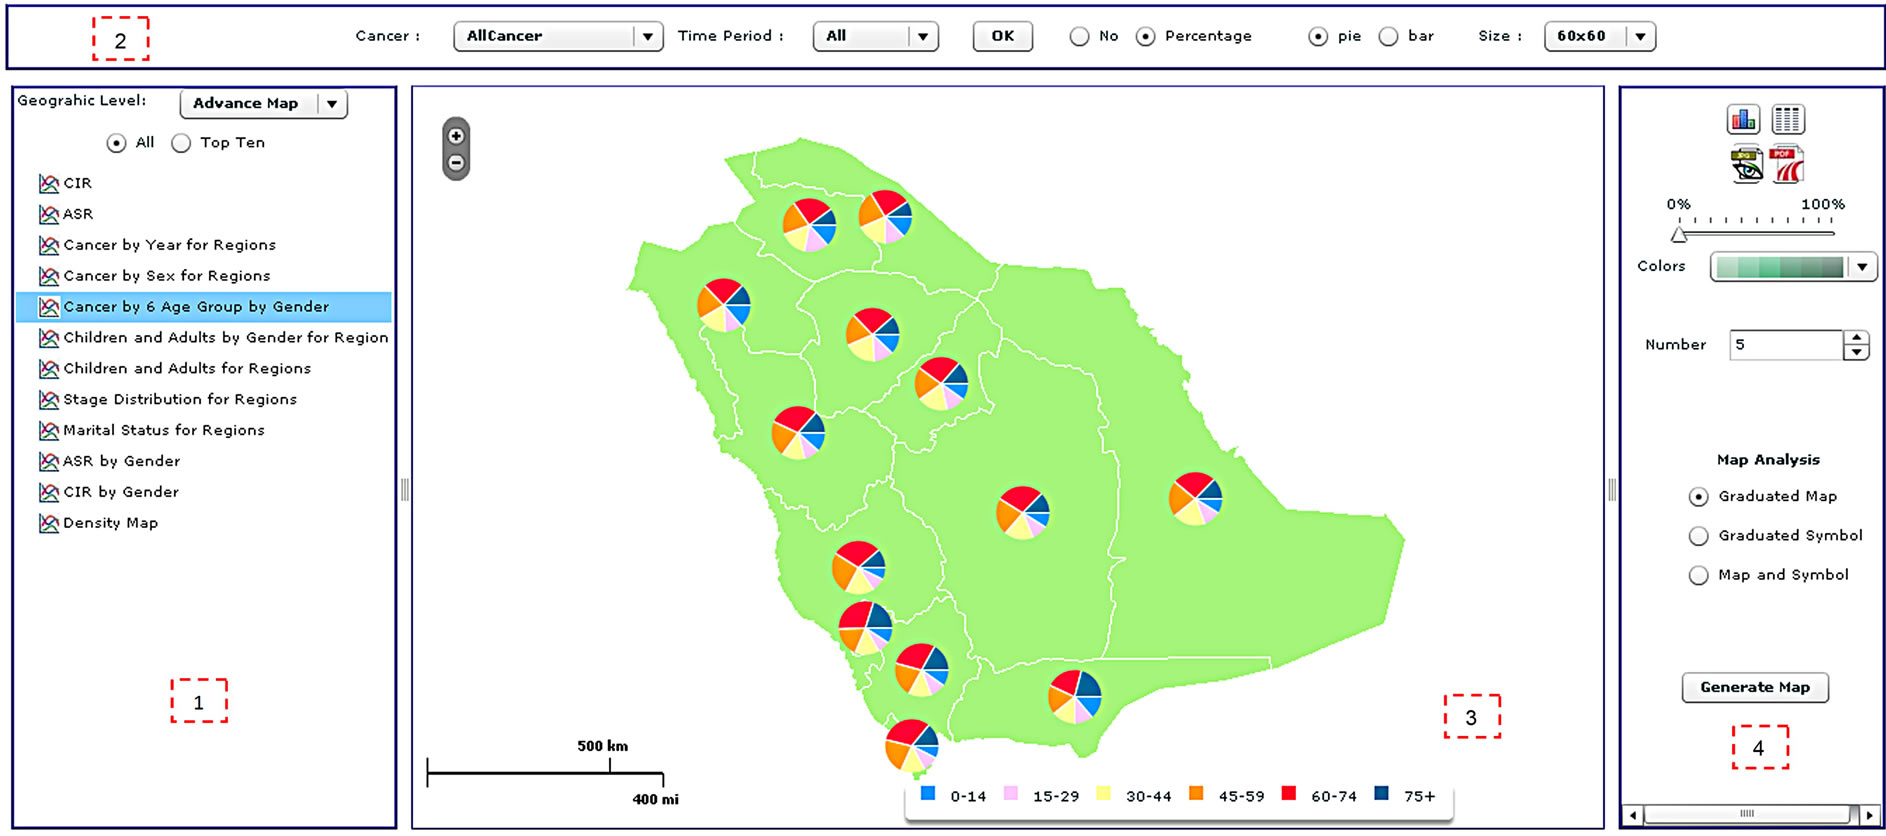
Figure 4. The spatial analysis interface of the CASA, including (1) the analysis panel; (2) the cancer site and time period panel; (3) the map panel; and (4) the legend panel.
trate the statistical and spatial functionality of the CASA at varying geographical scales.
Colon cancer is cancer of the large intestine (colon), the lower part of the digestive system. Rectal cancer is cancer of the last six inches of the colon. Together, they are often referred to as colorectal cancers (CRC). Most cases of colon cancer begin as small, noncancerous (benign) clumps of cells called adenomatous polyps. Over time, some of these polyps become colon cancers. Polyps may be small and produce few, if any, symptoms. Regular screening tests can help to prevent colon cancer by identifying polyps before they become cancerous [36].
3.1. Statistical Analysis
Between 1998 and 2004, a total of 3322 cases of CRC were diagnosed in Saudi Arabia. This accounts for 7.3% of the total number of cancer cases, 7.69% of all male cancers and 6.90% of all female cancers. CRC was ranked as the fourth and third most common cancer in males and females respectively. The overall ASR was 4.28 per 100,000 people between 1998 and 2004, with a higher ASR for males of 4.44 compared to 4.03 for females. Higher ASR in males is consistent with the majority of other countries. The reasons why colorectal cancer is greater among males than females are not clear [35], although factors such as diet, body size, physical activity, hormones and family history of CRC could be accountable for the higher incidence amongst males than females [37]. In Saudi Arabia, progressively increasing exposure to risk factors and the lack of a nationwide screening program, along with an aging and growing population,
 (a)
(a)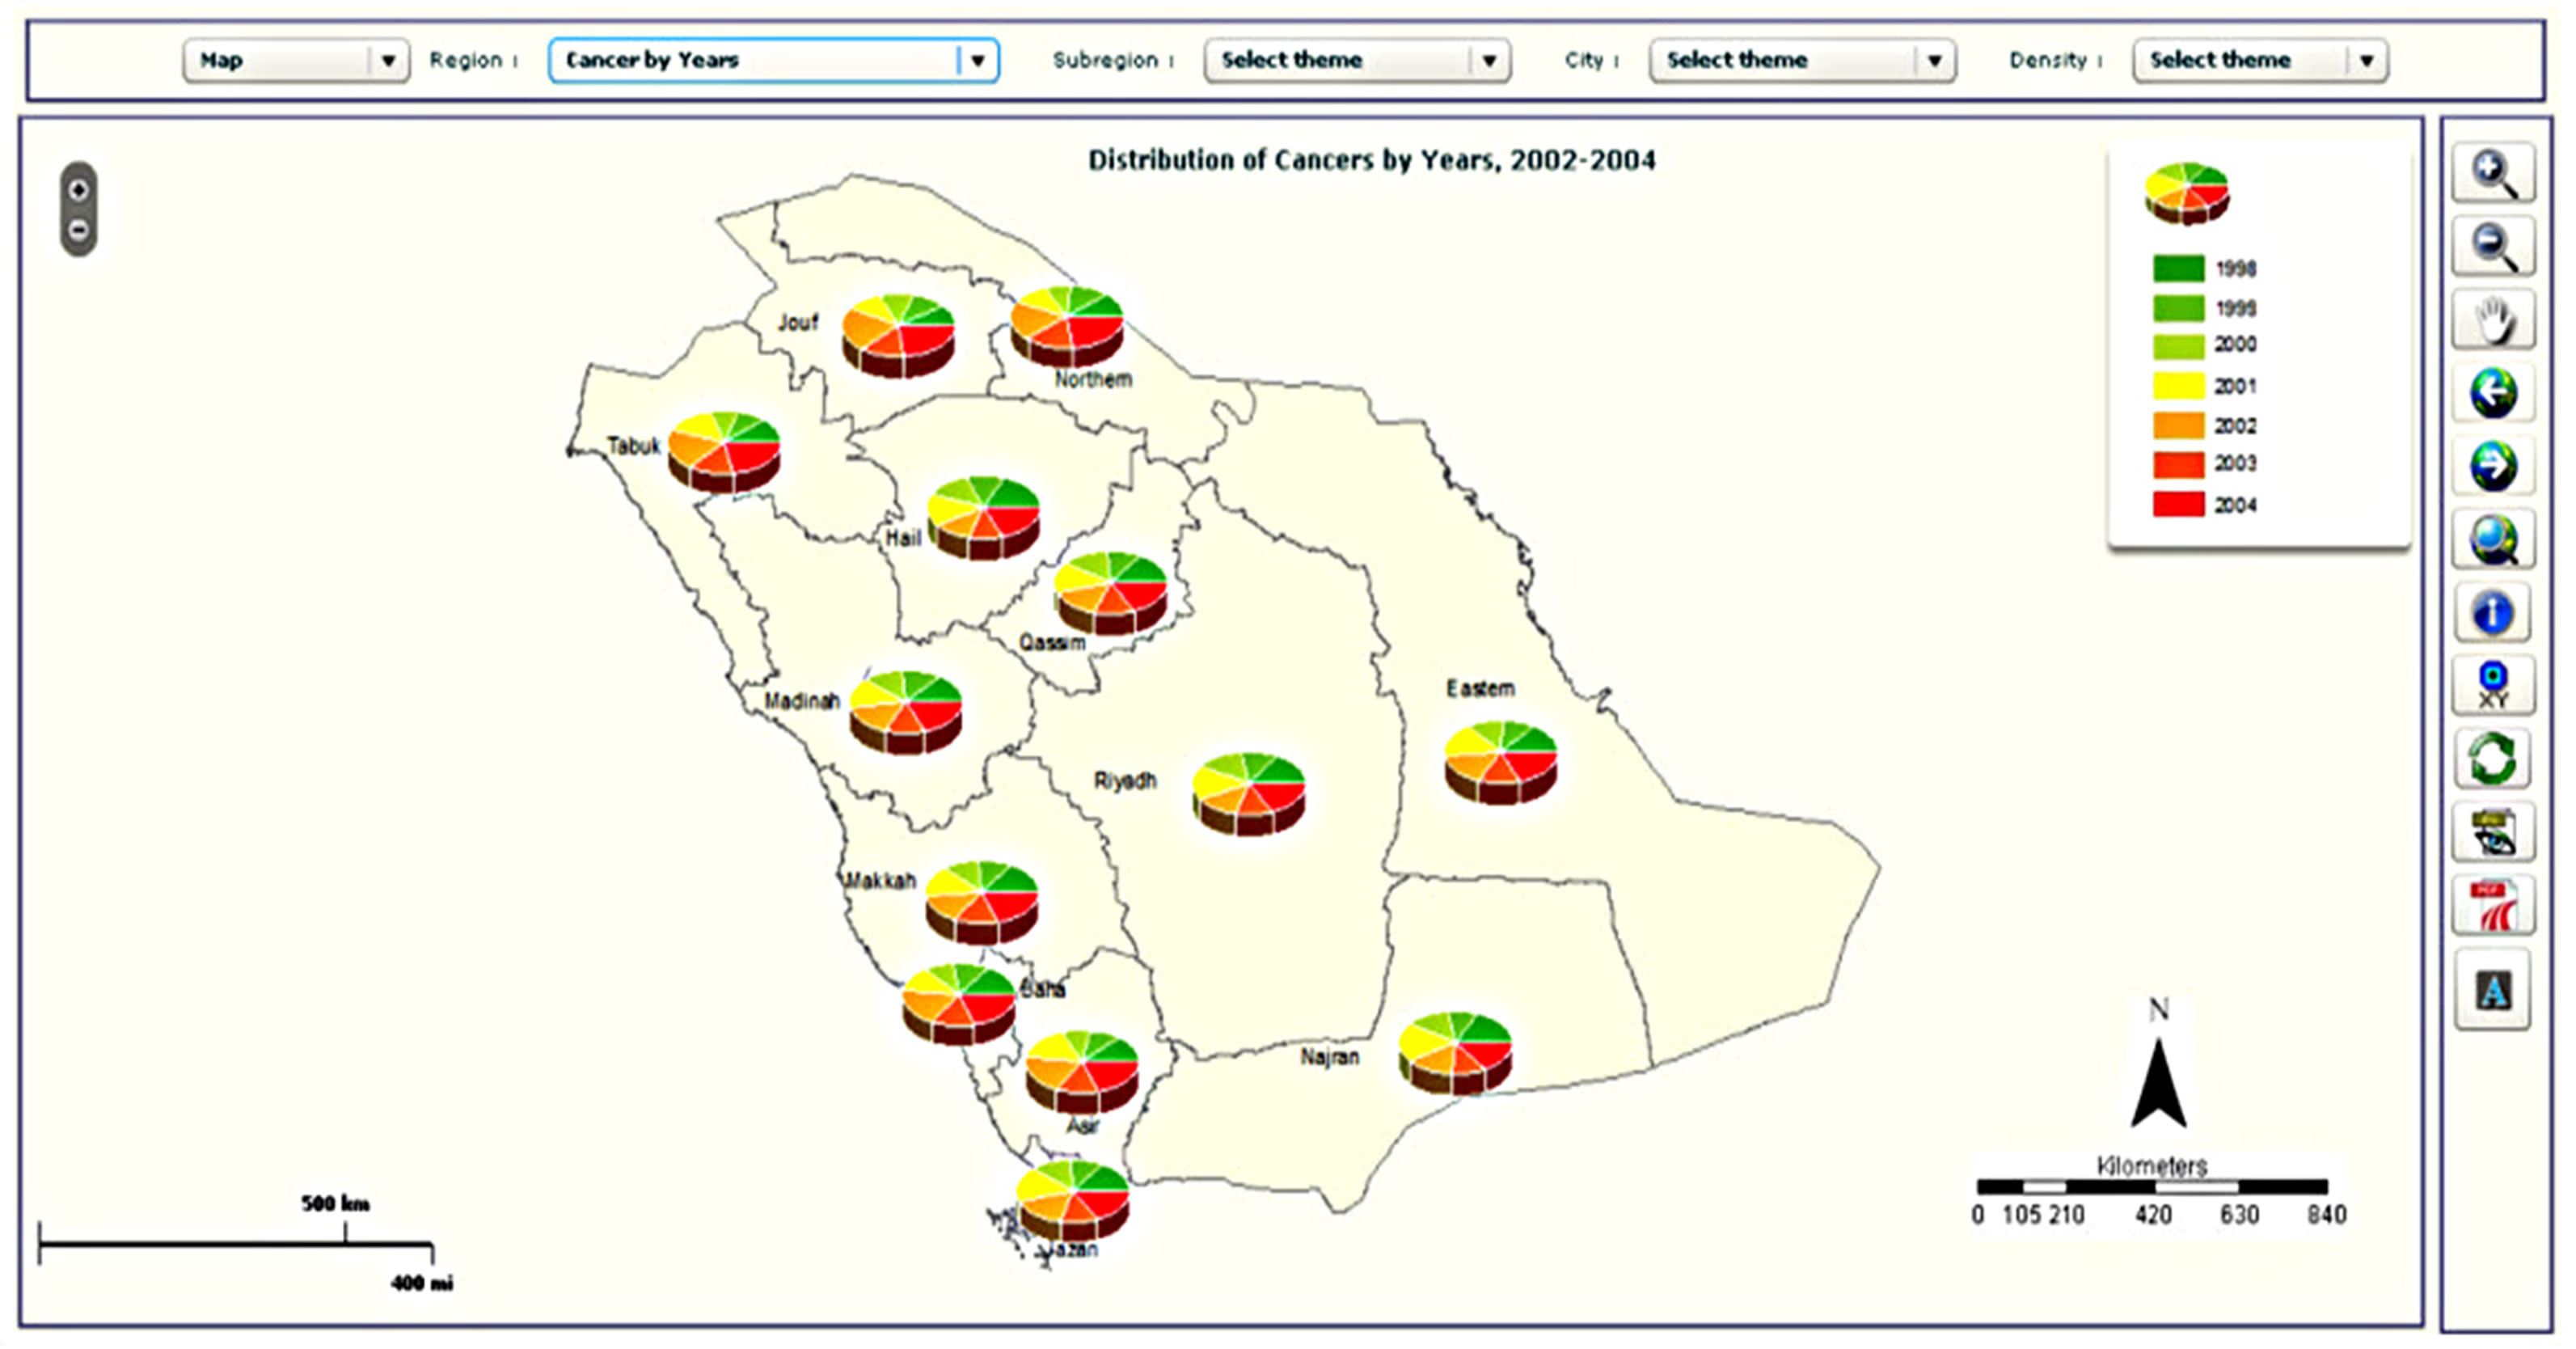 (b)
(b)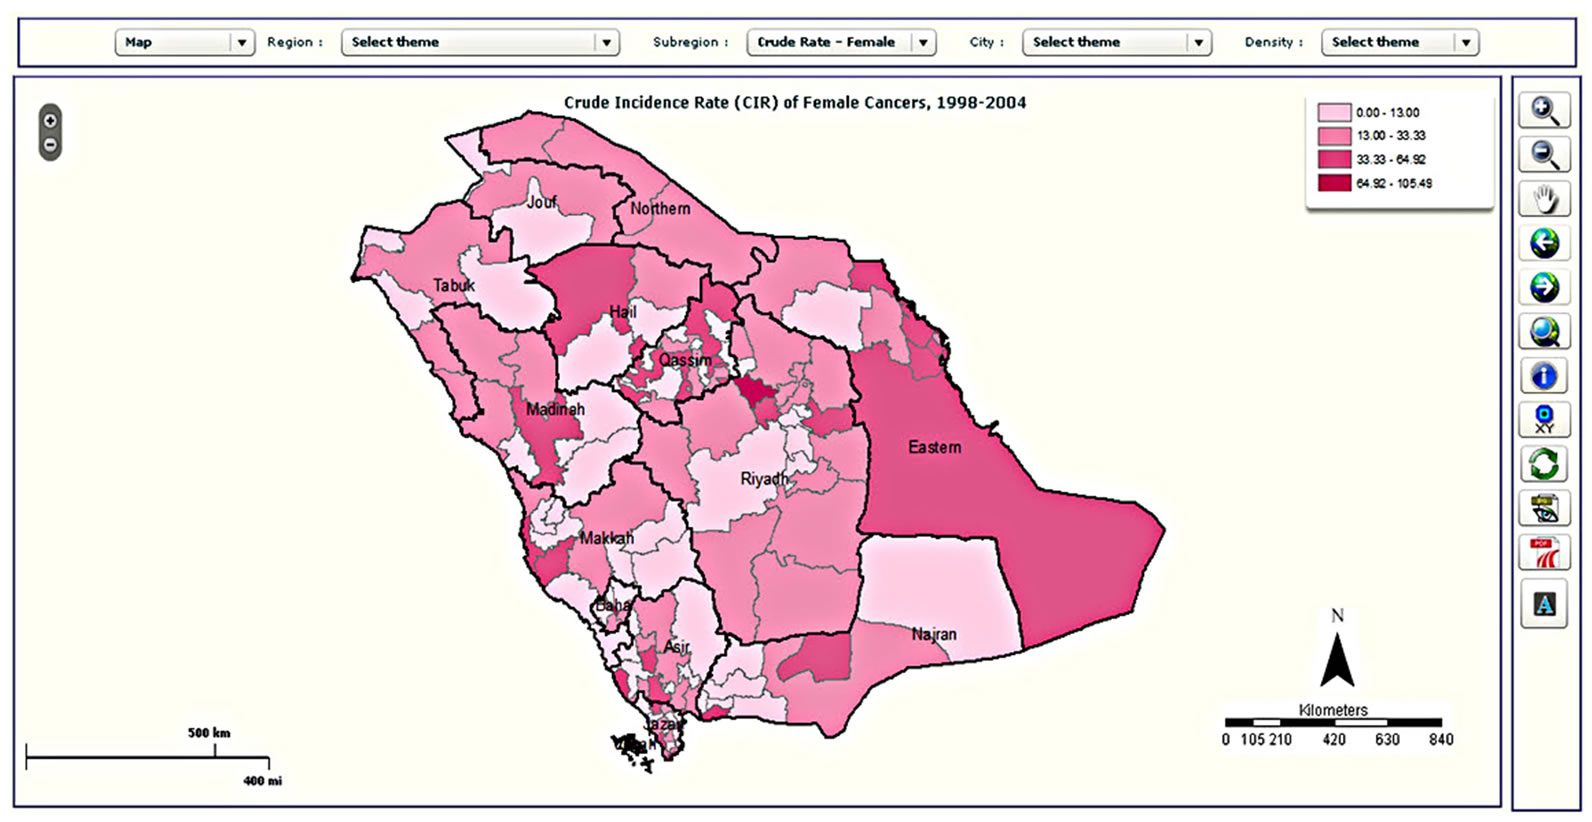 (c)
(c)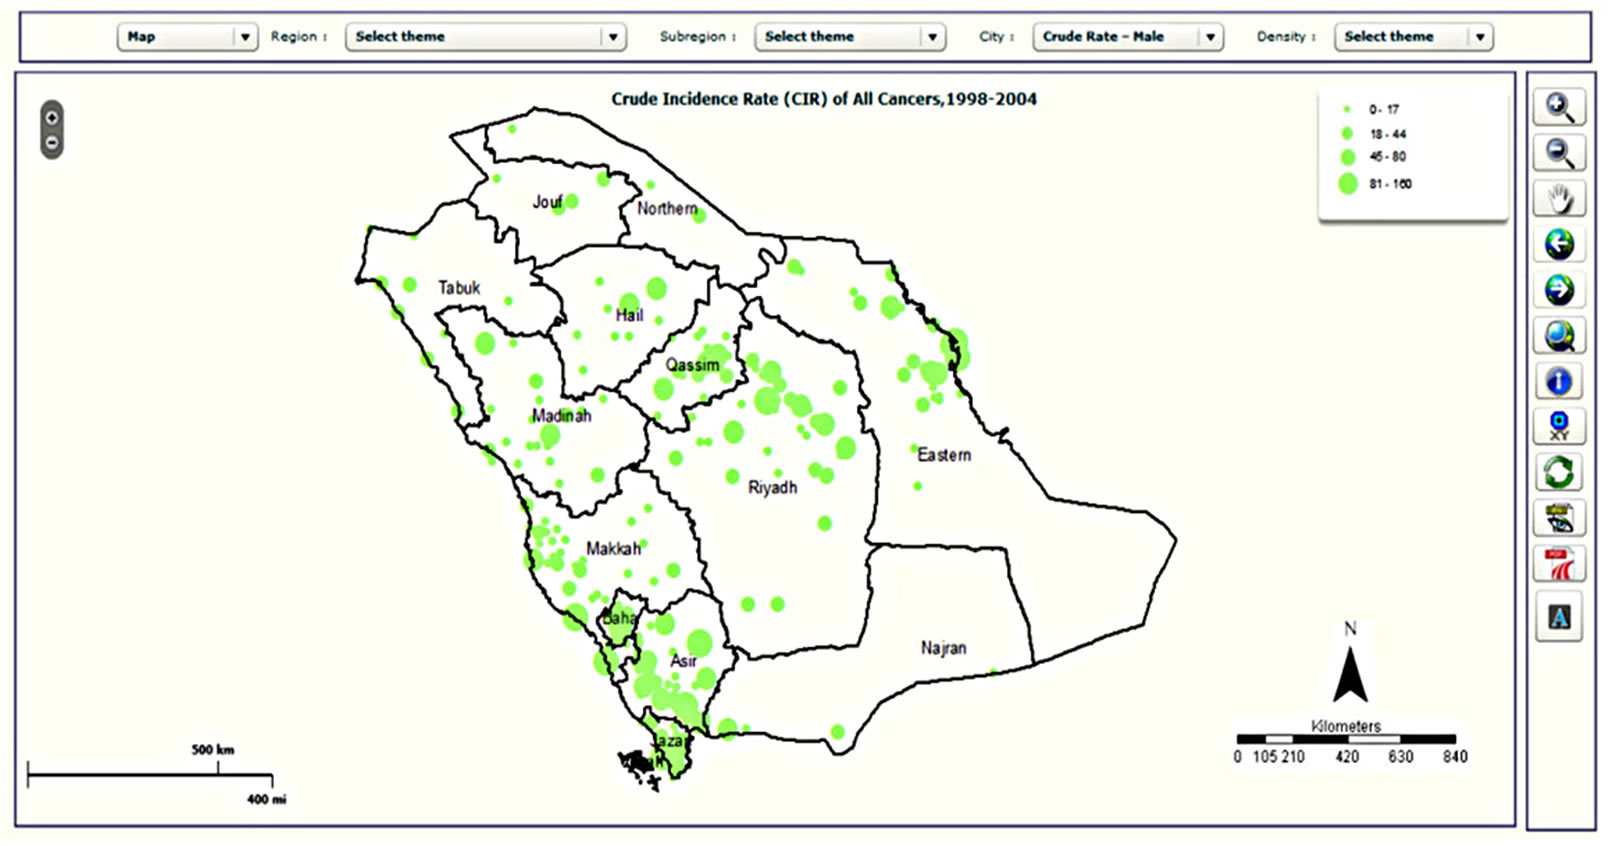 (d)
(d)
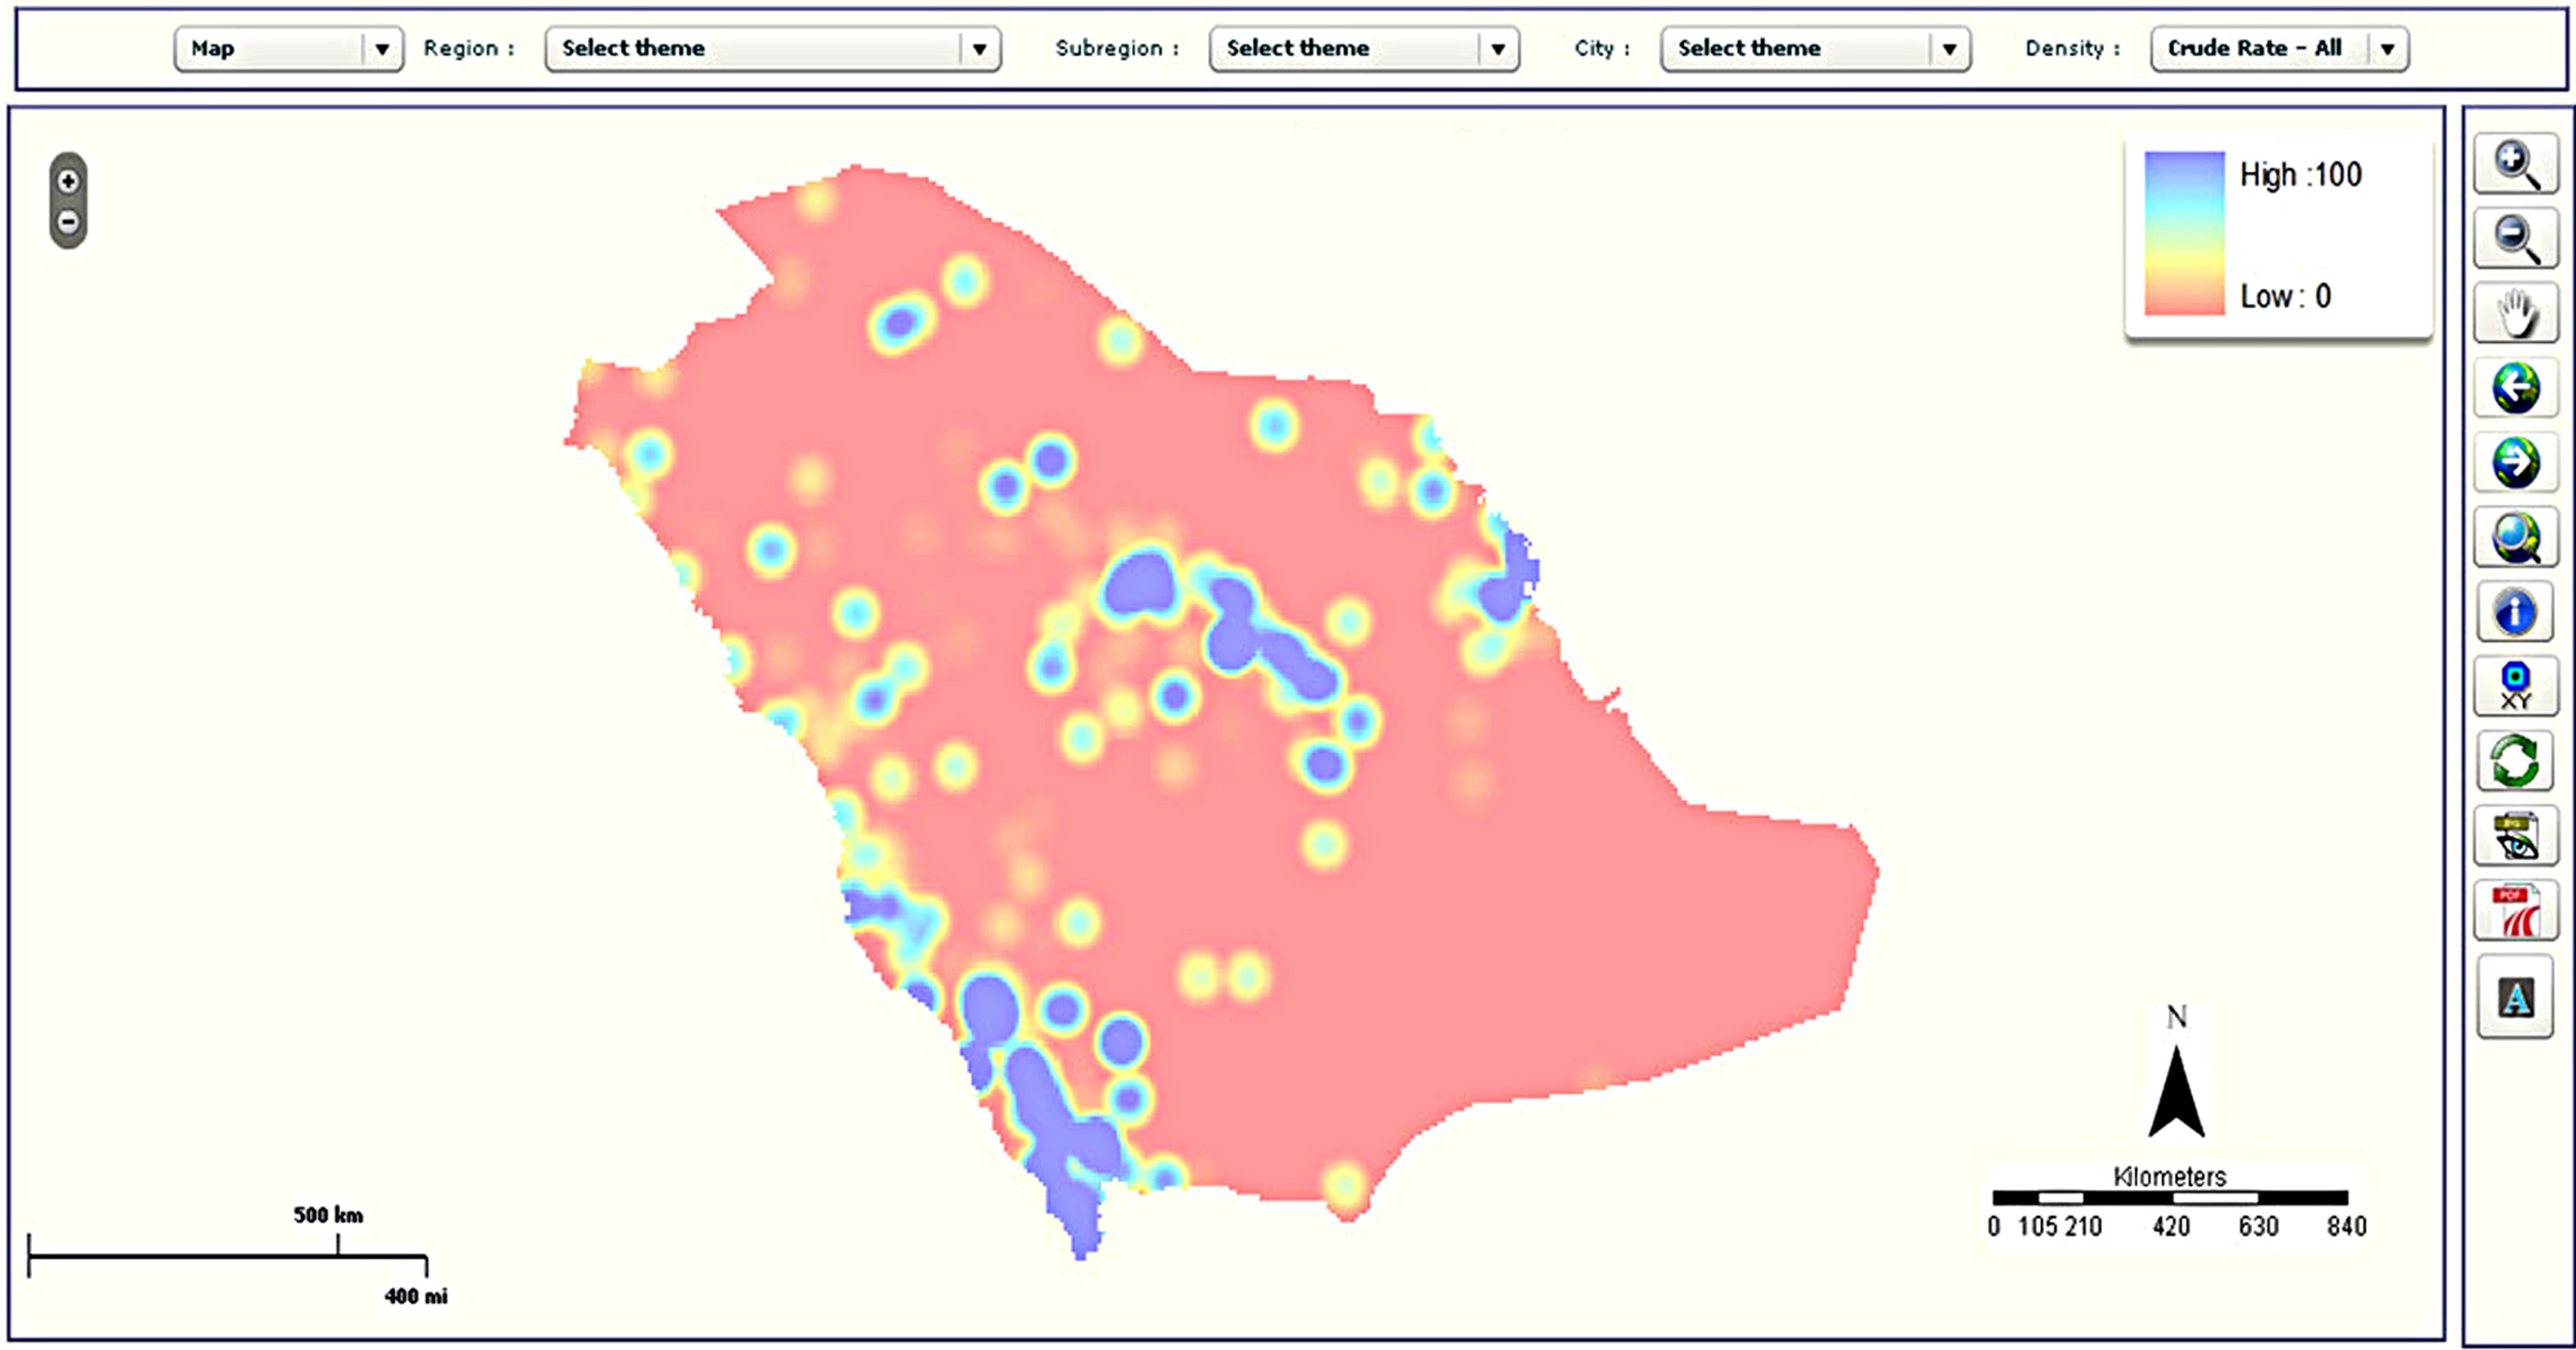
Figure 5. Examples of mapping types in the CASA: (a) choropleth map; (b) map with pie charts; (c) density map; and (d) graduated symbol map.
probably explain the rising CRC rates. These findings, in addition to the possible hidden familial risk for colon cancer, highlight the need for a mass screening program for CRC in Saudi Arabia, preferably for individuals aged forty years and above. Ibrahim et al. [34] predicted a significant increase of colorectal cancer incidence in both sexes by almost four-fold by 2030 in Saudi Arabia due to possible westernization of our dietary habits and lack of proper screening.
A number of useful graphs can be generated very easily from the atlas. For example, Figure 6 shows that the number of new cases diagnosed between 1998 and 2004 by gender, which shows a steady increase in both males and females over this time period. CRC can also be viewed by fifteen-year age groups for all years (Figure 7) or single years (Figure 8). The graphs in Figures 7 and 8 clearly show a higher percentage of incidences between the ages of 60 and 74.
It is also possible to break patterns down further by gender is also possible. Other statistics, such as the crude incidence rate, can be plotted by gender for each year (Figure 9), revealing a steady increase between 1998 and 2004.
3.2. Spatial Analysis
The statistical interface is invaluable at giving a snapshot of the rates of cancer over time and within different agegender classifications; however, it does not provide information about the spatial distribution of these incidences. The benefit of multiple types of maps for the outputs is that data can be represented most appropriately for each situation. For instance, a choropleth map may be
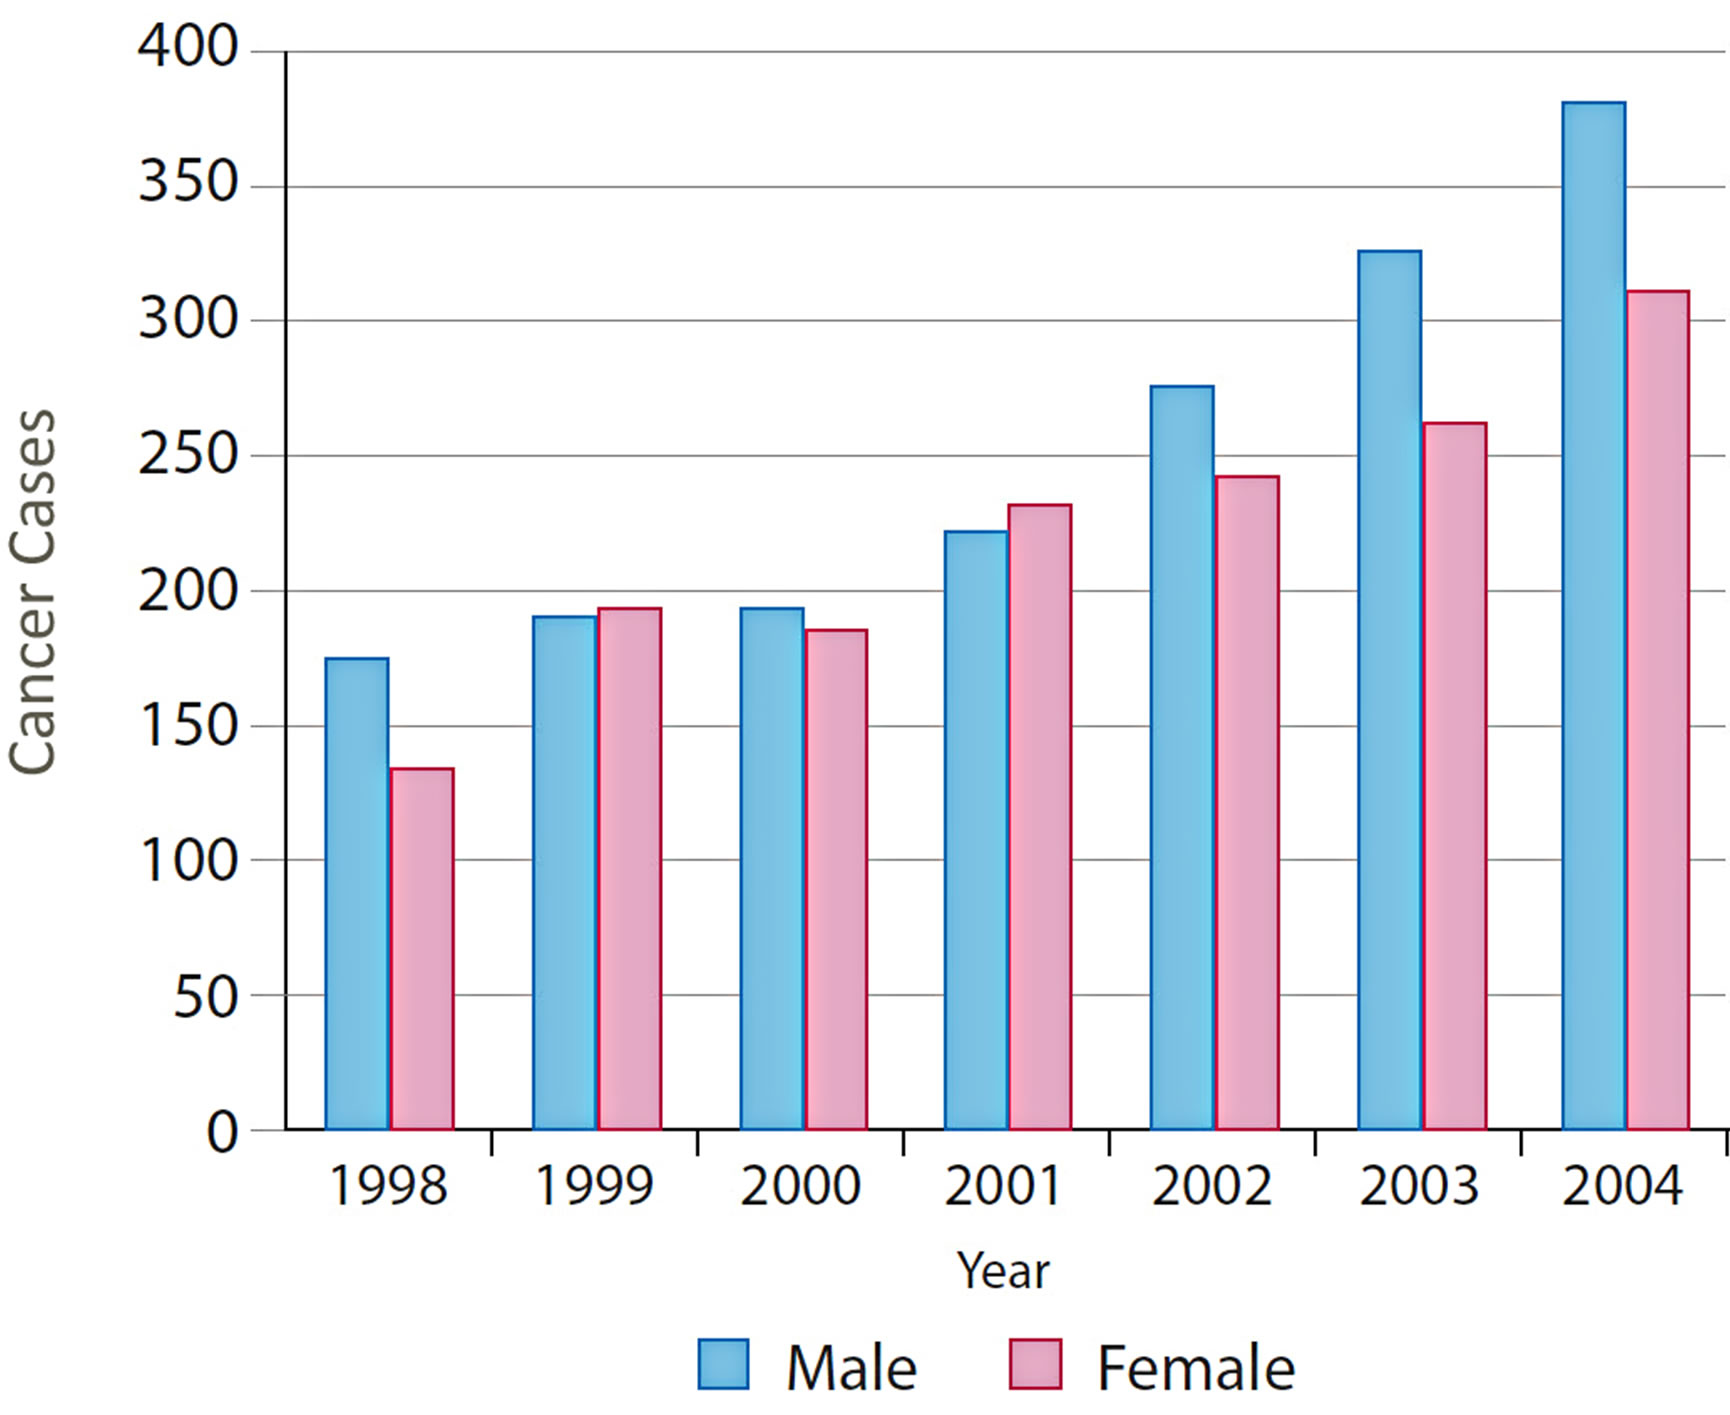
Figure 6. Distribution of CRC by gender and years.
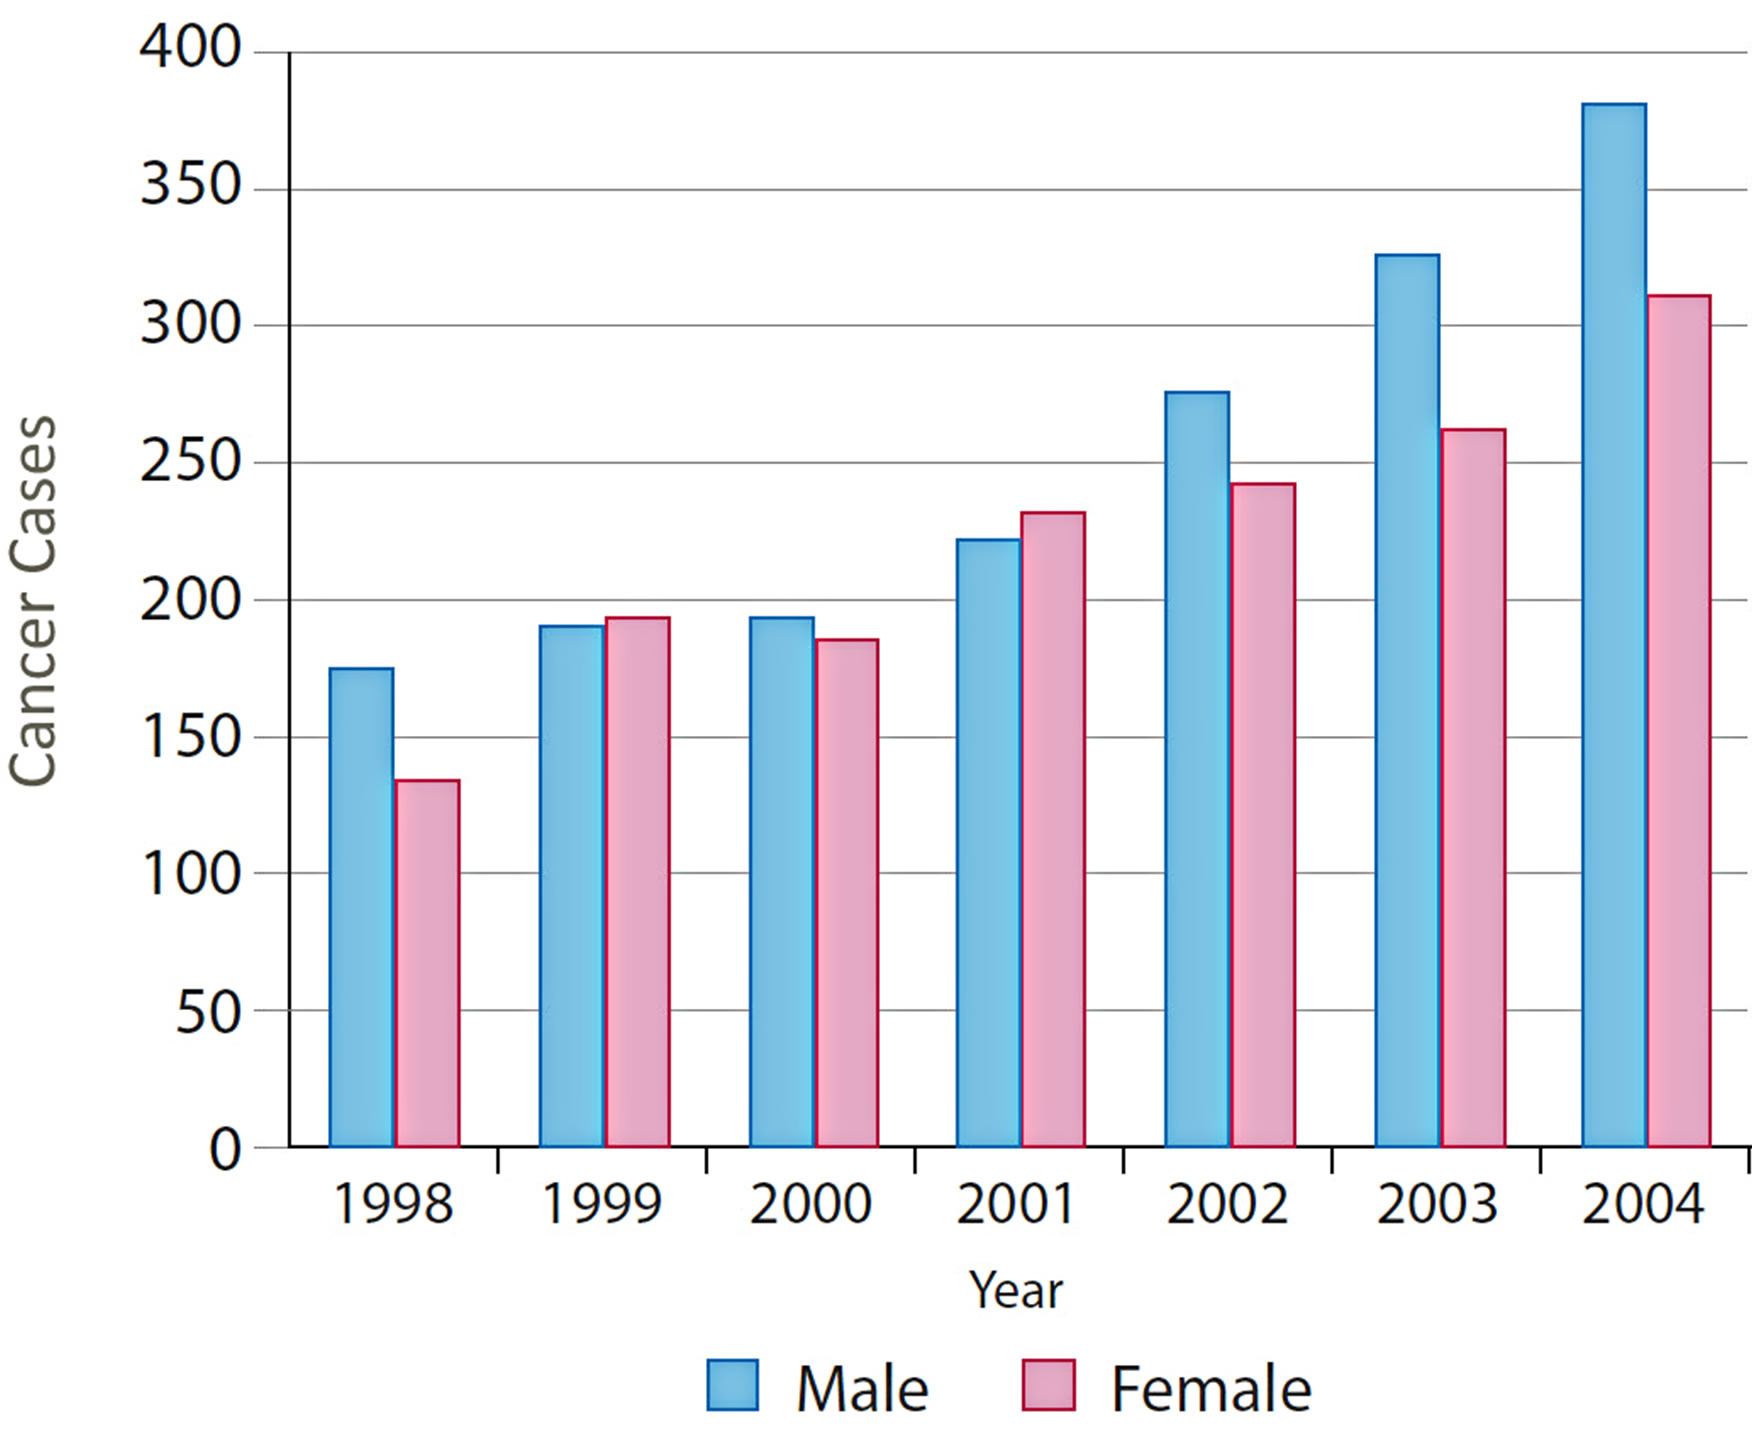
Figure 7. Overall distribution of CRC by gender and 15- year age groups for 1998.
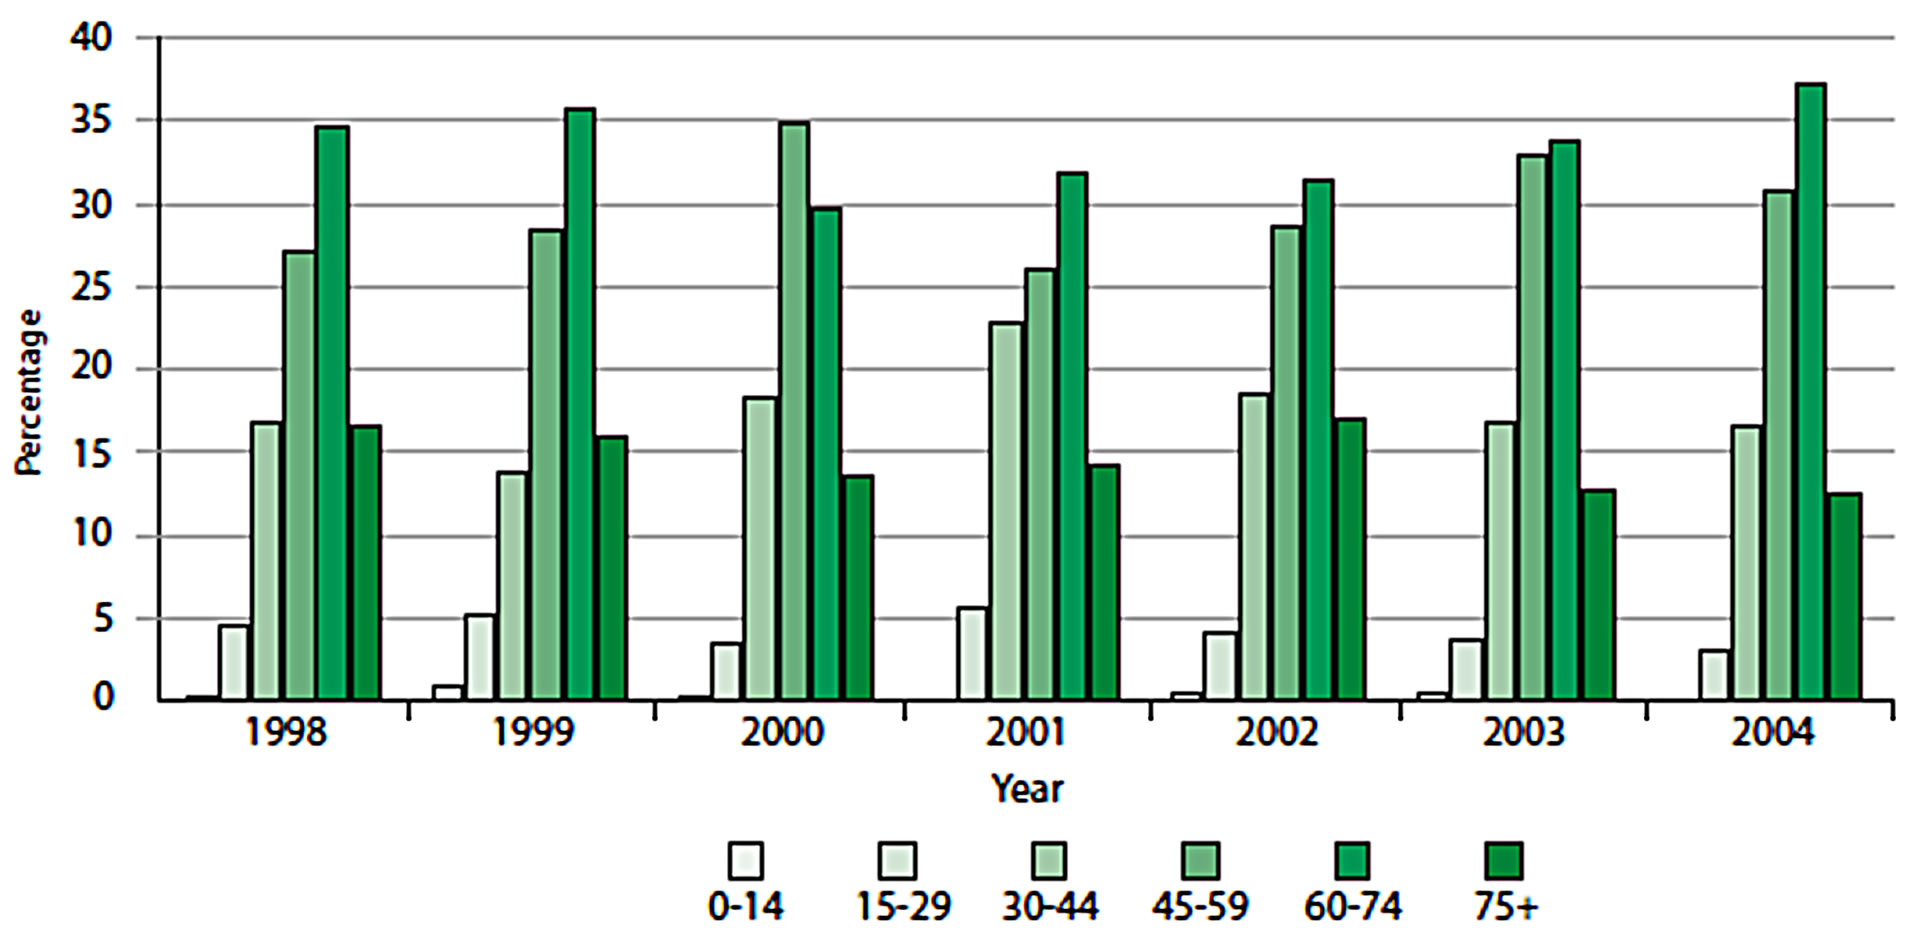
Figure 8. Distribution of CRC by 15-year age groups across all years.
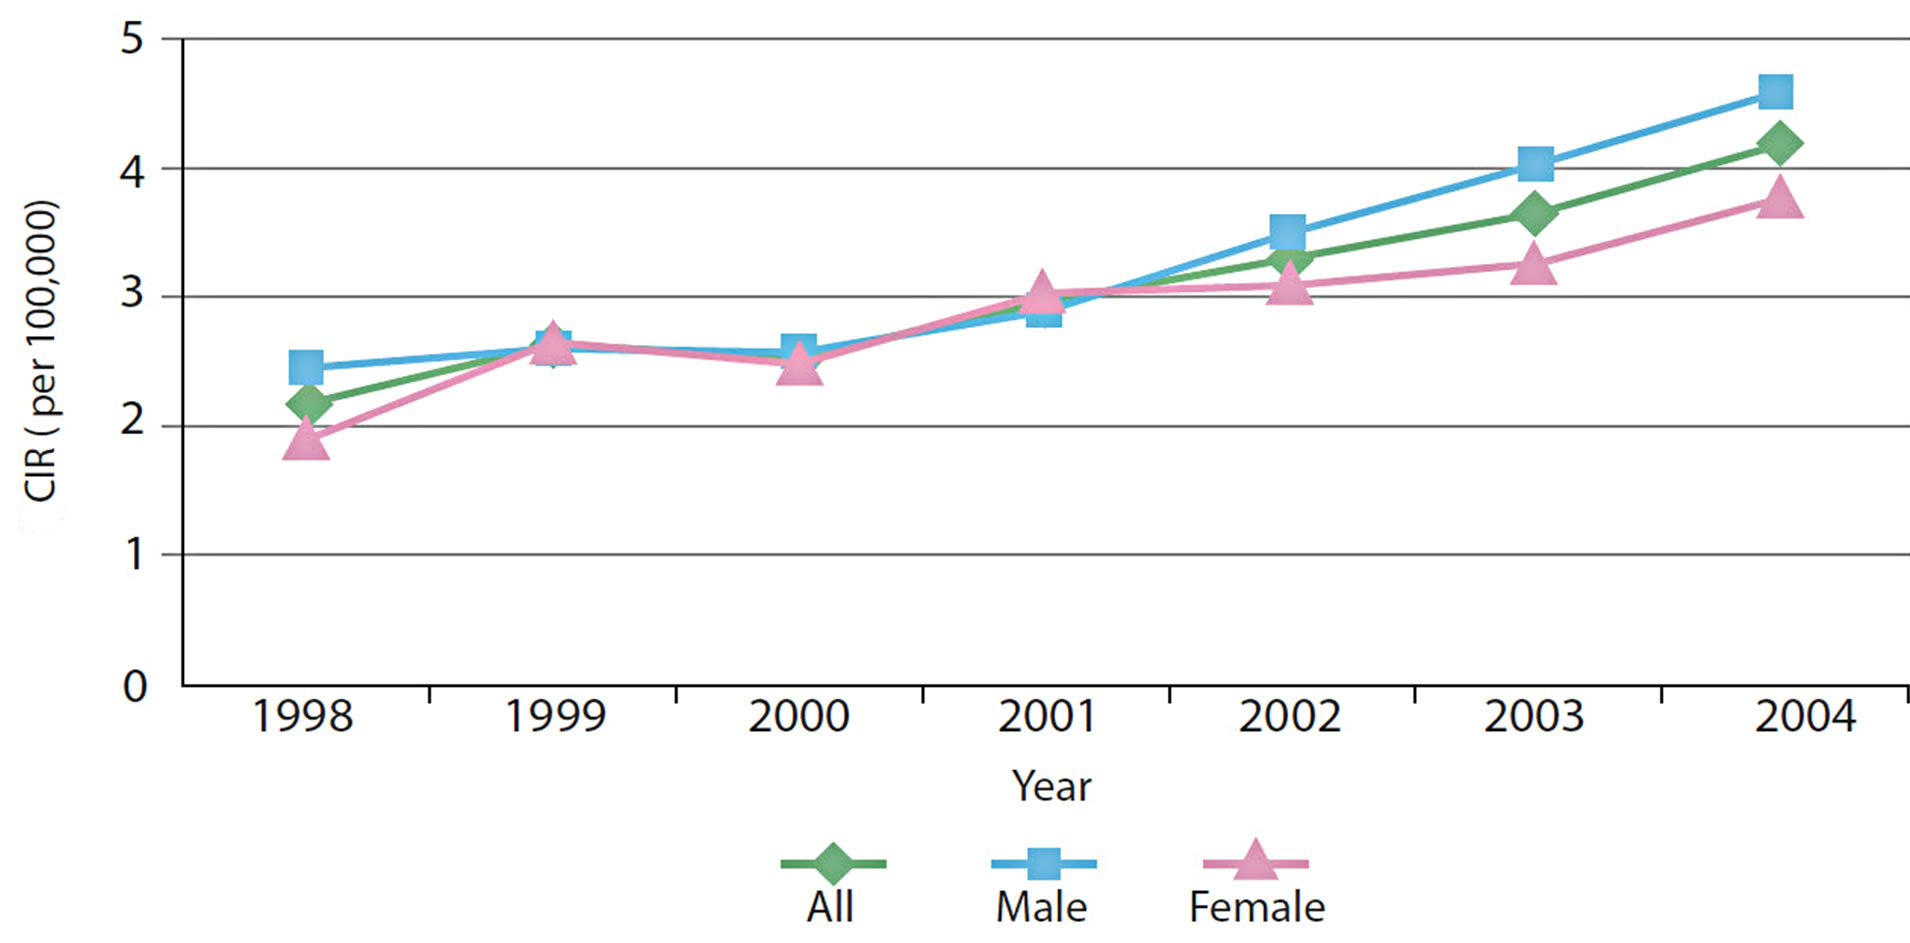
Figure 9. Crude Incidence Rate of CRC over time.
created and downloaded for inclusion in a report for local city officials who need to know general statistics about cancer incidence by local area. A more detailed output, such as a pie chart illustrating the distribution of cancer cases by age in each area, may be suitable for the health practitioners in a region so that they may better target the local population for screening. The graduated symbols are useful for finer spatial scales and provide a valuable alternative where color reproduction of the maps may not be feasible so choropleth maps could hinder clear interpretation of the outputs.
Starting at the regional level, the CASA allows one to examine spatial patterns across the thirteen regions of Saudi Arabia using a combination of tables and maps. For 1998 to 2004, the Riyadh region reported the highest number of colorectal cases (990 cases; 29.9%), followed by the Makkah region (822 cases; 24.8%) and the Eastern region (558 cases 16.9%). These three regions showed significant increased trend in the number of colorectal cases diagnosed between 1998 and 2004. The prominence of these regions was also found through mapping the CIR, as shown in Figure 10. Regions with the highest CIRs were Riyadh with 4.16, Makkah with 3.49 and Eastern Regions with 3.37 per 100,000 population for both genders. Qassim, Madinah, Hail, Baha and Asir reported medium CIR that ranged between 2.26 and 2.97 per 100,000 population. In contrast, the lowest CIRs were reported from Jouf, Jazan, Najran, Northern province and Tabuk, ranging between 1.51 and 1.73 per 100,000 population.
Overall, colorectal cancer is mainly a disease of the middle aged and elderly: 78% of cases (80.1% males and 75.6% females) occurred in people aged above forty-five years and only 4.4% occurred in people less than thirty years old (3.7% males and 5.1% females). However, distribution of colorectal cancers by fifteen-year age groups showed high percentages of colorectal cases reported among younger males in the Jouf, Jazan, Tabuk and Northern regions and younger females in the Qassim, Najran, and Hail regions (Figure 11).
This section has illustrated the various options for spatial display of data at a range of scales and levels of data specificity. This functionality is superior to many atlases which are dominated by choropleth maps, which may not be the best option for data display or for exploring data at the city level. Pie charts provide an option to include age and gender-specific data for larger geographic regions, as shown in Figure 11. Although these data may be exported to a table, the spatial display on a map is easier to interpret and enables the user to identify areas where more CRC screening services may need to be offered. To find specific data for any area (rather than ranges or relative densities), users can refer back to the tables. Our illustrations have used CIR rather than age-adjusted rates, but all maps may be created with AIR or ASR data.
4. Conclusions
This paper has described the development and implementation of an interactive web-based Statistical Spatial Cancer Atlas for Saudi Arabia. Users are able to select sets of cancer statistics and then select criteria such as type of cancer, stage, site, gender, age, ethnicity, etc., in order to create custom maps, charts, corresponding tables of statistics and commentaries of cancer incidence at regional, governorate or city level in Saudi Arabia. The functionality, ease of use and high quality of the output maps, charts, tables and commentaries were designed to meet the requirements of a target group of users working in cancer medicine, cancer care, public health, hospital management, health economics, cancer screening, prevention and awareness and training.
The design of the atlas was based on the use of ESRI ArcGIS Server API software for Flex running on a server in order to access functions for mapping, chart creation, and the generation of tables and commentaries on client computers, which access the server over the Internet using a web browser. The design was implemented and tested using standard sets of statistical and vector map data. The final implementation gave considerable flexibility and high levels of responsiveness and performance during tests where client computers were connected over a local network to a server in the office.
In the future, the atlas will be used to determine whether observed geographic variation in the cancer incidence rates for the most common cancers, such as breast, liver,
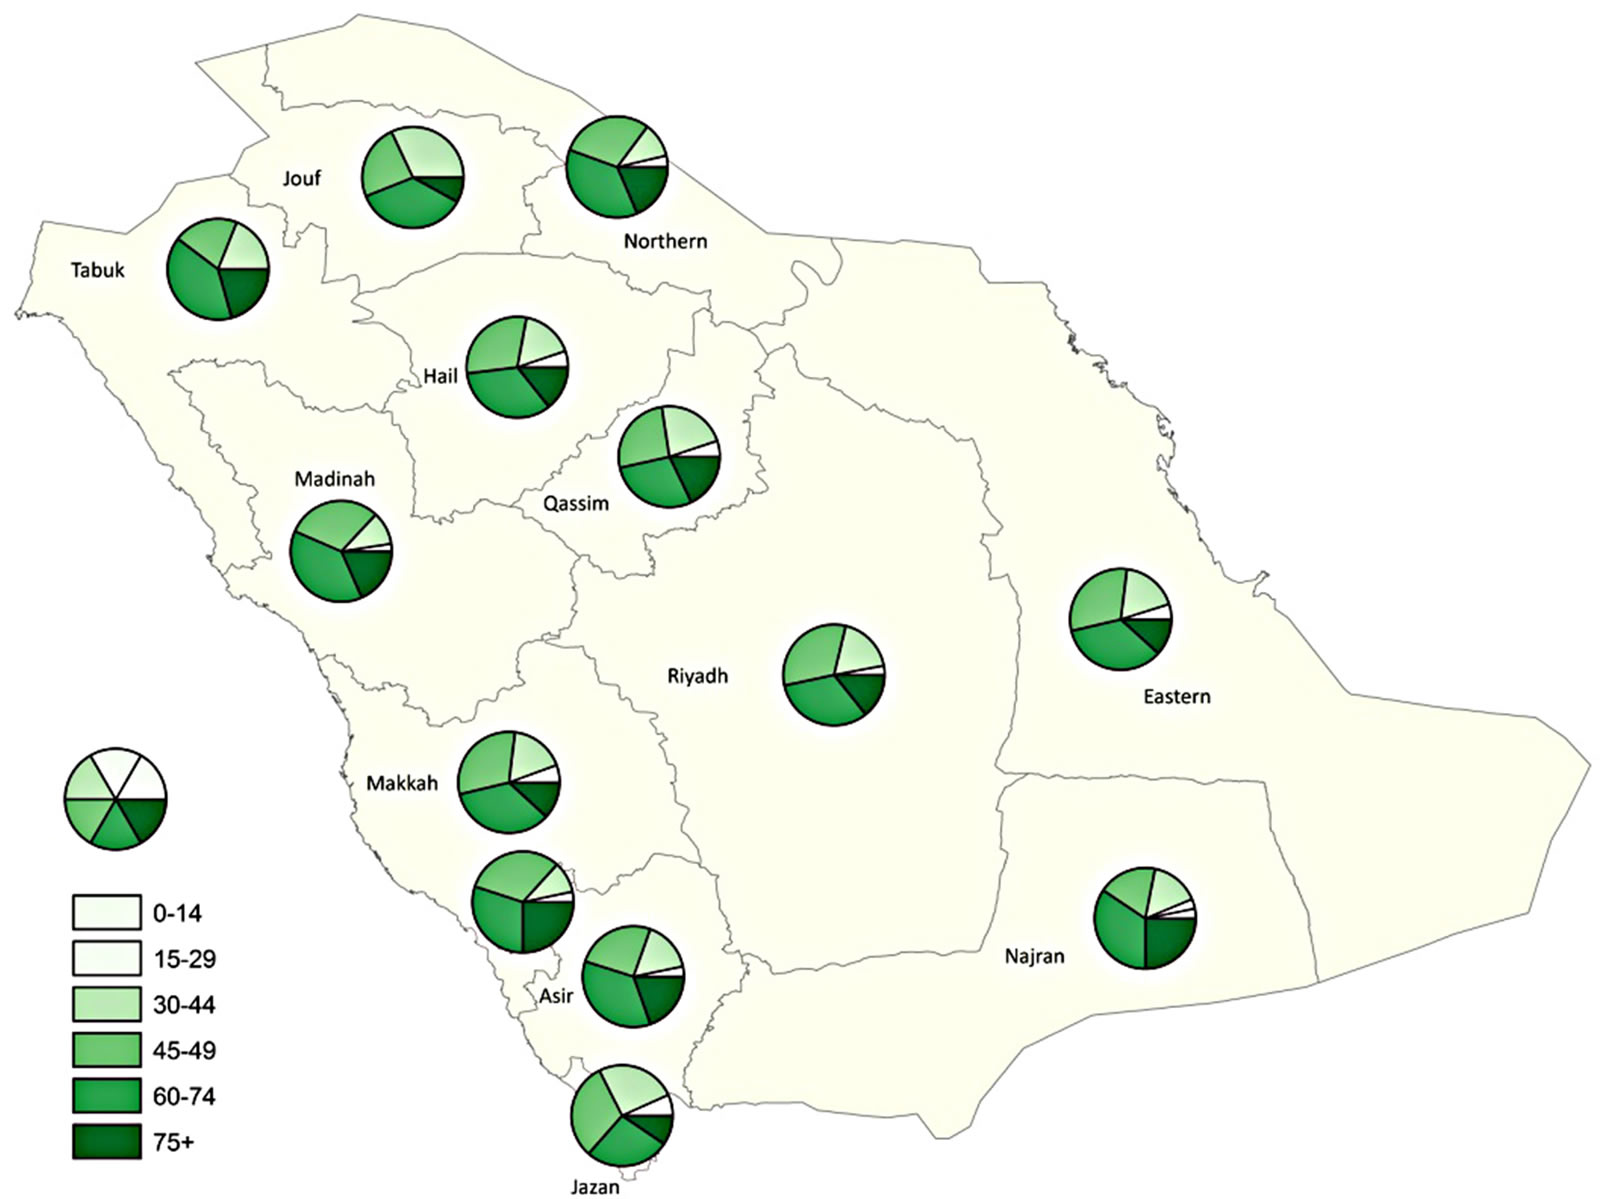
Figure 10. Crude Incidence Rate of Colorectal Cancer, 1998-2004.
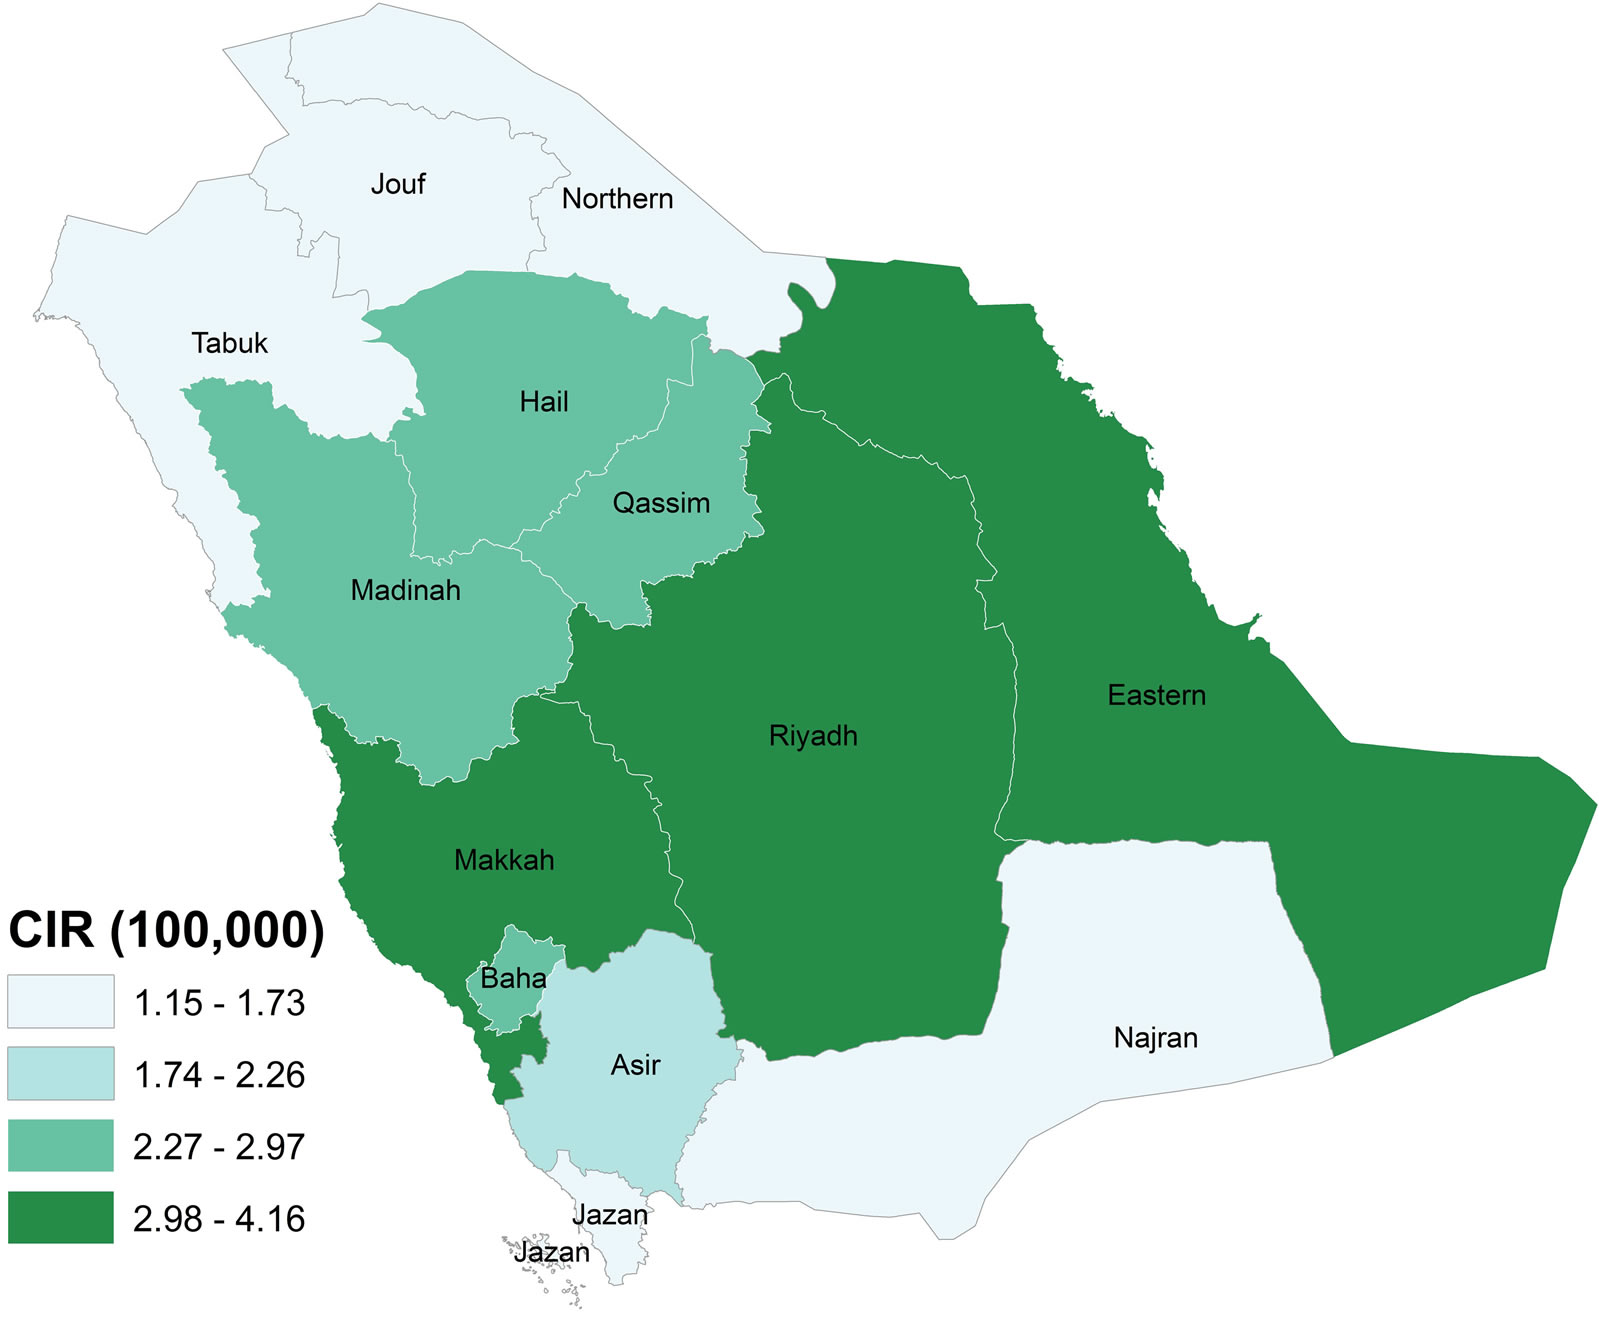
Figure 11. Distribution of CRC by 15-year age groups for both genders.
thyroid, and colorectal cancers, are random or statistically significant. If there are areas of excess, then research questions can be asked regarding whether that excess is stable or temporary over the seven-year study period (1998-2004), whether excesses are consistent across all diagnostic stages, or whether they might be due to excesses in early or late stage diagnoses, and whether they can be attributed to covariates such as age, sex, and urban/rural status. Moreover, there are plans to add other datasets (e.g. socio-economic data, exposure to solar radiation, nitrogen dioxide, fine particle air pollution, etc.) as well as more advanced functionality in the form of various spatial statistical methods, e.g. to help in finding spatial correlations and relationships between cancer and different risk factors using techniques such as geographically weighted regression. Spatial aggregation errors will then need to be carefully considered, as outlined clearly by Luo et al. [38], particularly when using large zones like regions or where health care services are sparsely located or spatially clustered if access to services is considered in the future.
5. Acknowledgements
This research was funded by King Abdulaziz City for Science and Technology (KACST), Saudi Arabia. The authors acknowledge the Saudi Cancer Registry and its board members.
REFERENCES
- World Health Organization (WHO), Cancer Fact Sheet (N 297), updated Feb 2011. 2011. http://www.who.int/mediacentre/factsheets/fs297/en/
- J. G. Brody, R. Rudel, N. I. Maxwell and S. R. Swedis, “Mapping out a Search for Environmental Causes of Breast Cancer,” Public Health Reports, Vol. 111, No. 6, 1996, pp. 494-507. http://www.ncbi.nlm.nih.gov/pmc/articles/PMC1381895/
- J. G. Brody, A. Aschengrau, W. McKelvey, R. A. Rudel, C. H. Swartz and T. Kennedy, “Breast Cancer Risk and Historical Exposure to Pesticides from Wide-Area Applications Assessed with GIS,” Environmental Health Perspectives, Vol. 112, No. 8, 2004, pp. 889-897. http://dx.doi.org/10.1289/ehp.6845
- J. G. Brody, A. Aschengrau, W. McKelvey, C. H. Swartz, T. Kennedy and R. A. Rudel, “Breast Cancer Risk and Drinking Water Contaminated by Wastewater: A Case Control Study,” Environmental Health: A Global Access Science Source 2006, Vol. 5, No. 28, 2006, p. 28.
- A. Biggeri, F. Barbone, C. Lagazio, M. Bovenzi and G. Stanta, “Air Pollution and Lung Cancer in Trieste, Italy: Spatial Analysis of Risk as a Function of Distance from Sources,” Environmental Health Perspectives, Vol. 104, No. 7, 1996, pp. 750-751. http://dx.doi.org/10.1289/ehp.96104750
- M. B. Toledano, L. Jarup, N. Best, J. Wakefield and P. Elliott, “Spatial Variation and Temporal Trends of Testicular Cancer in Great Britain,” British Journal of Cancer, Vol. 84, No. 11, 2001, pp. 1482-1487. http://dx.doi.org/10.1054/bjoc.2001.1739
- G. Rushton, I. Peleg, A. Banerjee, G. Smith and M. West, “Analyzing Geographic Patterns of Disease Incidence: Rates of Late-Stage Colorectal Cancer in Iowa,” Journal of Medical Systems, Vol. 28, No. 3, 2004, pp. 223-236.
- J. R. Meliker, M. J. Slotnick, G. A. AvRuskin, A. Kaufmann, G. M. Jacquez and J. O. Nriagu, “Improving Exposure Assessment in Environmental Epidemiology: Application of Spatio-Temporal Visualization Tools,” Journal of Geographical Systems, Vol. 7, No. 1, 2005, pp. 49-66. http://dx.doi.org/10.1007/s10109-005-0149-4
- L. M. DeChello and T. J. Sheehan, “Spatial Analysis of Colorectal Cancer Incidence and Proportion of Late-Stage in Massachusetts Residents: 1995-1998,” International Journal of Health Geographics, Vol. 6, 2007, p. 20. http://dx.doi.org/10.1186/1476-072X-6-20
- P. Goovaerts, “Combining Area-Based and IndividualLevel Data in the Geostatistical Mapping of Late-Stage Cancer Incidence,” Spatial and Spatio-temporal Epidemiology, Vol. 1, No. 1, 2009, pp. 61-71. http://dx.doi.org/10.1016/j.sste.2009.07.001
- F. Wang, “Spatial Clusters of Cancers in Illinois 1986- 2000,” Journal of Medical Systems, Vol. 28, No. 3, 2004, pp. 237-256. http://dx.doi.org/10.1023/B:JOMS.0000032842.78643.38
- P. A. Rogerson, “The Detection of Clusters Using a Spatial Version of the Chi-Square Goodness-of-Fit Statistic,” Geographical Analysis, Vol. 31, No. 2, 1999, pp. 130-147. http://dx.doi.org/10.1111/j.1538-4632.1999.tb00973.x
- V. Vieira, T. Webster, J. Weinberg, A. Aschengrau and D. Ozonoff, “Spatial Analysis of Lung, Colorectal, and Breast Cancer on Cape Cod: An Application of Generalized Additive Models to Case-Control Data,” Environmental Health: A Global Access Science Source, Vol. 4, 2005, p. 11.
- J. C. McEntee and Y. Ogneva-Himmelberger, “Diesel Particulate Matter, Lung Cancer, and Asthma Incidences along Major Traffic Corridors in MA, USA: A GIS Analysis,” Health & Place, Vol. 14, No. 4, 2008, pp. 815- 826. http://dx.doi.org/10.1016/j.healthplace.2008.01.002
- N. Tian, J. Gaines Wilson and F. Benjamin Zhan, “Female Breast Cancer Mortality Clusters within Racial Groups in the United States,” Health Place, Vol. 16, No. 2, 2010, pp. 209-218. http://dx.doi.org/10.1016/j.healthplace.2009.09.012
- S. M. Cramb, K. L. Mengersen and P. D. Baade, “Developing the Atlas of Cancer in Queensland: Methodological Issues,” International Journal of Health Geographics, Vol. 10, 2011, p. 9. http://dx.doi.org/10.1186/1476-072X-10-9
- M. Haklay, A. Singleton and C. Parker, “Web Mapping 2.0: The Neogeography of the GeoWeb,” Geography Compass, Vol. 2, No. 6, 2008, pp. 2011-2039. http://dx.doi.org/10.1111/j.1749-8198.2008.00167.x
- National Cancer Institute, Atlas of Cancer Mortality in the US, 1950-1994. http://ratecalc.cancer.gov/
- M. MacEachren, S. Crawford, M., Akella and G. Lengerich, “Design and Implementation of a Model, WebBased, GIS-Enabled Cancer Atlas,” The Cartographic Journal, Vol. 45, No. 4, 2008, pp. 246-260. http://dx.doi.org/10.1179/174327708X347755
- E. Lengerich, A. MacEachren, R. Parrott, G. Chase, K. Brenda and S. Crawford, Pennsylvania Cancer Atlas, 2010. http://www.geovista.psu.edu/resources/flyers/GV_PA_Atlas.pdf
- CDC, Interactive Cancer Atlas (InCA), 2010. http://www.cdc.gov/Features/CancerAtlas/
- NCIN, Cancer e-Atlas, 2010. http://www.ncin.org.uk/cancer_information_tools/eatlas.aspx
- A. Nandakumar, P. C. Gupta, P. Gangadharan, R. N. Visweswara and D. M. Parkin, “Geographic Pathology Revisited: Development of an Atlas of Cancer in India,” International Journal of Cancer, Vol. 116, No. 5, 2005, pp. 740-754. http://dx.doi.org/10.1002/ijc.21109
- NHS, “London Healthcare Benchmarking Tool,” 2010. http://lhbt.london.nhs.uk/
- NHS, “London Health Programmes: Health Needs Assessment Toolkit,” 2011. http://hna.londonhp.nhs.uk/
- ESRI, “ArcGIS API for Flex,” 2010. http://help.arcgis.com/en/webapi/flex/index.html
- SCR, “Cancer Incidence Report Saudi Arabia 2004,” Saudi Cancer Registry, Saudi Arabia, 2004.
- S. Openshaw, “Ecological Fallacies and the Analysis of areal Census Data,” Environment and Planning A, Vol. 16, No. 1, 1984, pp. 17-31. http://dx.doi.org/10.1068/a160017
- P. Boyle and D. M. Parkin, “Statistical Methods for Registries,” In: O. M. Jensen, D. M. Parkin, R. MacLennan, C. S. Muir and R. G. Skeet, Eds., Cancer Registration: Principles and Methods, IARC Scientific Publication No. 95, International Agency for Research on Cancer, Lyon, 1991, pp. 126-158.
- A. Nandakumar, P. C. Gupta, P. Gangadharan, R. N. Visweswara and D. M. Parkin, “Geographic Pathology Revisited: Development of an Atlas of Cancer in India,” International Journal of Cancer, Vol. 116, No. 5, 2005, pp. 740-754. http://dx.doi.org/10.1002/ijc.21109
- M. Quinn, H. Wood, N. Cooper and S. Rowan, “Cancer atlas of the United Kingdom and Ireland 1991-2000,” National Statistics Publication, Ashford Colour Press Ltd. Gosport, Great Britain, 2005, pp. 211-217.
- WHO, World Health Organization, “International Statistical Classification of Diseases and Related Health Problems,” 10th Revision, 2007. http://apps.who.int/classifications/apps/icd/icd10online/
- I. Mansoor, I. H. Zahrani, S. Abdul Aziz, “Colorectal cancers in Saudi Arabia,” Saudi Medical Journal, Vol. 23, No. 3, 2002, pp. 322-327.
- E. M. Ibrahim, A. A. Zeeneldin, T. R. El-Khodary, A. M. Al-Gahmi and B. M. Bin Sadiq, “Past, Present and Future of Colorectal Cancer in the Kingdom of Saudi Arabia,” Saudi Journal of Gastroenterology, Vol. 14, No. 4, 2008, pp. 178-182. http://dx.doi.org/10.4103/1319-3767.43275
- M. H. Mosli, M. S. Al-Ahwal, “Colorectal Cancer in the Kingdom of Saudi Arabia: Need for Screening,” Asian Pacific Journal of Cancer Prevention, Vol. 13, No. 8, 2012, pp. 3809-3813. http://dx.doi.org/10.7314/APJCP.2012.13.8.3809
- ACS, American Cancer Society. http://www.cancer.org
- T. T. Fancher, J. A. Palesty, L. Rashidi and S. J. Dudrick, “Is Gender Related to the Stage of Colorectal Cancer at Initial Presentation in Young Patients?” Journal of Surgical Research, Vol. 165, No. 1, 2011, pp. 15-18. http://dx.doi.org/10.1016/j.jss.2010.08.054
- L. Luo, S. McLafferty and F. H. Wang, “Analyzing Spatial Aggregation error in Statistical Models of Late-Stage Cancer Risk: A Monte Carlo Simulation Approach,” International Journal of Health Geographics, Vol. 9, 2010, p. 51. http://dx.doi.org/10.1186/1476-072X-9-51
Supplementary Material
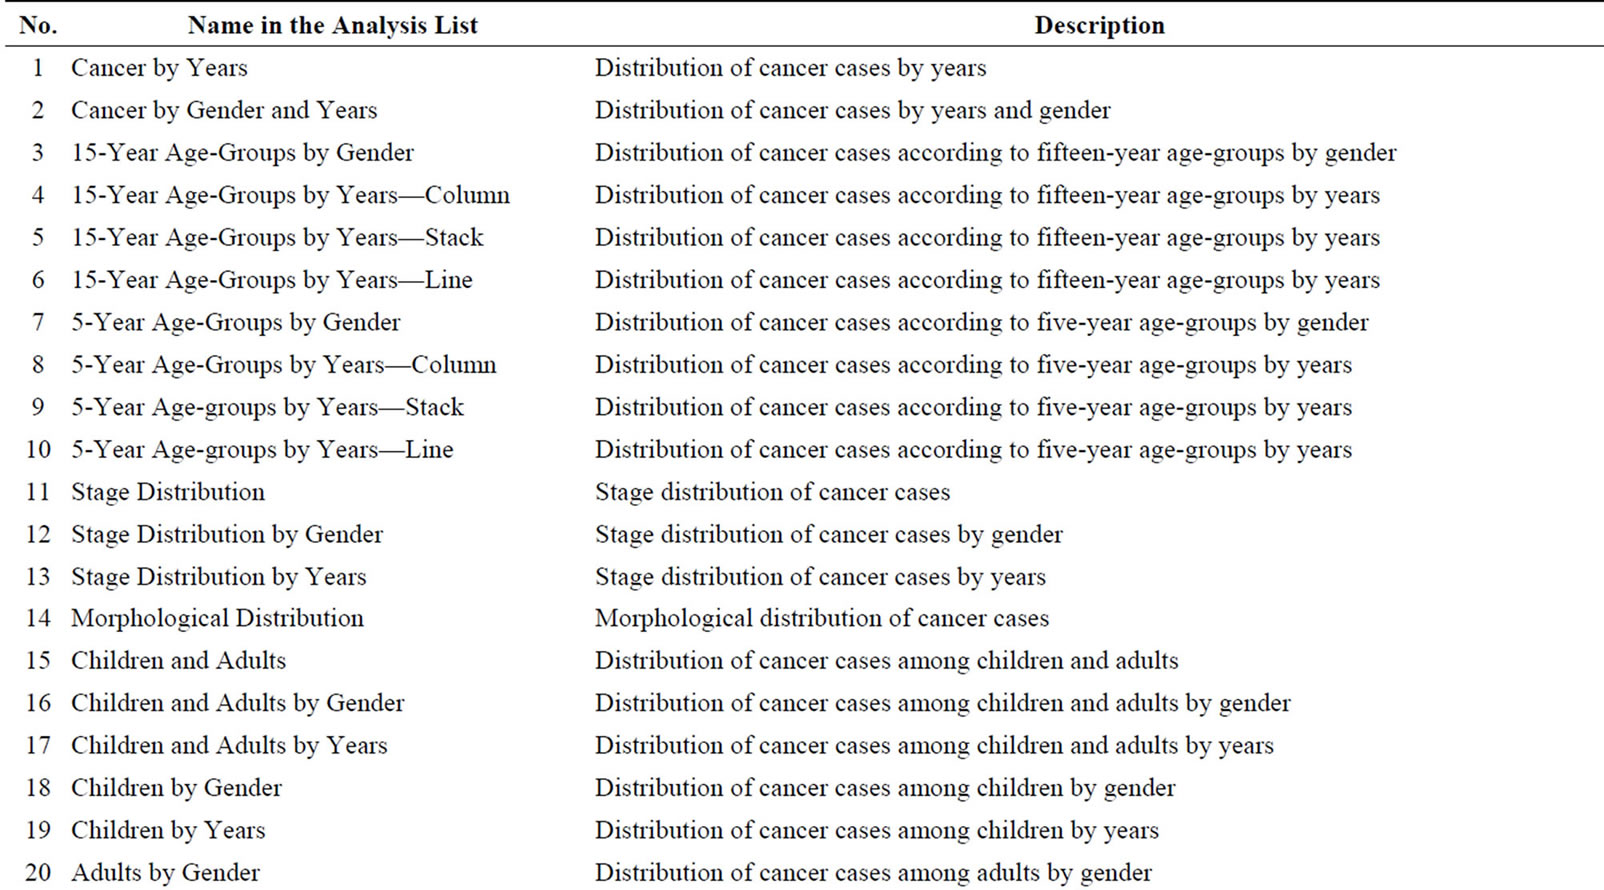
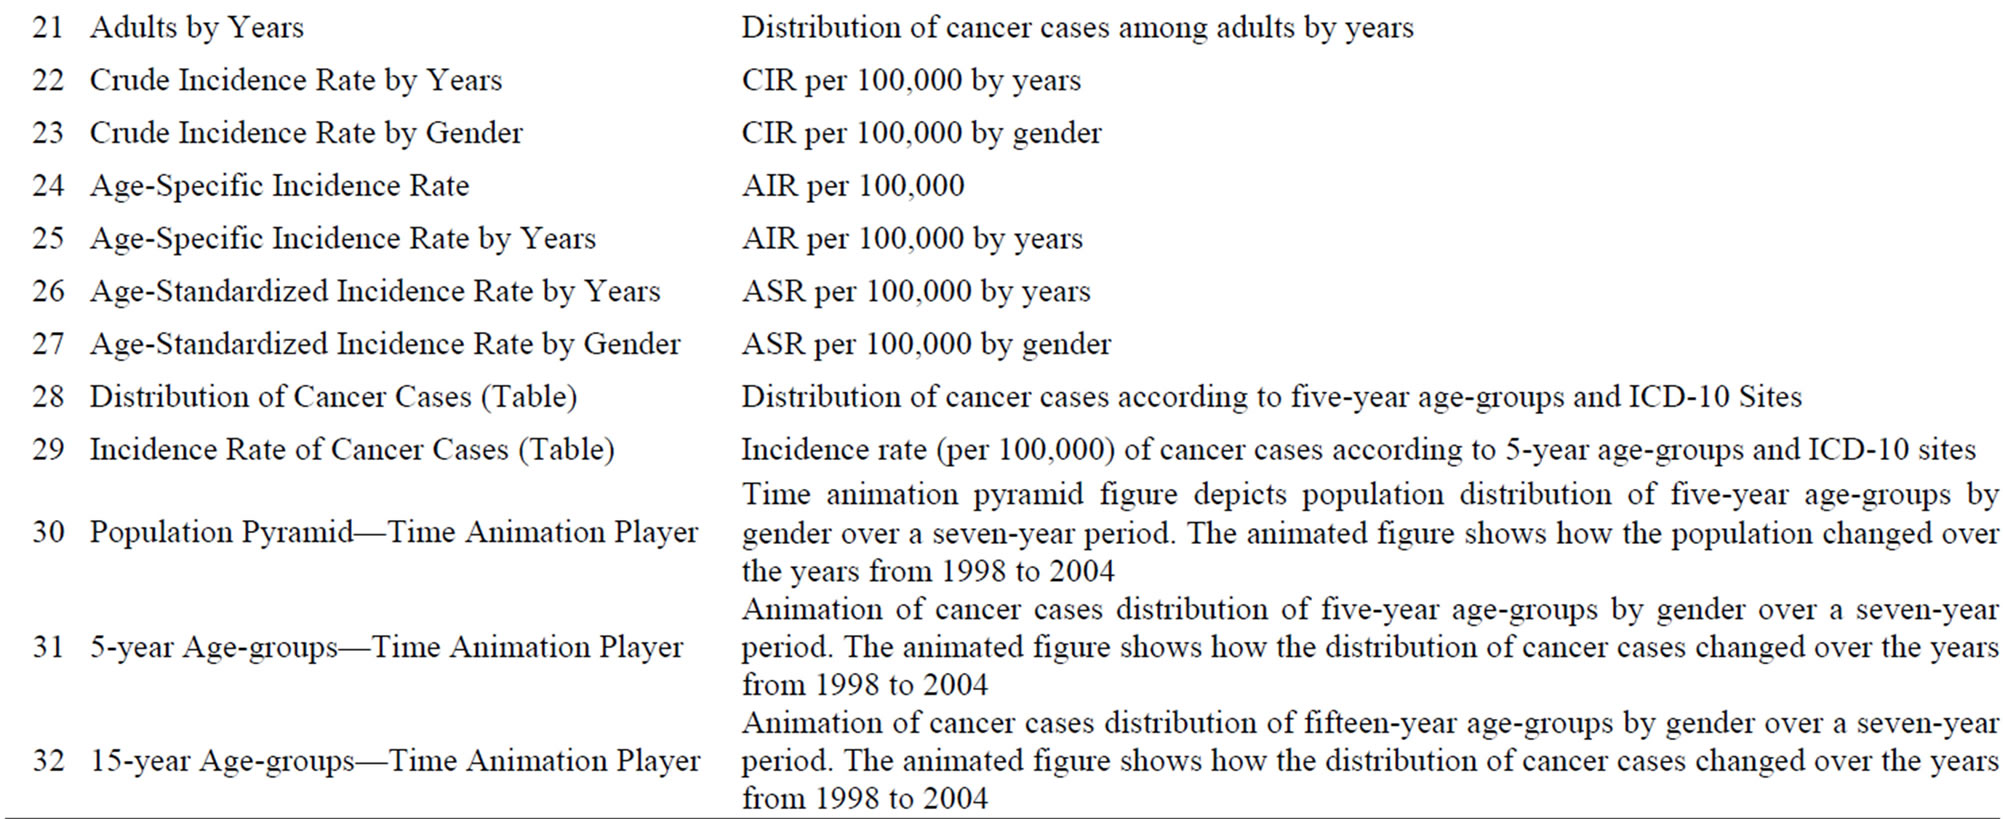
Supplementary Table 1: Name of the standard analysis type in the list and the description.
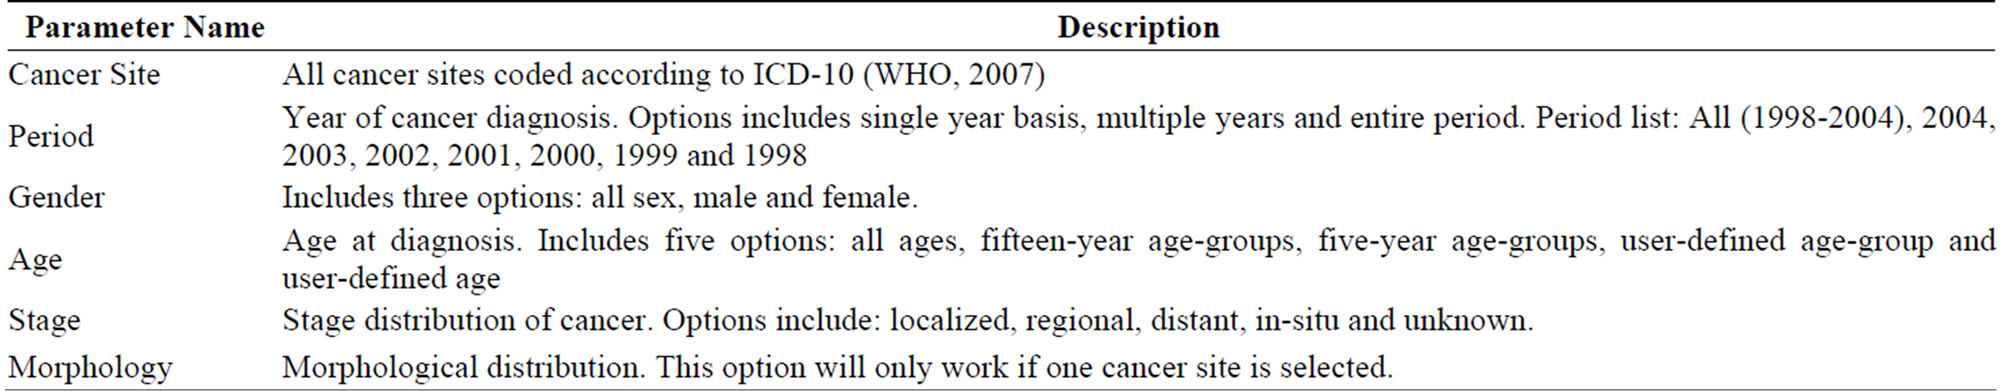
Supplementary Table 2: Parameters that can be adjusted using the advanced analysis option in the CASA. Note that since the atlas is geared to researchers in the public health sector, many are familiar with the terminology used here. However, a more detailed manual, which is available for the atlas, explains this terminology in more detail.
NOTES
*Corresponding author.