Journal of Geographic Information System
Vol. 4 No. 6 (2012) , Article ID: 26320 , 9 pages DOI:10.4236/jgis.2012.46057
Spatio-Temporal Land Cover Dynamics in Open Cast Coal Mine Area of Singrauli, M.P., India
Department of Geology, Aligarh Muslim University, Aligarh, India
Email: *immigeol@gmail.com
Received June 1, 2012; revised July 3, 2012; accepted August 5, 2012
Keywords: Change Detection; Mining and Industrialization; Land Degradation
ABSTRACT
Singrauli is an opencast coal mining area where large scale mining activities are going on continuously, land use/land cover studies are of vital importance to observe the changes in the land use/land cover. The present study utilizes multi-spectral/multi-temporal data of Indian Remote Sensing Satellite (IRS) LISS II geocoded (FCC) of 4th May 1993 and LISS III of 4th May 2010 for thematic mapping. Survey of India toposheet 63L/12 on scale 1:50,000 were used for preparation of base map which was overlaid on the FCC for land use/land cover mapping through visual interpretation. Visual interpretation of satellite imagery led to the identification of 15 land use/land cover categories such as dense forest, open forest, open scrub, plantation, cultivated land, uncultivated land, mining pit, overburden dumps, wasteland and settlement. The ground truth verification was carried out in key areas to rectify the errors in generated maps and then land use/land cover maps were finalized. The comparative analysis of land use/land cover shows that dense forest has been degraded to open forest, open scrubs and mining pits due to the expansion of mining activity. Open scrubs has increased, overburden dumps has increased, settlement has also increased, cultivated land has decreased and changed into uncultivated land and wasteland. It has also been observed that the plantation has been done on overburden dumps and residential colonies of NCL and NTPC. It has been identified that the main drivers which has increased the rate of change in land use/land cover are mainly coal mining activities and industrial expansion.
1. Introduction
Coal mining is one of the core industries that contribute to the economic development of India but deteriorates the environment [1]. The industrial expansion requires enormous energy generation for which huge amount of coal is extracted through mining which causes widespread landscape destruction [2]. As for environmental point of view coal mining is a major habitat transforming activity which has a number of adverse environmental consequences, namely soil erosion, acid mine drainage and increased sediment load as a result of abandoned and un-reclaimed mined land [3]. Land, air and water are adversely affected by different stages of mining processes and results in serious environmental degradation [4,5].
Land use/land cover changes has been described as the most significant regional anthropogenic disturbance to the environment [6], and are consistently associated with mining of natural resources [7]. Detailed knowledge of land use practice, land use pattern changes with time and its effects on environment and system are important to understand the importance of changes in land use [8]. Mining, especially open cast mining has a major impact on landscape, during pre mining and post mining operation. Large scale coal mining operations have considerable impact on the pre-mining environmental scenario [9]. Removal of vegetation cover results in soil degradation due to accelerated water erosion, soil compaction and soil crusting, affecting productivity of land [10]. Mining activities also disturbs large tract of land due to overburden dumps which change the natural topography and drainage pattern of the area [9]. The change in land cover due to the coal mining activities particularly deforestation, has attracted worldwide attention because of their potential effects on soil erosion, run off and carbon dioxide level. Large scale deforestation has been reported in India in the past [11].
The concept, method and application of land use/land cover studies are introduced to mining area in order to find the land use change and give support to land management and ecological reconstruction [12]. It’s prerequisite for planning, policy making and developmental programs that land use/land cover information its spatial distribution and change in land use pattern is commonly used. Information about land use/land cover not only provides better understanding of land utilization aspects but also plays important role in developmental planning [13]. The studies of land use/land cover of coal mining area will help in understanding the mechanism of land use/land cover, the economic activities of human society would be adjusted and make the land use more reasonable so as to achieve the purpose of land resource continual use [14].
Remote sensing and Geographic information system (GSI) are important tools for studying the land use pattern and their dynamics. The mapping of land use classes and monitoring their changes with time has been widely recognized [7]. The change detection in land use/land cover due to natural and human activities can be monitored by using multidate images to evaluate differences in land cover [15]. The present study makes an attempt to quantify land cover changes in Singrauli industrial belt using multi temporal remote sensing data, supported by topographic map, Census of India reports, revenue records and ground truth data. The main objective of present study is to understand land use/land cover change in time and space, with special references to the coal mining activities.
2. Study Area
The study area lies partly in Singrauli district of Madhya Pradesh and partly in Sonebhadra district of Uttar Pradesh, bounded within the geo-coordinates 24˚00'N to 24˚15'N latitudes and 82˚30'E to 82˚45'E longitudes, (Figure 1). The total area of the coal field is 2201 km2, however at present only 300 km2 area is exploited for coal. With the availability of power grade coal reserves and the nearby water reservoirs (Govind Ballabh Pant Sagar) offers an excellent location for super thermal power plants (STPS), Aluminium plants, and cement industries. Singrauli coalfield has coal reserves of 1789.41 million tonnes with a steep rise in coal production from 30.70 million tonnes in 1993 to 67.67 million tonnes in 2010. The area is well suited for thermal power generation and is expected to produce 25% of thermal power need of India [16]. The climate of the district Singrauli is tropical monsoonal dry during the period of November up to June while during rainy season the atmosphere is very humid. The average rainfall received during the last 26 years is 1177.06 mm, the maximum and the minimum rainfall received is 1457.30 mm and 798.60 mm in 1978 & 1979, respectively. The geological sequence of the area is represented by series of formations that have been recognized on broad lithic characteristics within the Gondwana rocks of Singrauli coal field. In ascending order they are Talchir, Barakar, Barren Measure, Raniganj, and Mahadeva. However only four Precambrian, Talchir, Barakar, Barren Measure has been reported from study area. The most dominant geological formation in the area is Barakar formation covering 515.18 km2 followed by Talchir covering 118.94 km2, Precambrian covering 57.63 km2 and Barren Measure covering 16.89 km2 respectively. The area is occupied by structural hills on the northern part with elevation ranging between 270 m - 620 m, formed of resistant Precambrian rocks. The structural plateau is made up of coalbearing Gondwana rocks. Low lying flats characterized by gentle-undulating topography in the central part of the area where most of the agricultural activities have been noticed [17]. The Kachni, Mayar, Motwani and Baliya nala are four main dendritic perennial streams or river transverse through the Singrauli coal field which are mostly seasonal.
The development of the Singrauli area began during the year 1950s with the construction of two dams on the Rihand River. These reservoirs were mainly for irrigation purpose but 400 MW of hydropower has also been generated. Before the Coal mining and other industrial activities the region was densely covered with tropical deciduous forests. Coal mining operation on large scale has significantly changed the pre-mining environment scenario. In addition to mining activity, the surrounding industrialization have also an adverse impact on land use/ land cover, air quality and water quality of the study area.
3. Data Used and Methodology
Indian Remote Sensing Satellite (IRS) LISS II geocoded False Colour Composite (FCC) data of 4th May 1993 and IRS LISS III (FCC) of 4th May 2010 were used to analyze the land use/land cover pattern. Data available of the same season gives uniform spectral and radiometric characteristics and minimize the seasonal variation. The survey of India topographic sheets No 63L/12 scale 1:50,000 of 1976 was used for preparation of base map. The climate data of district Singrauli from 1978-2010 has been obtained from the Indian Meteorological Department (IMD) Pune. Secondary data obtained from published and unpublished sources such as internet (www.ncl.nic.in, www.ntpc.com, www.singrauli.nic.in) and district statistical handbook have been also used.
Visual interpretation is the effective method for classifying land use/land cover especially when the analyst is familiar with the area being classified from satellite data. This method uses skill that were originally developed for interpreting aerial photographs, and takes into consideration various photographic and geotechnical elements such as tone, texture, shape, size, association, drainage, landform and relationship with other objects to identify different land cover classes [18]. Land use/land cover change information can be obtained by either image-toimage comparison or map-to-map comparison [19]. Using
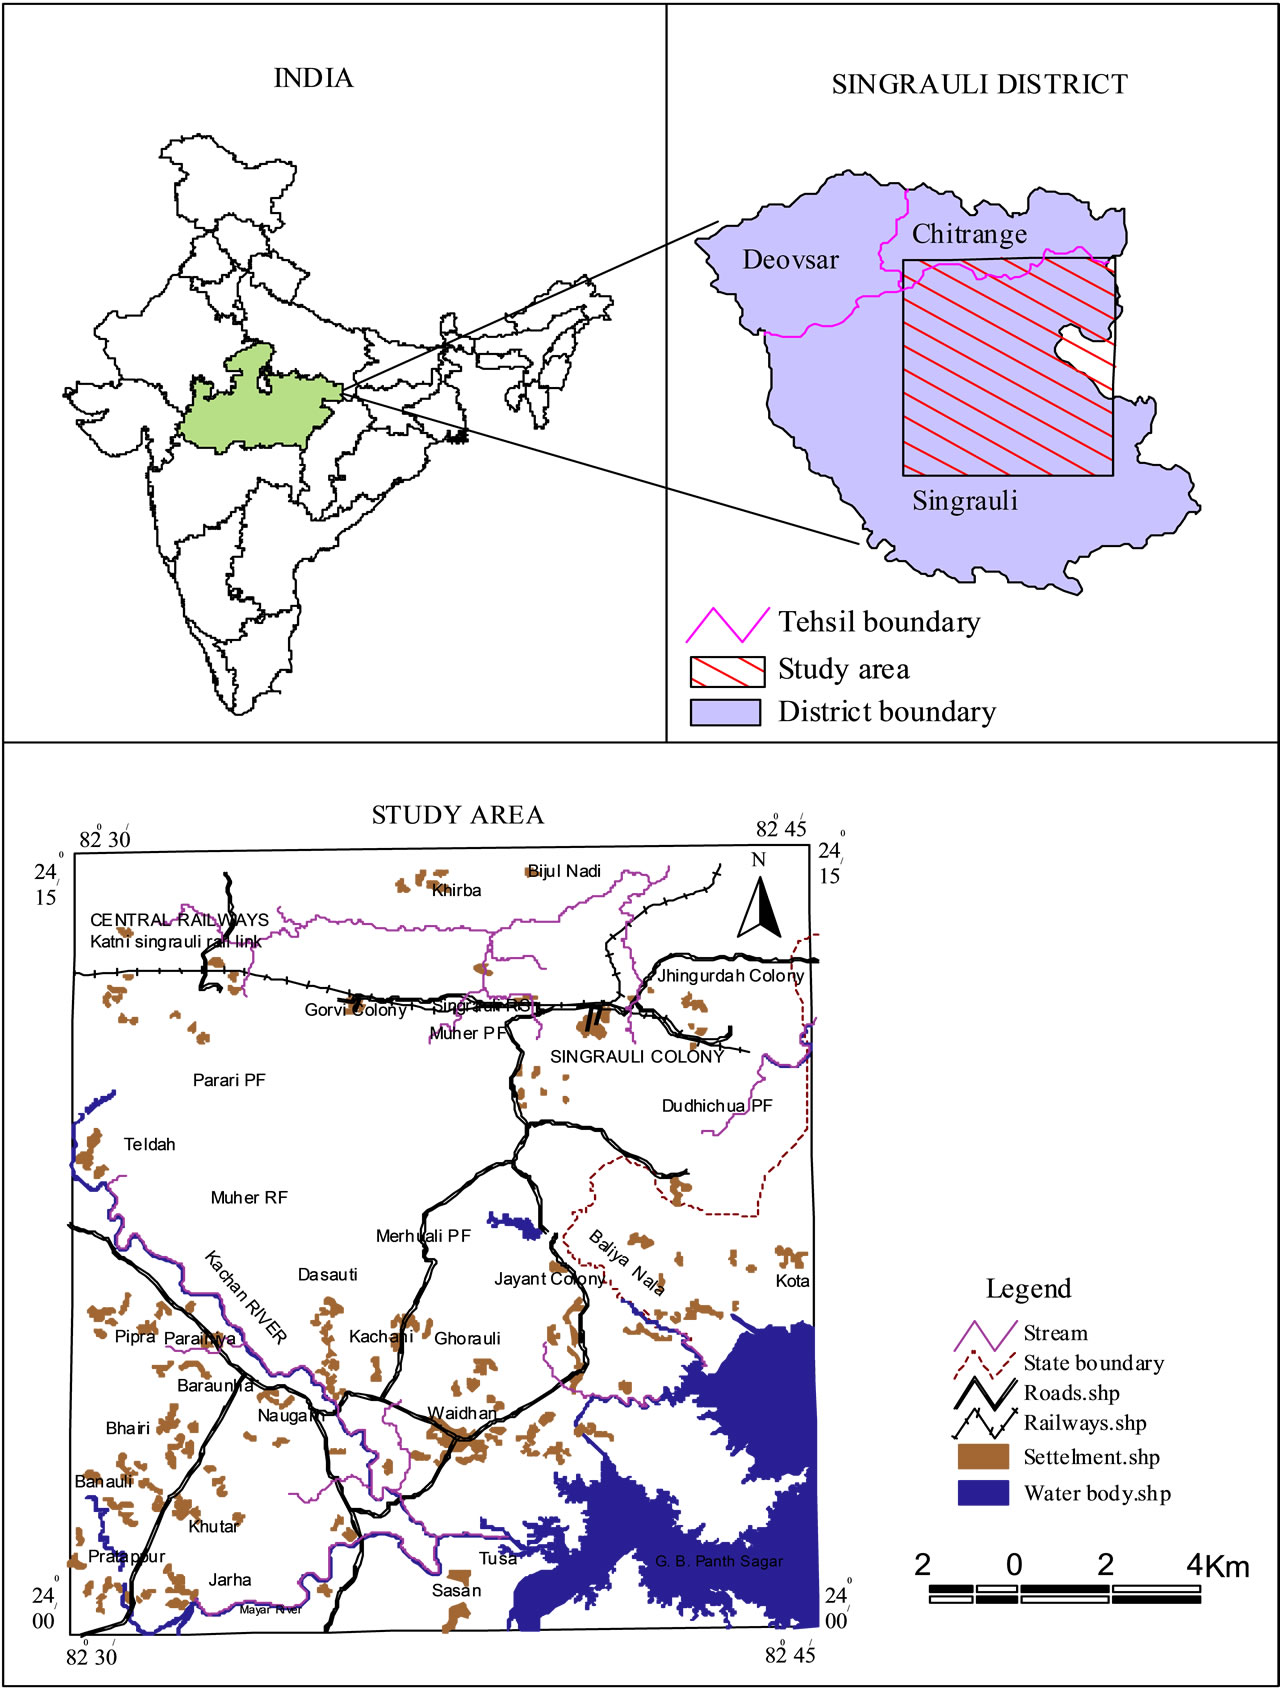
Figure 1. Location map of the study area.
map-to-map comparison, images are to be classified and then maps are generated to compare which gives complete detail of land use/land cover changes. In the present study, map-to-map comparison was used for land use/ land cover change detection. The images of both the years (1993 and 2010) were registered with topographical map to minimize geometric errors. Base map of the area having details such as settlement, road, railway line network, rivers and water bodies etc were superimposed on geocoded False Colour Composite (FCC) data for visual interpretation which led to the identification of various land cover categories in the study area. Land cover were categorized in 15 classes namely dense forest, open forest, open scrub, plantation, cultivated land, uncultivated land, mining pit, overburden dumps, waste land, rocky area, settlement, ash pond, water body, thermal power plant and dry river channel. These categories were identified on the basis of visual interpretation of satellite data and ground truth verification were done in the key areas for editing and authentication. On screen digitization technique has been carried out to digitize the maps using ArcMap 10 software for land use analysis. The steps followed for analysis are a) Digitization of land use map; b) Creation of polygon topology assigning unique id for each polygon; c) Editing. Area statistics of land use categories have been calculated in ArcMap 10 in sq.km as well as in percentage. The change in the extent of different land use categories during the period from 1993-2010 was analyzed and computed.
4. Results and Discussion
Significant land use/land cover changes have taken place during 1993-2010 period due to natural and anthropogenic activities. Land use/land cover information derived from IRS LISS II 1993 (Figure 2), and IRS LISS III 2010 (Figure 3). Area statistics of each land use/land cover category of 1993 and 2010 were generated in ArcMap 10 and has been determined to analyze change in their spatial distribution (Table 1). By comparing the land use/land cover maps of 1993 and 2010 a change detection map has been automatically generated in Arc View GIS software to assess the major changes in the land use/land cover during 1993-2010 (Figure 4). The comparative analysis of each land use/land cover statistics reveals that, the dense and open forest are the important land cover categories which together constitute 273 km2, i.e. 37.5% of the total area. The rest 62.5% area comprise open scrub, plantation, cultivated land, uncultivated land, mining pit, overburden dumps, wasteland, rocky area, settlement, ash pond, water bodies, thermal power plant and dry river.
Land use/land cover categories which shows increase in area are, open forest occupies an area of 144.0 km2 in 1993 and 148.09 km2 in 2010, shows an increase of 4.1 km2 in 2010 in the northern, north-western and northeastern side at an elevation of 344 m to 501 m whereas on southern side elevation ranges from 265 m - 343 m with gentle slope. The mining pits has increased from 7.5 km2 in 1993 to 11.12 km2 in 2010, shows total increase of 3.6 km2 area, whereas, overburden dumps has also increased from 18.6 km2 in 1993 to 39.20 km2 in 2010 showing an increase of 20.6 km2 area respectively. Mining pits and overburden dumps are mostly associated with high elevation ranging from 400 m to 550 m in the central part and slope vary from moderate to very steep, whereas towards the north western side Gorvi mine is categorized under gentle slope with higher elevations (475 m to 550 m). Open scrub shows an increase of 17.7 km2 from 24.6 km2 in 1993 to 42.24 km2 in 2010. Open scrub occupies most of the area in southern side at an elevation of 344 m to 421 m with gentle slope. Plantation area shows increase of 12.6 km2 from 10.8 km2 to 23.43 km2 in 2010 in the central part near the mining/industrial activities at an elevation of 400 m to 500 m with gentle to moderate slope. The uncultivated land occupies 142.6 km2 in 1993 which has rose to 147.5 km2 in 2010, registering an increase of 4.9 km2, wasteland shows increase of 6.3 km2 from 24.8 km2 in 1993 to 31.05 km2 in 2010. The settlement area which includes rural settlement, urban settlement and Industrial residential complexes shows increase of 12.8 km2 from 32.2 km2 in 1993 to 44.97 km2 in 2010. The ash pond increases from 2.3 km2 in 1993 to 8.44 km2 in 2010, showing increase of 6.2 km2. The dry river also shows increase of 2.9 km2 from 1.7 km2 in 1993 to 4.60 km2 in 2010.
The land use/land cover categories which show decrease in area from 1993 to 2010 are dense forest occupies 129.0 km2 in 1993 and 80.10 km2 in 2010, showing a decrease of 48.9 km2 which is mostly associated with higher elevation ranging from 442 m to 618 m in the north, north-east and north-west with moderate to very steep slopes. Cultivated land show decreases of 21.2 km2 from 113.0 km2 in 1993 to 91.80 km2 in 2010 and water body also show decrease of 21.6 km2 from 59.1 km2 in 1993 to 37.50 km2 in 2010. Cultivated land and uncultivated land mostly occupy the area in the north, north-east and north-west at an elevation of 344 m to 421 m elevation however in southern side elevation ranges from 265 m to 304 m elevation and falls under gentle slope.
The change analysis shows decrease in dense forest is primarily due to the rapid expansion of coal mining activity in dense forest area which has resulted in clearance of forest near mining area. But at places it has been converted to open forest due to reduction in canopy cover. The decline in the area under cultivated land is attributed to decline in rainfall which adversely affects the rainfed agriculture as has been corroborated by rainfall data analysis. Water table decreases from ground level also
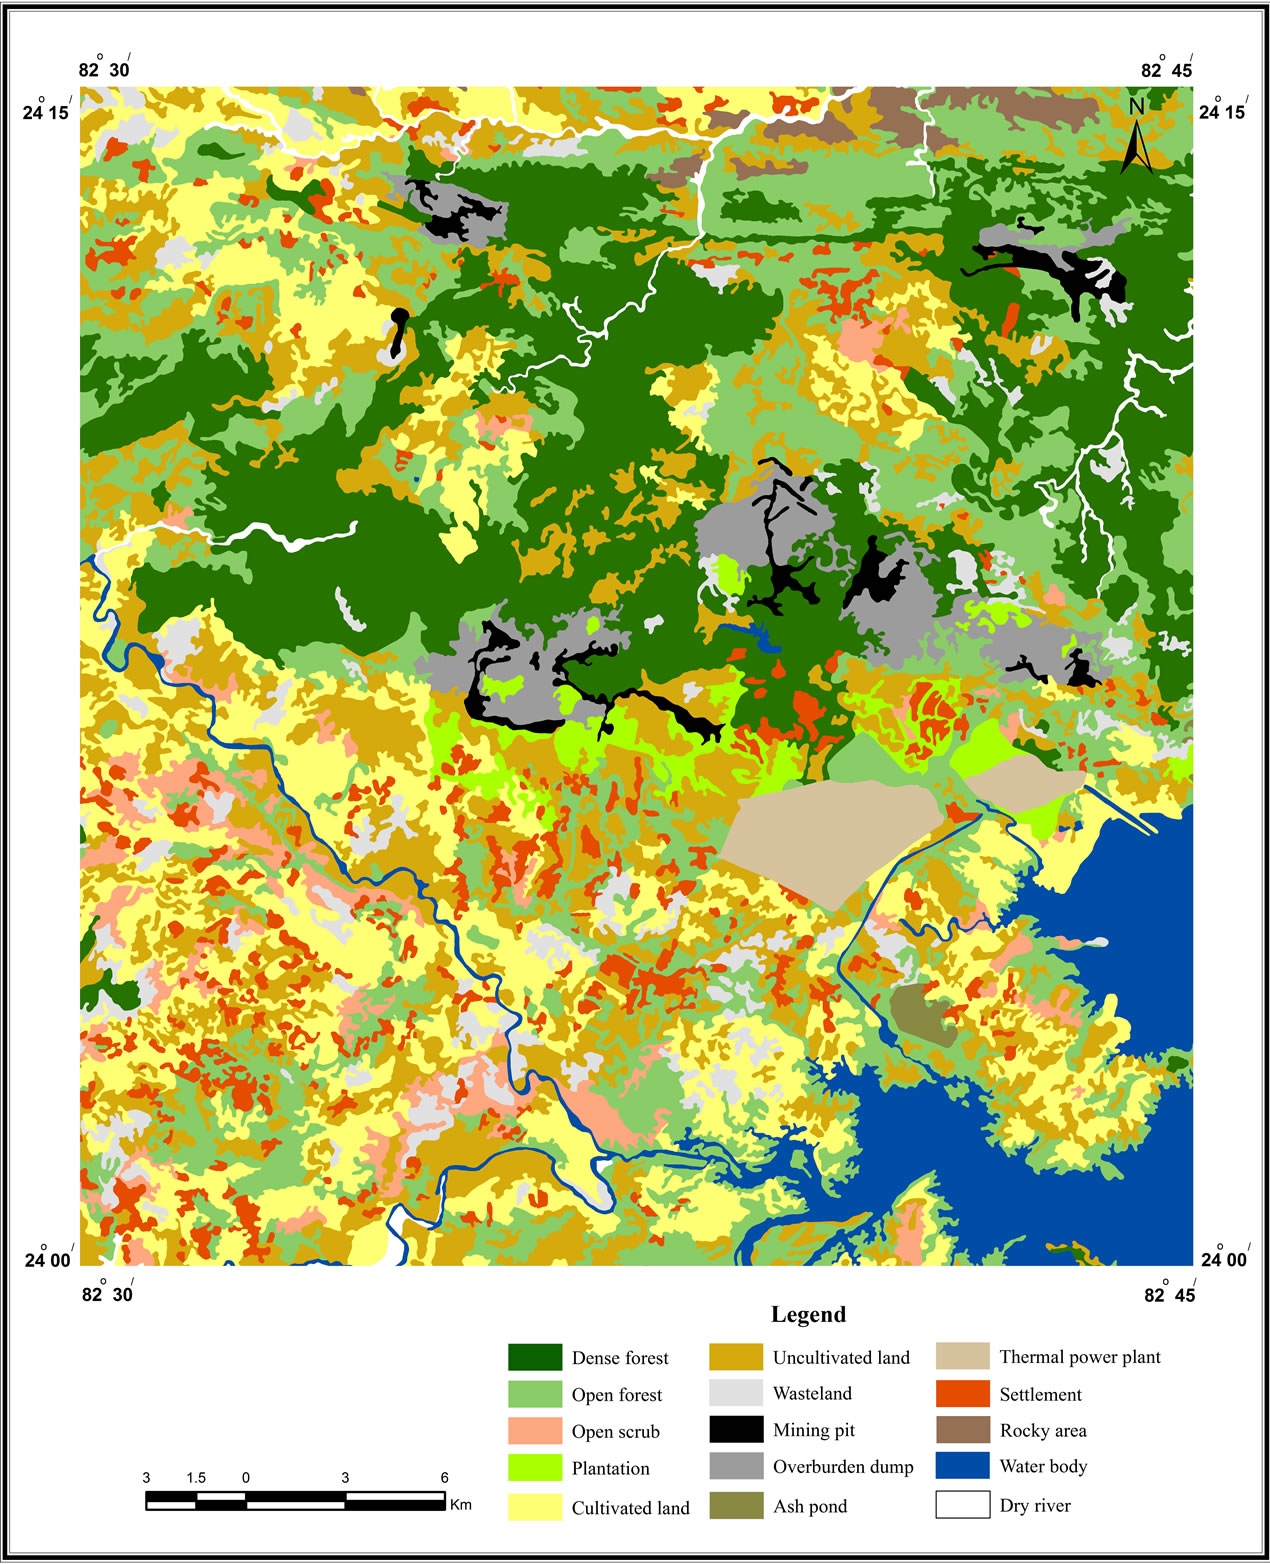
Figure 2. Land use/land cover map of Singrauli area based on IRS LISS II (1993).
support the finding as sufficient water is not available for irrigation to support agriculture. Due to expansion of industries and coal mining farmers have been relocated resulting in loss of cultivated land.
The open forest has been increased because dense forest has degraded and converted to open forest by removing
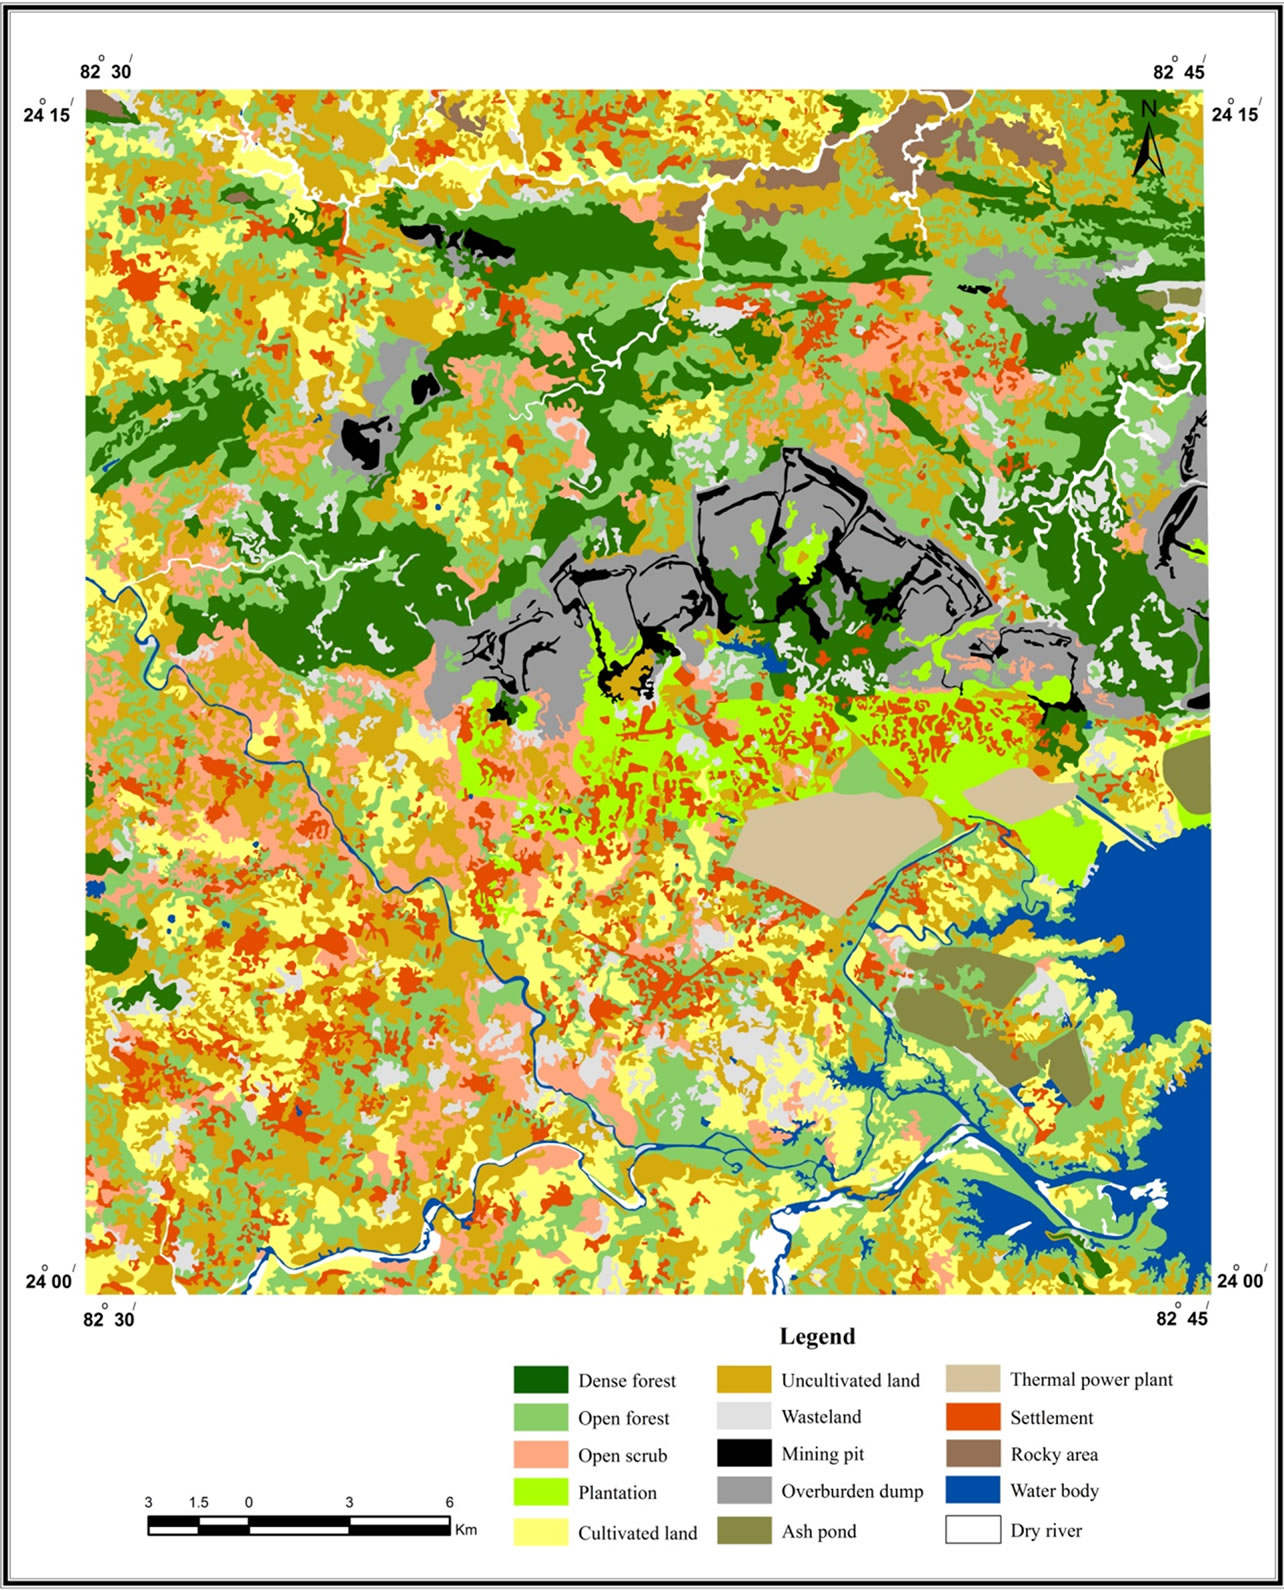
Figure 3. Land use/land cover map of Singrauli area based on IRS P6 LISS III (2010).
large number of trees for rapid expansion of mining activities in the forest area. The increase in area is probably due to the degradation of dense forest into open forest near Parari and Mehrauli protected forest, Teldha and
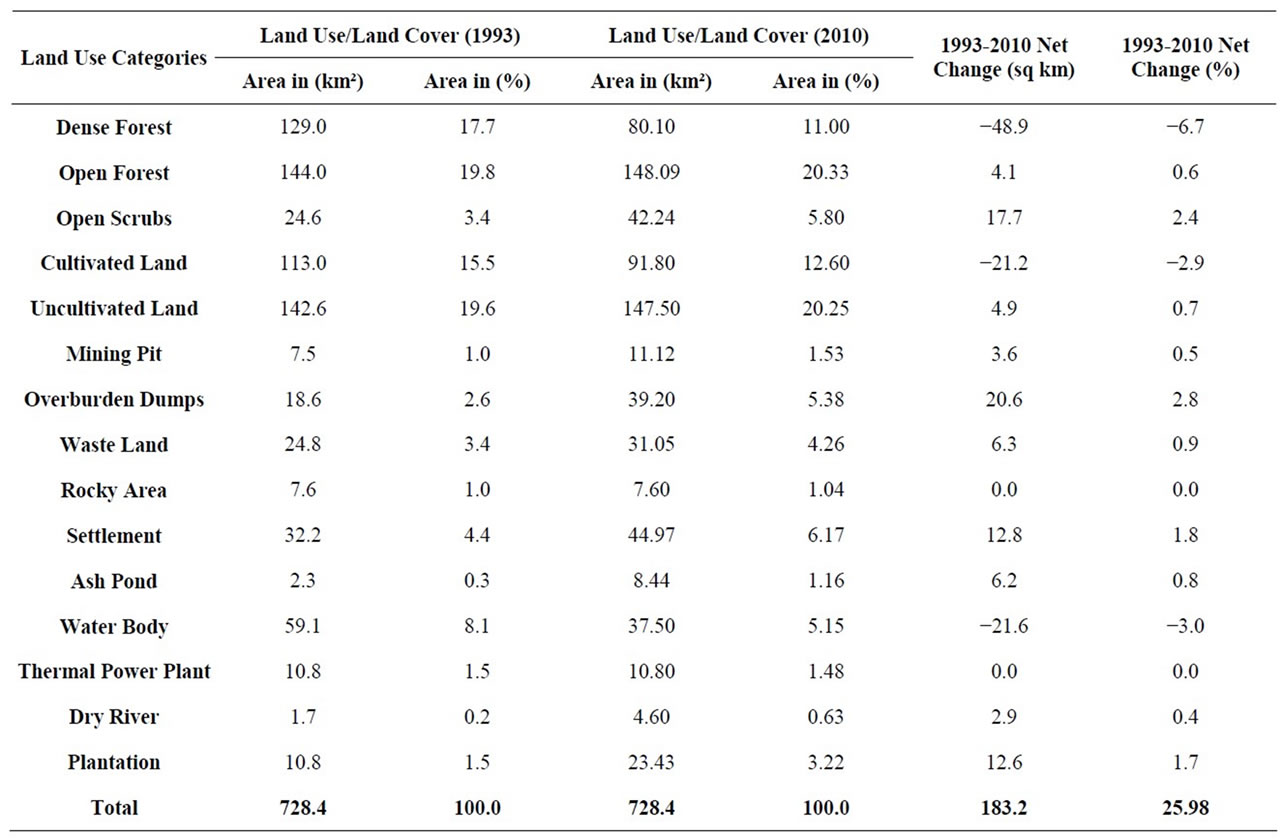
Table 1. Details of the land use/land cover changes in the study area during 1993-2010.
Jhingurdah mines. Open forest has also come up at the periphery of the G. B. Pant sagar reservoir due to drying up of water from 1993 to 2010 where natural vegetation has grown near Tusa/Sasan and Devri. Plantation increase due to the reclamation of overburden dumps under operation “Green Gold” launched by Northern Coalfield Ltd and National Thermal Power Cooperation has also carried out plantation programs around the colonies under social forestry scheme. The decline of water body by 21.6 km2 area is due to the decrease in annual rainfall, siltation caused by the material run off from dump sites and huge amount of water is utilized for industrial purpose like cooling of generators, coal washery, at coal dumps to stop dust generation. The increase in the area of overburden dumps is due to the huge removal of material from mining blocks which were dumped along the edges of the plains and form artificial landscape, which constitute 5.38% of the total area in 2010. It was estimated that the overburden dump removal increases from 100.64 M cum in 1995 to 182.1 M cum in 2010. The increase in the area of ash pond is due to the increasing power generation capacity from super thermal power station which results burning of huge quantities of coal. The fly ash generated from the thermal power plants is disposed through the pipelines in the ash pond along the boundary of the G. B. Pant Sagar Reservoir. On the basis of 1993 and 2010 satellite data analysis, it is found that 183.2 km2 (25.98%) area has changed from one land use/land cover to another land use/land cover category (Table 1).
5. Conclusion
The present study reveal that mining and industrial activities around Singrauli coal field are the main forces responsible for land use/land cover change during (1993- 2010). The mining area has increased tremendously that has resulted in degradation of dense forest, cultivated land and water bodies in the area. Due to deforestation, dense forest in the nearby mining area degrades and converts to open forest and open scrubs which are increasing in aerial extent whereas plantations at overburden dumps under reclamation schemes has been done. Settlement area has increases due to population explosion and peoples from other states come to this area for employment in mining and industrial sector. Degradation of natural resource in the area is going on due to the expansion of coal mining activities, increase in thermal power plants from two to six and other industrial activities. To prevent the enormous and uncontrolled loss of natural resources in this region, land use planning for degraded land and waste land should be implemented soon to minimize the impact. It may be concluded that the land
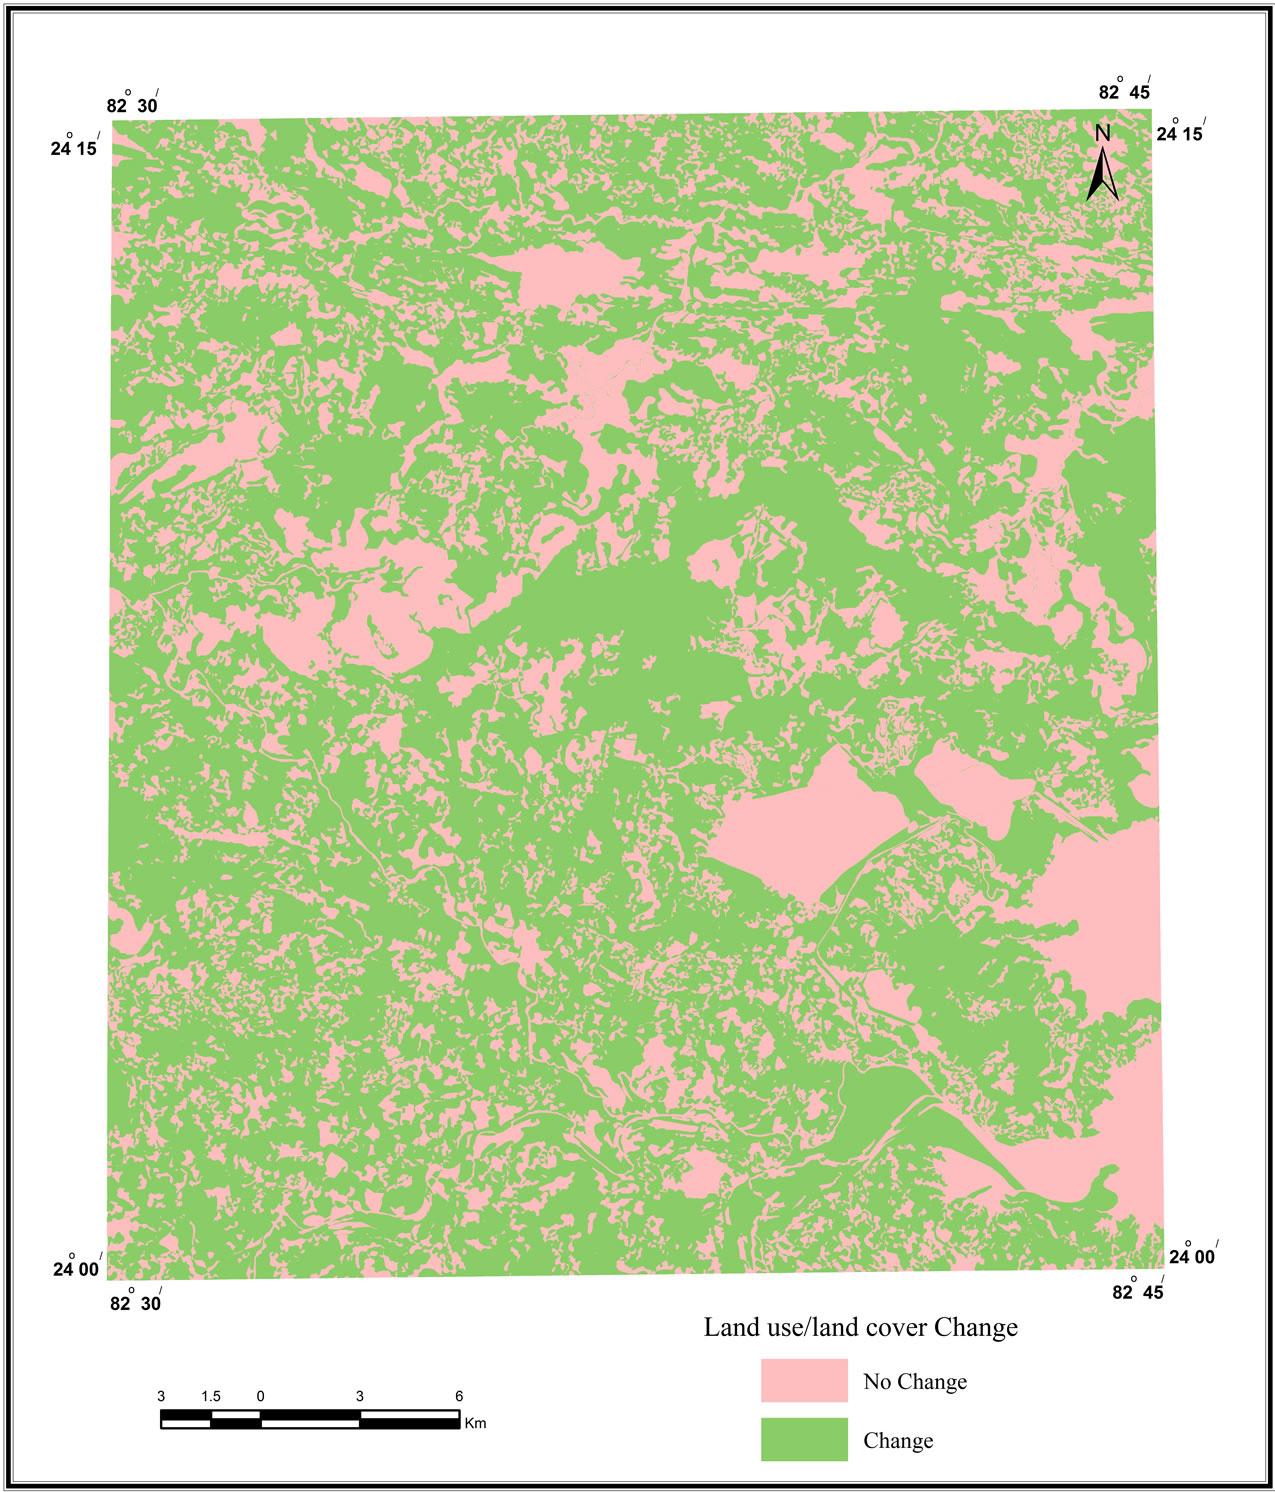
Figure 4. Change detection map (1993-2010).
use/land cover change in the Singrauli coal field has taken place due to the rapid expansion of mining and industrial activity during the period 1993 to 2001. This has resulted in the drastic changes in the land cover dynamics of the fragile ecosystem.
6. Acknowledgements
The authors are indebted to the Chairman, Department of Geology, AMU, Aligarh, for co-operation and providing necessary infrastructural facilities. Author is also grateful to University Grants Commission (UGC) for providing financial assistance under Non-NET fellowship to Ph.D. students. NRSA, Hyderabad and IMD, Pune are thankfully acknowledged for providing the data.
REFERENCES
- R. K. Tiwary, “Environmental Impact of Coal Mining on Water Regime and Its Management,” Water, Air, and Soil Pollution, Vol. 132, No. 1-2, 2001, pp. 185-199. doi:10.1023/A:1012083519667
- A. N. Singh and J. S. Singh, “Experiments on Ecological Restoration of Coal Mine Spoil Using Native Trees in a Dry Tropical Environment, India: A Synthesis,” New Forests, Vol. 31, No. 1, 2006, pp. 25-39.
- N. F. Parks, G. W. Peterson and G. M. Baumer, “High Resolution Remote Sensing of Spatially and Spectrally Complex Coal Surface Mines of Central Pennsylvania: A Comparison between SPOT, MSS and Landsat-TM,” Photogrammetric Engineering and Remote Sensing, Vol. 53, No. 4, 1987, pp. 415-420.
- C. G. Down and J. Stocks, “The Environmental Impact of Mining,” Applied Science Publisher, London, 1977.
- F. G. Bell, S. E. T. Bullock, T. F. J. Halbich and P. Lindsey, “Environmental Impact Associated with an Abandoned Mine in the Witbank Coalfield, South Africa,” International Journal of Coal Geology, Vol. 45, No. 2-3, 2001, pp. 195-216. doi:10.1016/S0166-5162(00)00033-1
- D. A. Robert, G. T. Bastitsa, S. L. G. Pereira, E. K. Walter and B. W. Nelson, “Change identification Using Multitemporal Spectral Mixture Analysis—Application in Eastern Amazonian,” In: R. S. Lunetta and C. D. Alvidge, Eds., Remote Sensing and Change Detection Environmental Monitoring Methods and Application, Sleeping Bear Press Inc., Arendal, 1998.
- A. Prakash and R. P. Gupta, “Land Use Mapping and Change Detection in a Coal Mining Area—A Case Study in the Jihar Coalfield, India,” International Journal of Remote Sensing, Vol. 19, No. 3, 1998, pp. 391-410. doi:10.1080/014311698216053
- V. M. Varghese, B. Rajan, A. P. Pradeepkumar and R. Stephen, “GIS-Based Land Use/Land Covers Change Characterization in the Humid Tropical Meenachil River Basin, Kerala South India,” Conference on Applied Geoinformatics for Society and Environment (AGSE), Arequipa, 3-6 August 2010, 6 pp.
- B.B. Dhar, A. Jamal and S. Ratan, “Air Pollution Problem in an Indian Open Cast Coal Mining Complex: A Case Study,” International Journal of Surface Mining, Reclamation and Environment, Vol. 5, No. 2, 1991, pp. 83-88. doi:10.1080/09208119108944290
- A. Manu, Y. A. Twumasi and T. L. Coleman, “Application of Remote Sensing and GIS Technologies to Assess the Impact of Surface Mining at Tarkwa, Ghana,” IEEE International IGARSS Proceedings of Geosciences and Remote Sensing Symposium, Anchorage, 20-24 September 2004.
- NRSA, “Manual of Nationwide Land Use/Land Cover Mapping Using Satellite Imagery,” National Remote Sensing Agency, Hyderabad, 1989.
- P. Du, H. Zhang, P. Liu, K. Tan and Z. Yin, “Land Use/Land Cover Change in Mining Areas Using MultiSource Remotely Sensed Imagery,” International Workshop on Analysis of Multi-Temporal Remote Sensing Images, Leuven, 18-20 July 2007, pp. 1-7. doi:10.1109/MULTITEMP.2007.4293074
- P. S. Dhinwa, S. K. Pathan, S. V. C. Sastry, M. Rao, K. L. Majumder, M. L. Chotani, J. P. Singh and R. L. P. Sinha, “Land Use Change Analysis of Bharatpur District Using GIS,” Journal of the Indian Society of Remote Sensing, Vol. 20, No. 4, 1992, pp. 237-250. doi:10.1007/BF03001921
- W.-B. Wu, J. Yao and T.-J. Kang, “Study on Land Use Change of the Coal Mining Area Based on TM Image,” Journal of Coal Science and Engineering, Vol. 14, No. 2, 2008, pp. 287-290. doi:10.1007/s12404-008-0062-9
- A. Singh, “Review Article—Digital Change Detection Techniques Using Remote Sensed Data,” International Journal of Remote Sensing, Vol. 10, No. 6, 1989, pp. 989-1003. doi:10.1080/01431168908903939
- A. Jamal, B. B. Dhar and S. Ratan, “Acid Mine Drainage Control in an Opencast Coal Mine,” Mine Water and the Environment, Vol. 10, No. 1, 1991, pp. 1-16.
- S. Majumder and K. Sarkar, “Impact of Mining and Related Activities on Physical and Cultural Environment of Singurali Coalfield—A Case Study through Application of Remote Sensing Techniques,” International Journal of Remote Sensing, Vol. 22, No. 1, 1994, pp. 45-56. doi:10.1007/BF03015119
- T. M. Lillesand and R. W. Kiefer, “Remote Sensing and Image Interpretation,” 5th Edition, John Wiley, New York, 2004.
- K. Green, D. Kempka and L. Lackley, “Using Remote Sensing to Detect and Monitor Land Cover and Land Use Changes,” Photogrammetric Engineering and Remote Sensing, Vol. 60, No. 3, 1994, pp. 331-337.
NOTES
*Corresponding author.

