Journal of Geographic Information System
Vol.4 No.3(2012), Article ID:19596,5 pages DOI:10.4236/jgis.2012.43028
Quantitative versus Qualitative Geospatial Data in Spatial Modelling and Decision Making
Division of Spatial Information Science, Graduate School of Life and Environmental Sciences, University of Tsukuba, Tsukuba, Japan
Email: kokolwin@live.com, mura@geoenv.tsukuba.ac.jp, mizutani.sis@gmail.com
Received January 5, 2012; revised March 16, 2012; accepted March 26, 2012
Keywords: Quantitative and Qualitative Geospatial Data; Spatial Modelling and Decision Making
ABSTRACT
In general, geospatial data can be divided into two formats, raster and vector formats. A raster consists of a matrix of cells where each cell contains a value representing quantitative information, such as temperature, vegetation intensity, land use/cover, elevation, etc. A vector data consists of points, lines and polygons representing location or distance or area of landscape features in graphical forms. Many raster data are derived from remote sensing techniques using sophisticated sensors by quantitative approach and many vector data are generated from GIS processes by qualitative approach. Among them, land use/cover data is frequently used in many GIS analyses and spatial modeling processes. However, proper use of quantitative and qualitative geospatial data is important in spatial modeling and decision making. In this article, we discuss common geospatial data formats, their origins and proper use in spatial modelling and decision making processes.
1. Introduction
The common forms of geospatial data presented in GIS analysis are either raster or vector. Many raster data are derived from remote sensing techniques using sophisticated sensors and many vector data are generated from GIS processes such as point data collection from field surveys, lines and polygons generated from secondary conversion of heads-up/on-screen digitizing on paper maps or high resolution satellite images. However, the Light Emitting and Ranging (LiDAR) remote sensing technique captures and stores the height in points. The most frequently used forms of raster data are land use/ cover, Digital Elevation Model (DEM), surface temperature, vegetation index, etc. These remotely sensed data are commonly known as quantitative data because they represent the actual quantity of land surface characteristics in each pixel. Among them, land use/cover data is frequently used in GIS analysis and spatial modelling. Another form of land use/cover is vector format (i.e., polygon) and this is generally converted from paper maps or heads-up/on-screen digitizing of high spatial resolution satellite images. In this approach, each polygon represents an area with the same land use properties or activeties or ownership, and this is assumed as qualitative data.
Land use/cover data (both quantitative and qualitative) are widely used in many real world applications such as natural resource management, forest types mapping, hydrological modelling, crop monitoring and precision farming in agricultural, town and city planning, transportation planning, public information services, etc. Moreover, land use/cover data is one of the primary data inputs in many spatial modelling processes. For example, hydrologists use land use/cover data to estimate the evaporation, transpiration, infiltration and surface water runoff. Researchers use land use/cover data to model and assess the influence of land cover changes by human activities, and biophysical process, e.g., deforestation, land degradation, ecosystem vulnerability, watershed conditions, and biodiversity [1-3]. Today, remotely sensed data in the form of classified land cover are used to derive input variables for a wide variety of environmental models, e.g., hydrologic-response and wild life habitat models [4,5]. Natural resources managers use land use/cover data to estimate forest, water and land resources. City and urban planners use land use/cover data to identify built-up areas inside the city. In this article, we will discuss common geospatial data formats, their origins and proper use in spatial modelling and decision making.
2. Quantitative versus Qualitative Geospatial Data
2.1. Data Formats and Origins
Raster format quantitative geospatial data are commonly derived from medium resolution remote sensing images, and vector format geospatial data is derived from high resolution aerial or satellite images by heads-up/onscreen digitizing or other GIS processes. For example, raster format land use/cover is quantitative data since the data was classified or categorized by similar spectral properties of each land category.
This process is also known as multispectral classification in remote sensing. The classification can be done either by computer (unsupervised classification) or by human (supervised classification). Supervised classification is a procedure for identifying spectrally similar areas on an image by identifying “training” sites of known targets and then extrapolating those spectral signatures to other areas of unknown targets. Supervised classification relies on the a priori knowledge of the location and identity of land cover types that are in the image. This can be achieved through field work, study of aerial photographs or other independent sources of information. Training areas, usually small and discrete compared to the full image, are used to “train” the classification algorithm to recognize land cover classes based on their spectral signatures, as found in the image. The training areas for any one land cover class need to fully represent the variability of that class within the image (Figure 1).
Data or maps generated from this quantitative approach answer the question “How much?” because of their descriptive information. In this approach, each pixel (known as spatial resolution 10 m, 20 m, 30 m, etc.) represents an actual amount or characteristic of land use/cover. Normally the generation of quantitative land use/cover is costand time-effective and it is widely used for research and scientific investigation purposes.
The vector format qualitative land use/cover data are generated from high resolution aerial photos or satellite images by heads-up/on-screen digitizing. In this approach, each land use/cover polygon is grouped by the same land-use properties, activities or ownership, the details of which are hidden (Figure 2). Moreover, the generation of qualitative land use/land cover is time, cost and labour intensive work which requires image processing, headsup/on-screen digitizing, database creation and ground truth validation. Therefore it cannot be updated frequently and is only available for urban and its surrounding areas. This qualitative data is commonly used in government and municipal offices for urban planning and policy-making. Normally this kind of land use/cover map answers “How nice or clear?” because of its qualitative approach. Therefore, the qualitative land use/cover data is suitable to use in public information services and land property assessment. Table 1 summarized the sources and generation of quantitative and qualitative land use/ cover data.
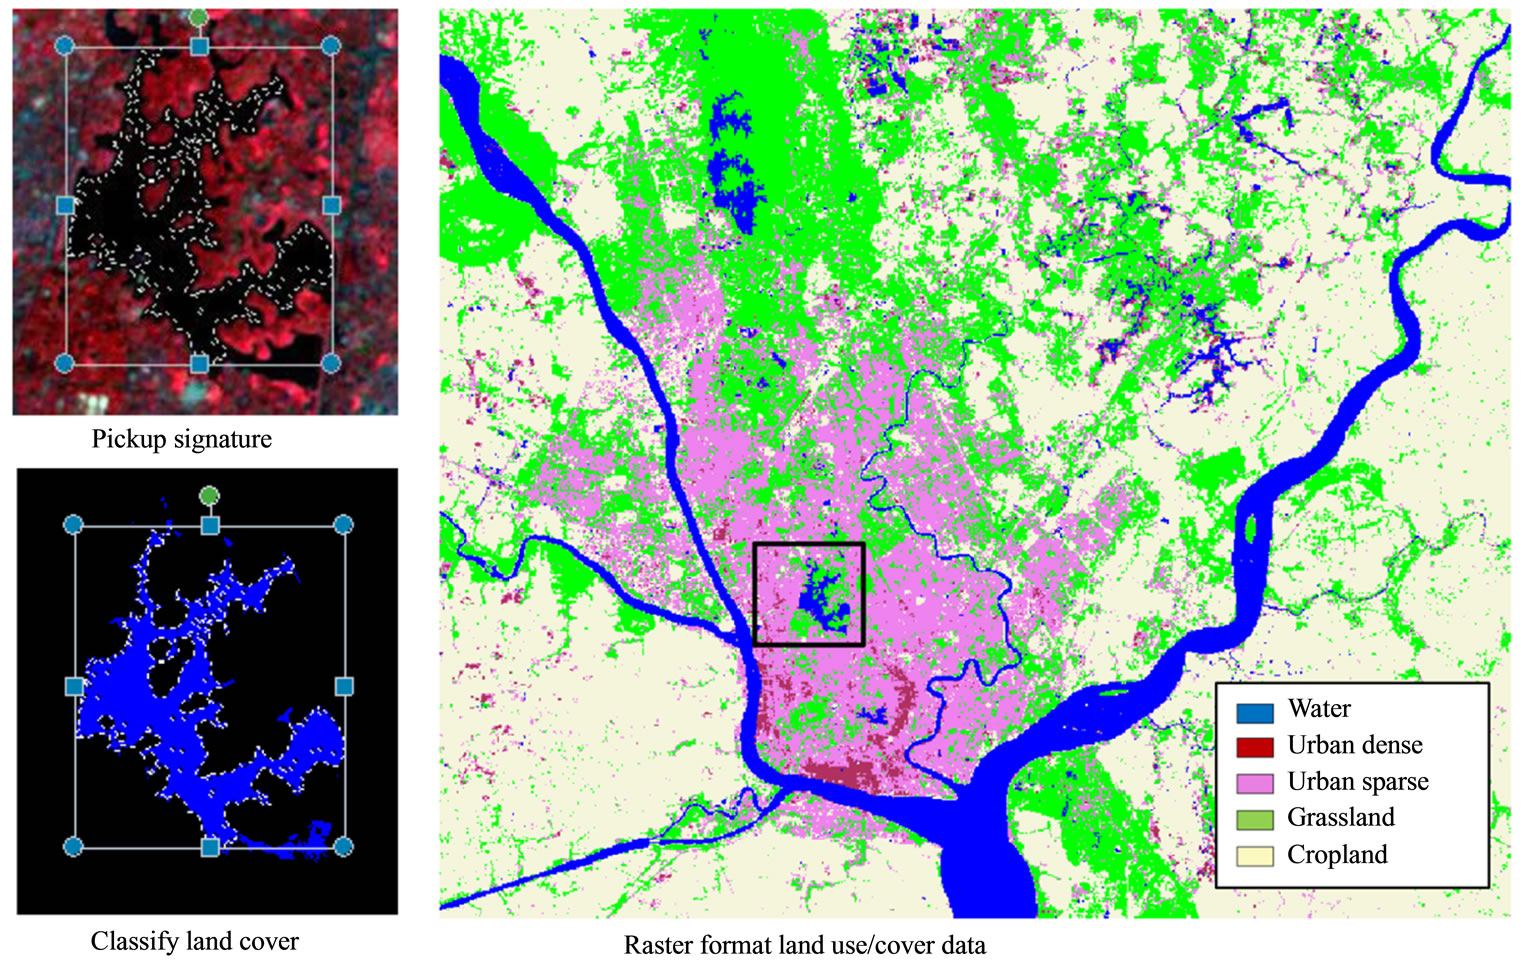
Figure 1. Quantitative land use/cover map derived from Landsat ETM+ (Enhanced Thematic Mapper).
2.2. Proper Use for Spatial Modelling and Decision Making
Raster format quantitative land use/cover data have been widely used in GIS analysis and spatial modelling formore than three decades since the availability of spaceborne remote sensing data like Landsat MSS/TM/ETM. The primary purpose of these Landsat series images is to produce thematic maps like land use/cover. Due to the descriptive information of raster format, the quantitative land use/cover data has been mainly used by scientists, researchers, hydrologists, biologists, natural resources managers and other quantitative information users. These quantitative data are suitable to use in the study of deforestation, forest types mapping, vegetation analysis, estimation of surface water run-off, etc. The quantitative land use/cover data is also good for investigation of environmental phenomena by combining additional quantitative data such as surface temperature derived from satellite images to study the spatial relationship between land use/cover and surface temperature in order to understand and visualize the urban heat island effect.
Vector format qualitative land use/cover data or maps are commonly used in the public domain due to the “neat and tidy” nature of the data, such as in city offices, municipal departments and public information centres. Moreover, from the urban planning and policy-making point of view, city planners and policy-makers might want to know how much of the land area is used for educational, industrial or public facility purposes (i.e., which areas of land are used for what purposes), rather than knowing about the descriptive information on bare lands, grasslands, urban spaces, etc. This land use can be changed at any time based on their planning and policy, and it is also very difficult to distinguish between these land categories in remote sensing data. For example, it is very difficult to distinguish between residential, Industrial or commercial land use types. Moreover, this quailtative land use/cover is useful for calculation of road surface areas for estimation of road maintenance costs or snow removal costs within the city that cannot be distinguished in remotely sensed data due to the complexity of landscape structures, such as trees shading over the roads. Table 2 summarized the quantitative and qualitative land
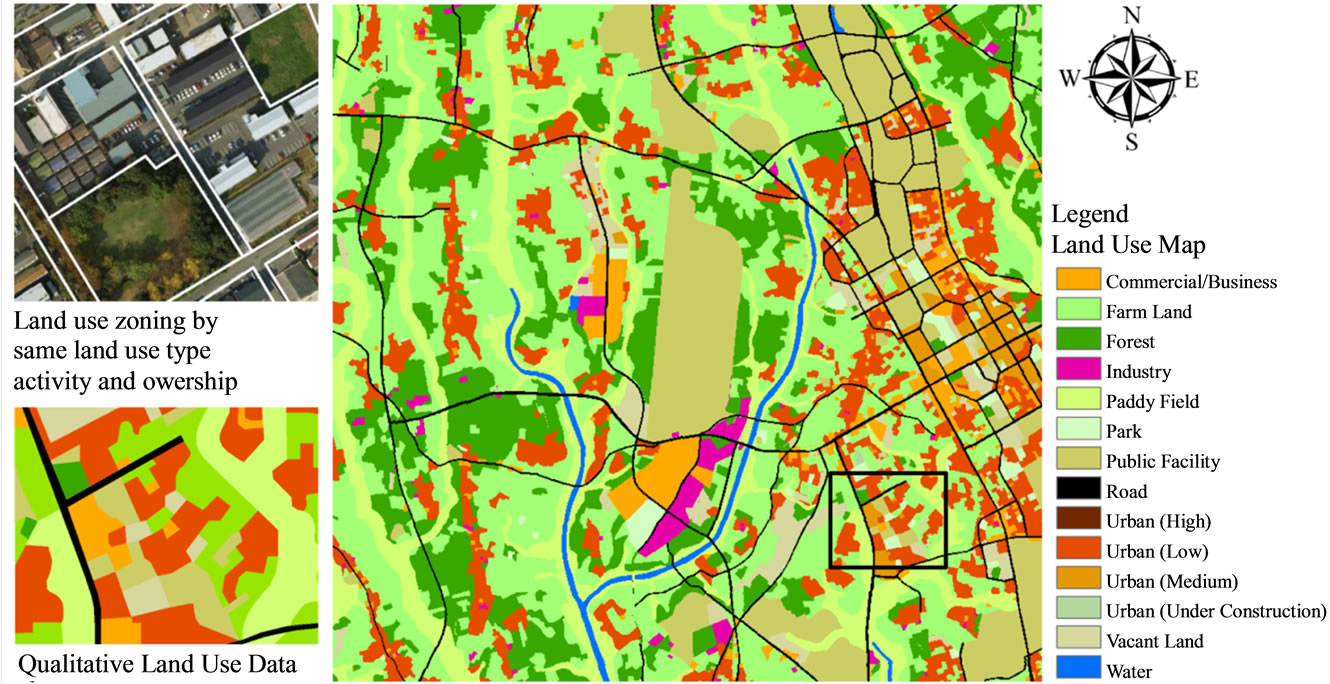
Figure 2. Qualitative land use map (Source: Geospatial Information Authority of Japan).
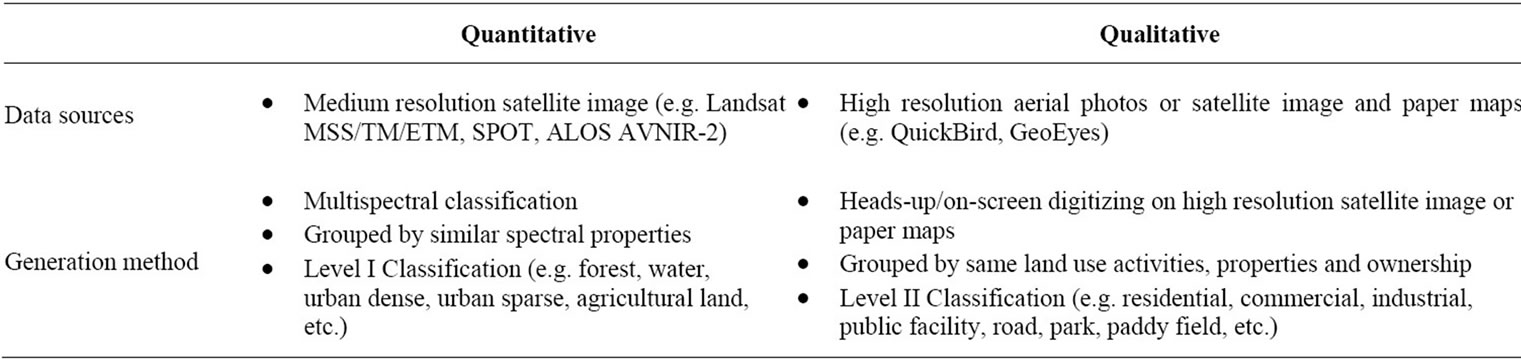
Table 1. Sources and generation of quantitative and qualitative land use/cover data.
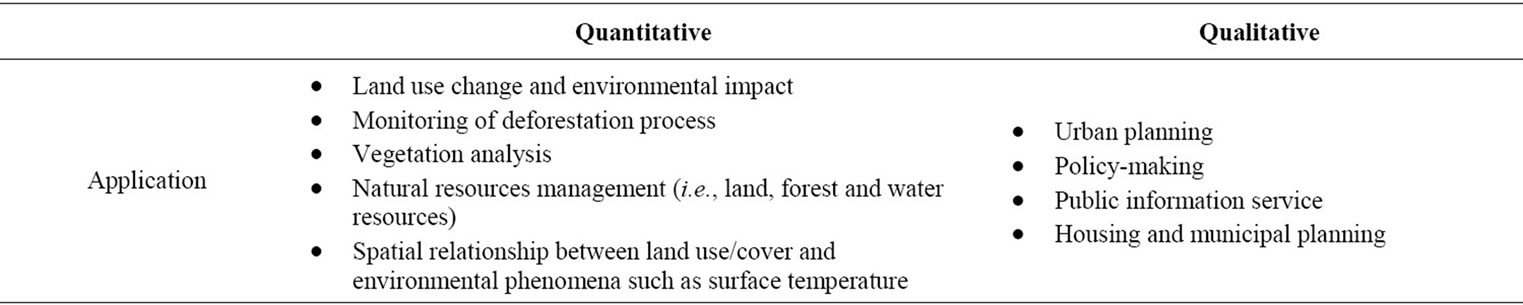
Table 2. Summary of quantitative and qualitative data used in real world applications.
use/cover data used in real world applications.
Proper uses of both quantitative and qualitative geospatial data are important in GIS analysis and spatial modelling. For example, use of quantitative data in urban planning and policy-making issues is not suitable, because urban planning cannot be done based on pixel by pixel analysis, but rather looks at land use zone by zone or within administrative boundaries. Also, the use of qualitative data in environmental studies is not a proper way to discuss environmental matters. In this case, quantitative land use data will be more appropriate, because either one or two pixels of data can have an impact on the environment, especially vegetation, water, bare land, grassland and forest pixels. However, a combination of quantitative and qualitative data is sometimes required, for example, to address environmental issues in the urban planning process. In order to build an eco-city, for example, urban planners are required to identify green spaces inside the city and then take into an account in their urban planning processes.
From a real-world applications point of view, GIS based vector data alone cannot solve some spatial problems, especially in environmental issues that include difficulties in determining where the green spaces are, how much of an area is forested, how much surface water there is, etc. This is because the GIS based vector data represent the world in a graphical form (i.e., roads are represented as lines, buildings are represented as polygons, bus stands are represented as points and so on). In this representation scheme, geographic means “geo” plus “graphic,” and, therefore, we can easily construct a database for these graphics and manipulate them. Therefore, GIS is a powerful tool to solve spatial problems. In contrast, remote sensing technology frequently referred to as geoinformatics, use sensors and capture the world as real information. However, due to the complex nature of the landscape and the thousands of millions of pixels needed to describe landscapes, it is difficult to construct a database that could be used to extract information from the pixels. By integrating the remote sensing and GIS information, we can benefit spatial information users not only by enhancing their graphical processing, but also by enabling the processing of real-world information. For example, to identify the shortest or greenest path, analysis in GIS is required to combine vegetation data derived from remote sensing data and the GIS road network data model [6].
Although many studies have used analysis of quantitative land use changes (i.e., raster format) such as land use change modelling, monitoring of deforestation processes, vegetation changes analysis, urban expansion, etc., there are only a few studies on qualitative change analysis (i.e., vector format). For example, some scholars have developed spatiotemporal analytical methods for vector format change analysis by introducing concepts and indices such as the intersection concept, polygon events of generation and disappearance, expansion, shrinkage, union and division, Stability Index (SI) and Compactness [7- 10]. These methods are focused on the qualitative attribute and changed in feature geometric characteristics which improved the understanding of land use change processes in urban planning and policy making.
3. Conclusion
Quantitative and qualitative land use/land cover data are widely used in spatial modelling such as land use change analysis, hydrological modelling, health and environment, ecological modelling, city and town planning, public facility management and so on. Raster based Remote Sensing technology provides real world information in quantitative approach and while Geographic Information Systems (GIS) provides theory and methods that have the potential to facilitate the development of spatial analyticcal functions and various GIS data models. However, correct use of land use/land cover data format in spatial modelling is important for proper decision making. This article aims to discuss formats of land use/cover, their origin and the proper use for spatial modelling and the decision making process in real world applications.
4. Acknowledgements
This research is supported by the Japan Society for the Promotion of Science JSPS under the Grant-in-Aid for Scientific Research projects of “Systematization of fieldwork methodology: A study on capture, management, analysis and circulation of geographical data” [11] and “Population estimation of rapidly growing cities in Southeast Asia using GIS/RS” [12].
REFERENCES
- K. K. Lwin and R. Shibasaki, “Monitoring and Analysis of Deforestation Process Using Remote Sensing and GIS: A Case Study in Myanmar,” 19th Asian Conference on Remote Sensing (ACRS), Manila, Philippines, 1998.
- A. Guisan and N. E. Zimmermann, “Predictive Habitat Distribution Models in Ecology,” Ecological Modeling, Vol. 135, No. 2-3, 2000, pp. 147-186. doi:10.1016/S0304-3800(00)00354-9
- J. M. Scott, F. Davis, B. Csuti, R. Noss, B. butterfield, C. Groves, H. Anderson, S. Caicco, F. D’Erchia, T. C. Edwards Jr., J. Ulliman and G. Wright, “Gap Analysis: A Geographic Approach to Protection of Biodiversity,” Wildlife Monographs, Vol. 123, 1993, pp. 1-41.
- T. C. Edwards Jr., E. Deshler, D. Foster and G. G. Moisen, “Adequacy of Wildlife Habitat Relation Models for Estimating Spatial Distributions of Terrestrial Vertebrates,” Conservation Biology, Vol. 10, No. 1, 1996, pp. 263-270. doi:10.1046/j.1523-1739.1996.10010263.x
- S. N. Miller, D. J. Semmens, D. C. Goodrich, M. Hernandez, R. C. Miller, W. G. Kepner and D. P. Guertin, “The Automated Geospatial Watershed Assessment Tool,” Environmental Modeling and Software, Vol. 22, No. 3, 2007, pp. 365-377. doi:10.1016/j.envsoft.2005.12.004
- K. K. Lwin and Y. Murayama, “Modelling of Urban Green Space Walkability: Eco-Friendly Walk Score Calculator,” Computers, Environment and Urban Systems, Vol. 35, No. 5, 2011, pp. 408-420. doi:10.1016/j.compenvurbsys.2011.05.002
- Y. Sadahiro and M. Umemura, “A Computational Approach for the Analysis of Changes in Polygon Distributions,” Journal of Geographical Systems, Vol. 3, No. 2, 2001, pp. 137-154. doi:10.1007/PL00011471
- C. Robertson, T. Nelson, B. Boots and M. Wulder, “STAMP: Spatial-Temporal Analysis of Moving Polygons,” Journal of Geographical Systems, Vol. 9, No. 3, 2007, pp. 207-227. doi:10.1007/s10109-007-0044-2
- Y. Xie and X. Ye, “Comparative Tempo-Spatial Pattern Analysis: CTSPA,” International Journal of Geographic Information Science, Vol. 21, No. 1, 2007, pp. 49-69. doi:10.1080/13658810600894265
- C. Mizutani, “Construction of an Analytical Framework for Polygon-Based Land Use Transition Analyses,” Computers, Environment and Urban Systems, Vol. 36, No. 3, 2012, pp. 270-280. doi:10.1016/j.compenvurbsys.2011.11.004
- Y. Murayama, “Systematization of Fieldwork Methodology: A Study on Capture, Management, Analysis and Circulation of Geographical Data,” Grant-in-Aid for Scientific Research A, JSPS, 2010.
- Y. Murayama and K. K. Lwin, “Population Estimation of Rapidly Growing Cities in Southeast Asia Using GIS/ RS,” Grant-in-Aid for Scientific Research, JSPS, 2010.