Natural Science
Vol.5 No.12(2013), Article ID:41304,9 pages DOI:10.4236/ns.2013.512153
Measurement of dust emission from a road construction using exposure-profiling method
![]()
Department of Civil, Environmental and Natural Resources, Division of Soil Mechanics and Foundation Engineering, Luleå, Sweden; qijia@ltu.se, nadhir.alansari@ltu.se, Sven.Knutsson@ltu.se
Copyright © 2013 Jia Qi et al. This is an open access article distributed under the Creative Commons Attribution License, which permits unrestricted use, distribution, and reproduction in any medium, provided the original work is properly cited. In accordance of the Creative Commons Attribution License all Copyrights © 2013 are reserved for SCIRP and the owner of the intellectual property Jia Qi et al. All Copyright © 2013 are guarded by law and by SCIRP as a guardian.
Received 15 November 2013; revised 15 December 2013; accepted 22 December 2013
Keywords: Dust Emission; Road Construction; Exposure-Profiling; BSNE
ABSTRACT
Road construction is one example of heavy constructions that may have a substantial temporary impact on local air quality. Construction of Luleå Road during the summer of 2013 generated a great deal of dust emission. US EPA recommended exposure-profiling method was used to measure dust emission. Inexpensive BSNE dust samplers were used instead of high volume samplers. The objective was to give a general idea of the amount of dust generated due to the construction work. Dust generation related to weather was discussed under conditions. Estimated threshold wind velocities for road surface materials at the height of 2 m were 12.88 m/s, 12.88 m/s and 24.76 m/s which were lower measured wind velocities, indicating no dust generated from wind erosion. Dust masses for 7 sampling periods show dust generation had a close relation with moisture content of surface material. Wind speed, humidity had minor or no effect. The estimated dust emission rate in the construction work during the measuring period was 22.86 kg TSP/d, 6 kg/d was from construction work and 16.86 kg/d was generated due to traffic on temporary roads.
1. INTRODUCTION
The WRAP Dust Emission Joint Forum (DEJF) presented a definition of dust. Dust is defined as “particulate matter (PM) which is or can be suspended into the atmosphere by mechanical, explosive, or windblown suspension of geologic, organic, synthetic, or dissolved solids, and does not include non-geologic particulate matter emitted directly by an internal and external combustion process” [1]. Road construction is one example of heavy constructions that may have a substantial temporary impact on local air quality. During a heavy construction, dust emissions are released into the air by several activities: equipment movement on unpaved surfaces, cut and fill operations, excavation activities, crushing, land clearing, wind erosion of soil exposed by construction activities, etc. Dust emission from construction differs from other dust sources because of the temporary nature of the construction period. Dust emissions from any single construction site have a definable beginning and ending, and vary substantially over different phased of the construction process [2]. The quantity of dust emissions from construction operations is proportionally influenced by the area of land being worked and to the level of construction activity. Emissions from heavy construction operations are positively correlated to the silt content of the soil (that is, particles smaller than 75 micrometers [µm] in diameter), as well as with the speed and weight of the average vehicle, and are negatively correlated to the soil moisture content.
Estimation and quantity of dust emission are important and help environmental decision makers to permit a new heavy construction work. In Sweden, most of the studies and regulations regarding particulate pollution are emissions from internal and external combustions and fine particulate matters (PM) [3-5]. Suspended particulate matters from construction work have a substantial visible adverse effect on the air quality during the ongoing construction activities. It causes reduced air visibility and health problems, and thus has to be quantified so that it could be used as one of the foundations of environmental assessment. Some works have been done in Sweden regarding road dust suppressants [6], road sources and properties [7], and impact on air quality due to construction dust [4]. Studies have rarely been focused on quantification of dust generation from sources due to difficulties on defining a dust cloud and many uncontrollable affecting factors during construction works.
![]() Since 1972, US EPA has been publishing and improving dust emission factors for various source categories by a number of filed measurements. An emission factor is a representative value that relates the quantity of a pollutant released into the atmosphere with the source activity, and the amount of generated emission can be estimated by the emission factor. An approximate emission factor for construction operations is 1.2 ton/acre/month of activity [2]. The value is based on the field measurement of total suspended particulate (TSP) concentrations, and is an overall estimation. Later, Midwest Research Institute [8] proposed an equation to estimate dust emission from heavy construction in the following form:
Since 1972, US EPA has been publishing and improving dust emission factors for various source categories by a number of filed measurements. An emission factor is a representative value that relates the quantity of a pollutant released into the atmosphere with the source activity, and the amount of generated emission can be estimated by the emission factor. An approximate emission factor for construction operations is 1.2 ton/acre/month of activity [2]. The value is based on the field measurement of total suspended particulate (TSP) concentrations, and is an overall estimation. Later, Midwest Research Institute [8] proposed an equation to estimate dust emission from heavy construction in the following form:
 (1)
(1)
where: M = miles of new roadway construction f = miles to acre conversion factor d = duration of roadway construction Exposure-profiling method is one of the methods that US EPA has used to establish dust emission factors from heavy constructions [9]. The method is described in some literatures [10-12], and has also been used by other researchers [13-15]. The method measures the passage of airborne particulate matter immediately downwind from the source. The measurement is done by a simultaneous, multipoint sampling of particulate concentration over the effective cross section of the dust cloud. The ambient wind is the force to direct the dust cloud into the sampling array. The dust emission rate is obtained by a spatial integration of the distributed measurement of accumulated mass. In this study exposure-profiling method was used to estimate the dust amount generated from a phase of a road construction process. The threshold wind velocities for the road materials were estimated. Dust generation was discussed relating to weather conditions.
2. STUDY AREA
Lulea road is the entrance to the World Heritage in the church villiage, Vanhankaupunginlahti. The road crosses the railway near Lulea intermodal terminal and currently the passage is regulated with signals and barriers. The railway is busy and shunting movements from the intermodal terminal charged junction further. This leads to major safety and mobility problems for road traffic through the area as well as being a barrier to rail transport development. For these reasons, started in January 2013 a road bridge has been under construction over the railway line for cars with separated pedestrian and bicycle path. The construction will end in September 2014 [10]. During June, July, August when the weather is warm and dry, dust emission is a major environmental problem. Figure 1 shows a map of the construction. The dust measurement was done for the period of 2013-08-05 to 2013-09- 13. During the measuring period, the road to the bridge was under construction.
3. MATERAILS AND METHODS
Desiccated sediments in any environment can produce dust. Transport of sediment by natural wind is governed by turbulence, coherent structures, aerodynamic roughness etc. This requires reliable measurement of both sediment flux and wind velocity in the harsh environment of particle-laden flow. In this research, the BSNE sampler [17] was used to measure horizontal sediment transport at different heights. Meteorological conditions during the test period were also monitored. The method used for the measurement was the exposure-profiling method.
3.1. Big Spring Number Eight Sampler
Big spring number eight (BSNE) sampler was designed by Fryrear [17]. Because it is a passive sampler and requires no power supply, it is cheap and widely used in field experiments. By far it is the most popular passive sampler in aeolian research [18].
Figure 2 shows a picture and the design of BSNE sampler. The sampler is constructed of 28-gauge galvanized metal, galvanized 18-mesh screen, and stainless steel 60-mesh screen. Dust-laden air enters through the opening, which has an area of 20 × 50 mm2, and discharges through the 60-mesh screen. The air speed is slowed down inside the sampler because of enlarged space and it allows the dust to settle in the collection pan. The 18-mesh screen helps to reduce the breakdown of deposited material and loss of very fine particles by reducing the movement of collected material. A wind vane attached at the rear allows the opening to face into wind direction.
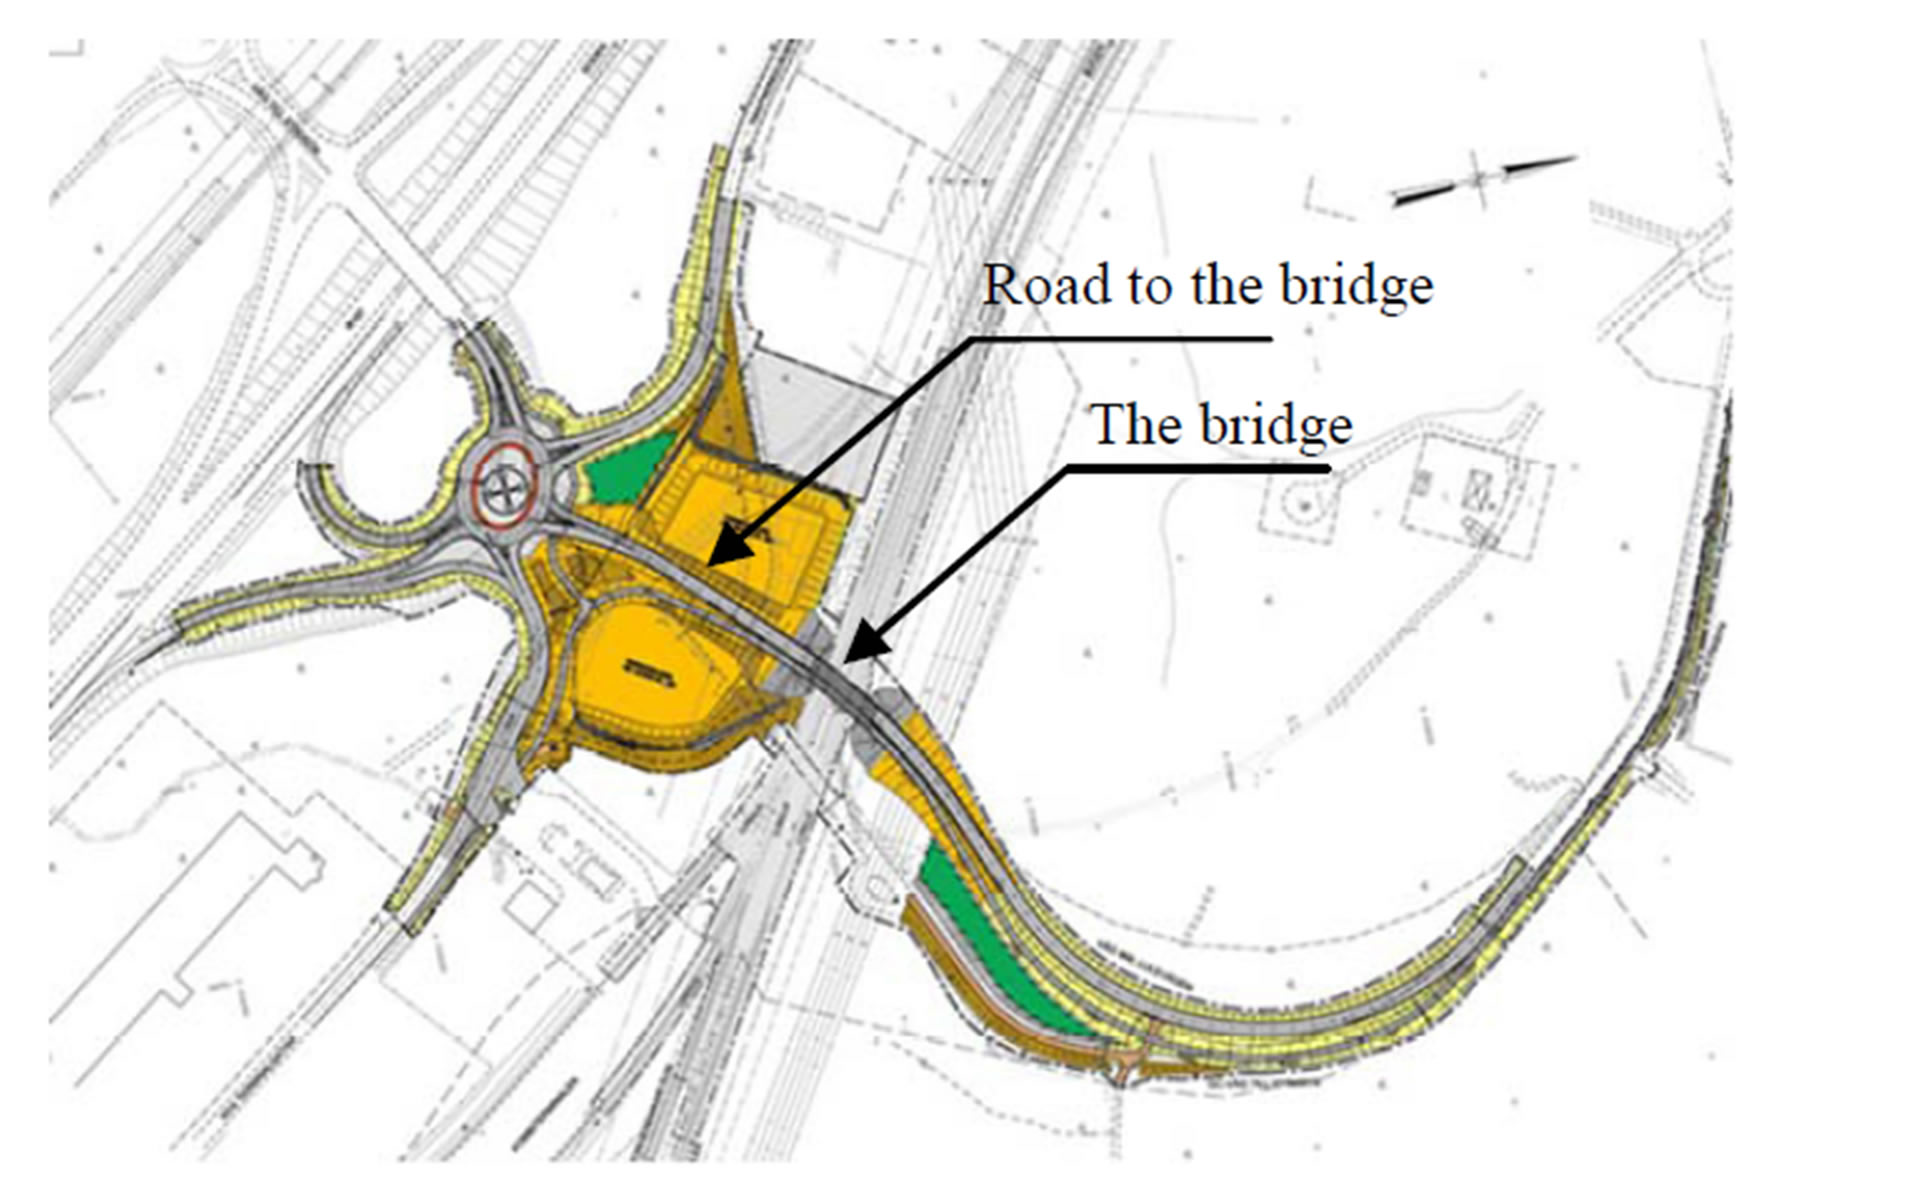
Figure 1. Map of the construction site [16].
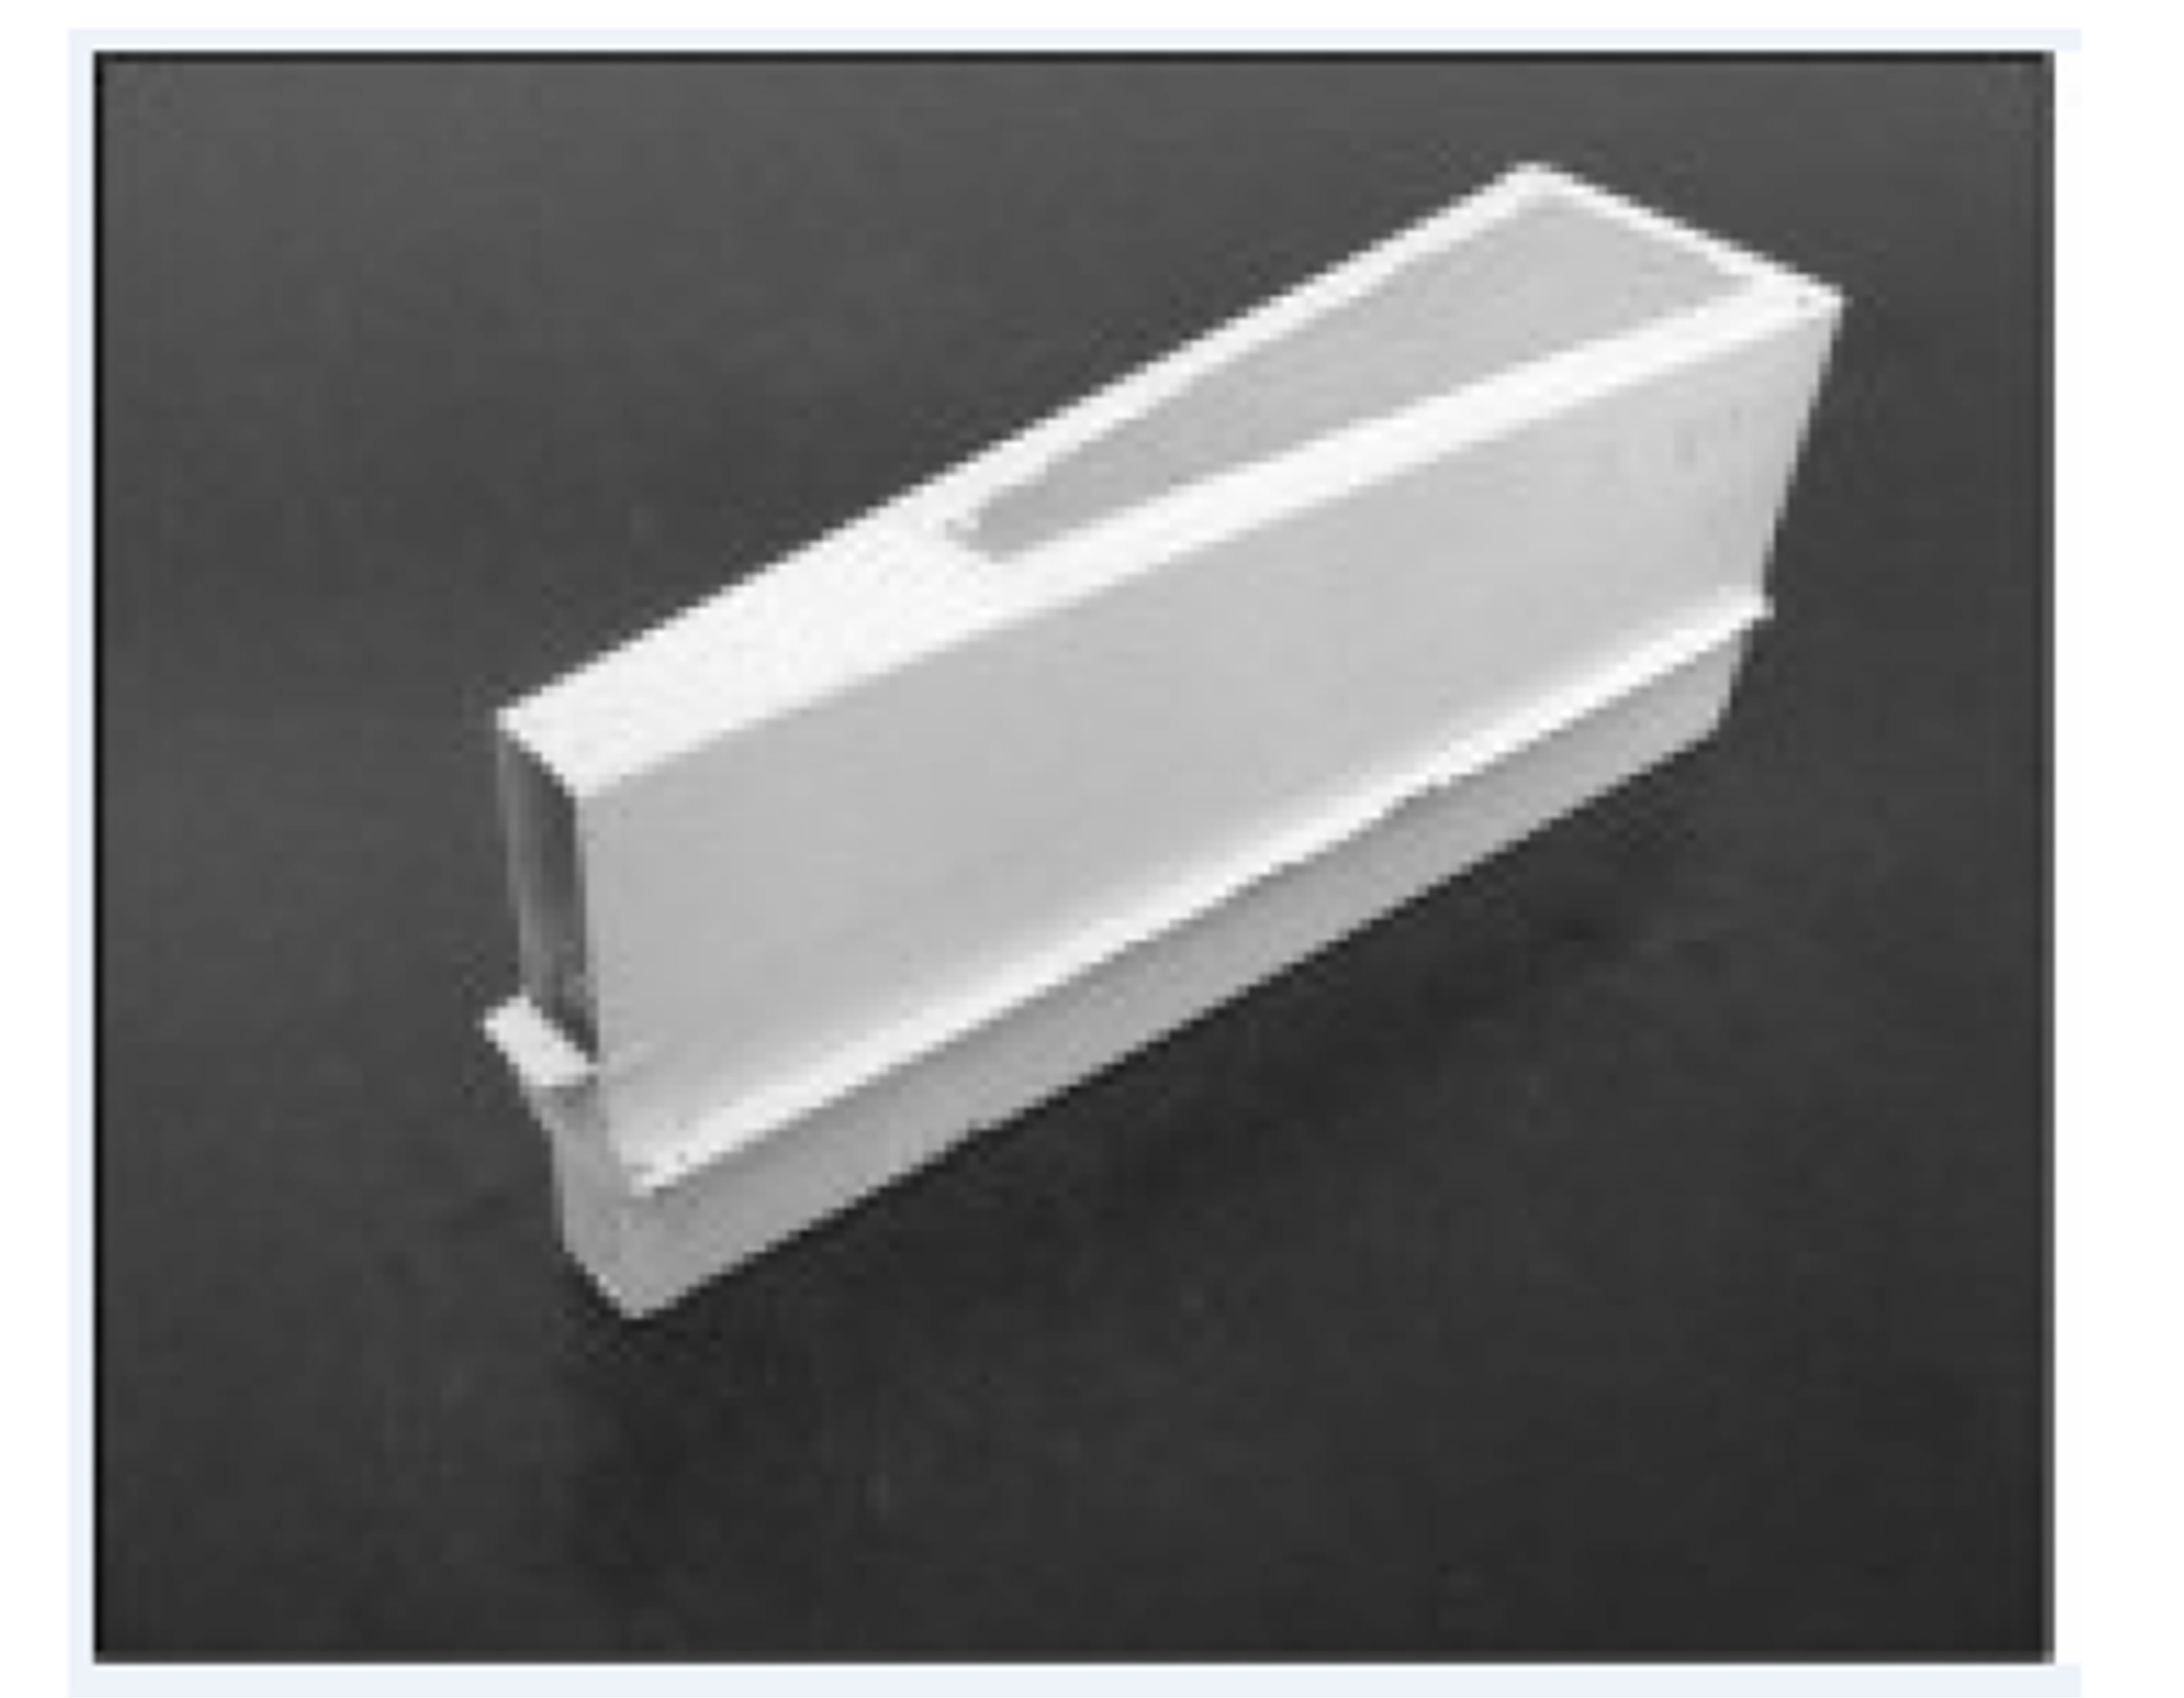
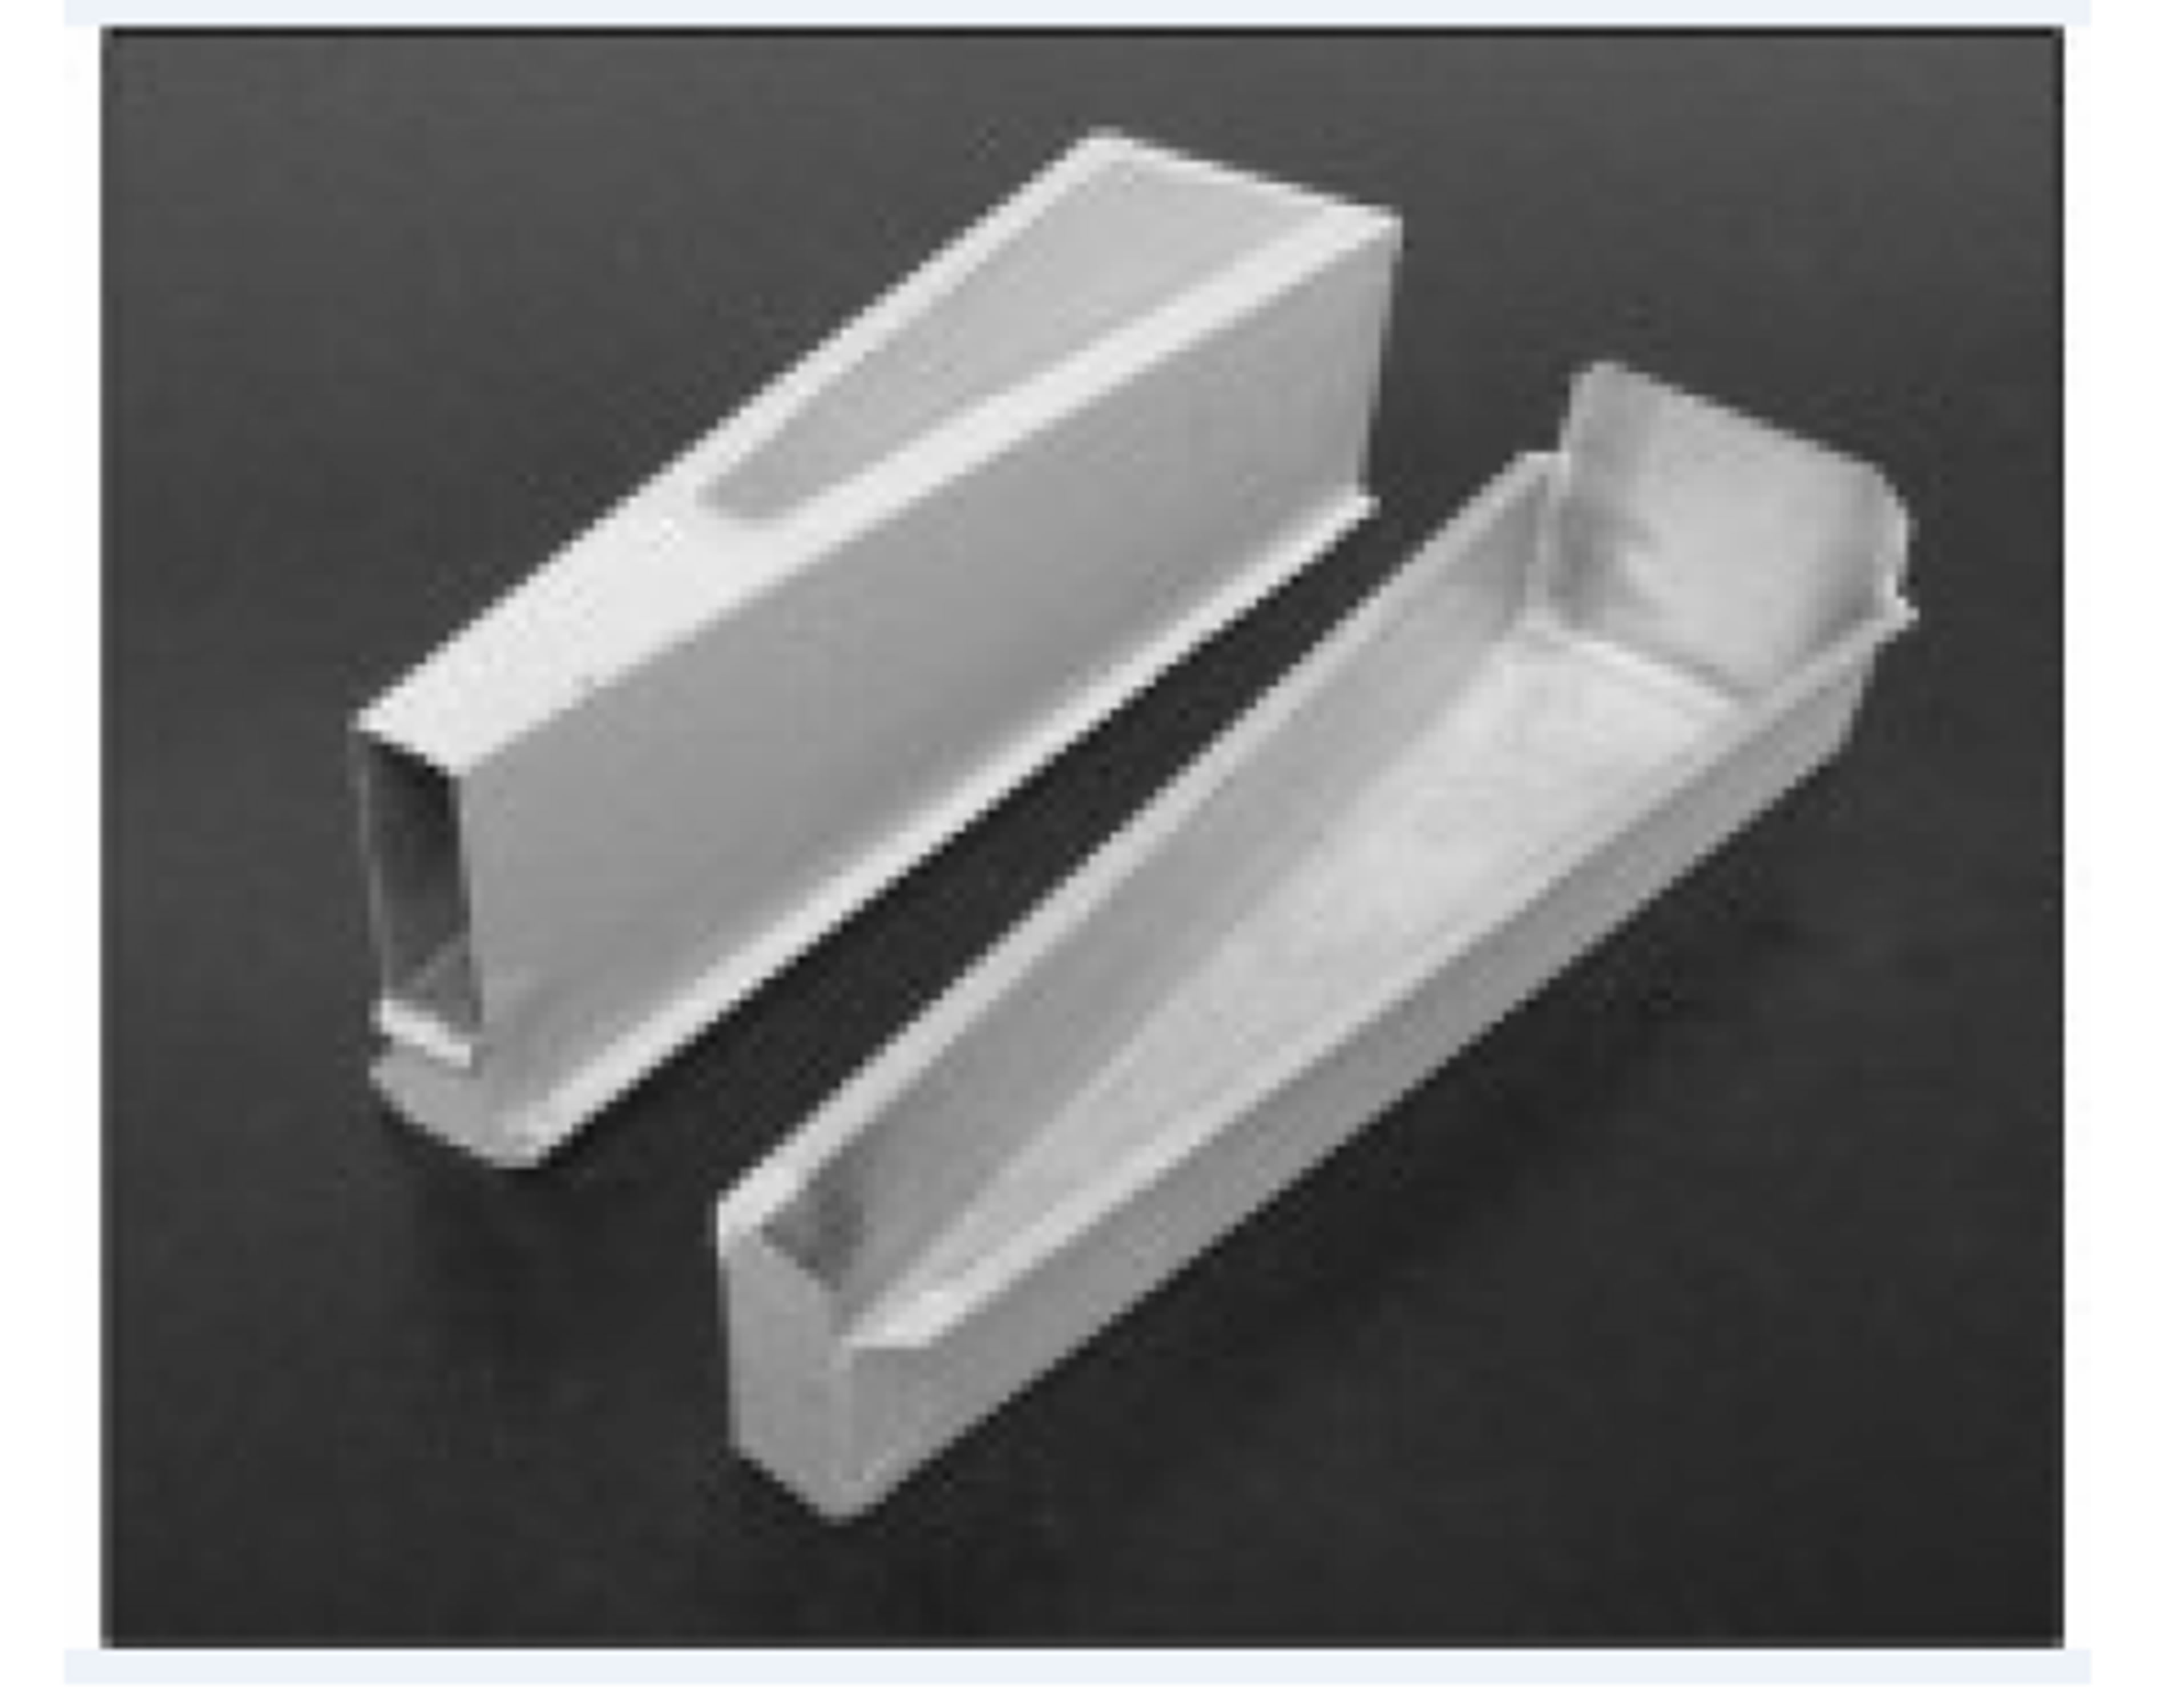
Figure 2. The BSNE sampler. Up: closed sampler. Down: opened sampler [18].
BSNE sampler is very robust and able to collect a large amount of sediments, up to tens of grams or more [18]. The flow speed near through the opening is only about 5% lower than that of undisturbed flow, and thus can be considered approximately isokinetic [19]. Efficiency of BSNE has been studied by [17], Stout and Fryrear [20], Shao et al. [19], Goossens and Offer [21], Goossens et al. [22], Sharrat et al. [23], Sharrat [24] and Goossens and Buck [18], for a wide range of wind velocity and grain size. Most of them came into the similar conclusion. The efficiency of BSNE decreases with decreasing particle size because fine grains easily follow the slight wind deflection at the sampler opening. Another reason is fine particles are prone to escape from the meshes where the inflow gets out of the sampler. For coarse grains, the efficiency is rather high. Goosseens and Offer [21] measured the overall efficiency between 86% - 96% for sand, and about 40% for 30 µm particle. Goossens and Buck [18] used efficiency of 17.5% for PM10 which is the average of Sharrat et al.’s [23] measurement between 10% and 25%. In this research, the efficiencies which used to correct the measurement are: 90% for particles > 30 µm, 40% for particles between 30 µm and 10 µm, and 17.5 for PM10. Also, researchers have noticed a slight decrease in efficiency due to increasing weed speed and this slight decrease can be neglected.
3.2. Experiment Layout
The measurement was done by exposure-profiling method and the collected dust particles were TSP. The method measures the passage of airborne particulate matter immediately downwind from the source by simultaneous, multipoint sampling of particulate concentration over the effective cross section of the dust cloud. The construction work on the road to the bridge was considered as the source of dust emission during the measurement period 2013-08-05 to 2013-09-13 (see the measuring area in Figures 3 and 4). The measurement only measured dust from construction work, and did not include dust generated due to traffic travelling on temporary roads. The construction work was divided into three phases during the measurement period. In phase 1, the road surface had the finest surface material (layer 1 in Table 1). In phase 2 and 3, the road was layered with coarser and coarser materials (layers 2 & 3 in Table 1). BSNEs were placed directly downwind of the source. The samplers should be installed vertically at different heights, as well as horizontally at different distances in order to effectively cover the cross section of the dust cloud. Five BSNEs were placed at the height of 0.5 meters above of ground surface linearly over the width of the dust cloud. The BSNEs were marked with a, b, c, g, and h. Due to the limitation on the number of samplers only the BSNE in the middle of the 5 BSNES (which is sampler c) was installed with 3 more BSNEs above with heights of 1.25 m, 2 m, and 2.75 m, and they were marked with d, e and f. During the period of 2013-08-05 to 2013-08-12 the samplers were placed Southwest-West to the source, and thus wind from Northeast-East was demanded to direct the dust into the collectors. The distance between the sampler a, b, c, g, and h were 11 m, 9.4 m, 14.6 m, and 7.9 m (Figure 3). For some reasons that installation of the samplers was in conflict with the construction works, during the period of 2013-08-19 to 2013-09-13 the samplers had to be moved to South-Southeast to the source, and therefore the wind from North-Northwest was required to direct the dust into the collectors. The distance between the sampler a, b, c, g, and h were 18.7 m, 32 m, 20.5 m, and 29.10 m (Figure 4). A weather station was also installed at the height of 2 m to monitor the weather condition. It was assumed that the collectors had zero collections when the wind direction was biased more than 45 degrees to the both sides of the demanded wind direction. Wind erosion of the road surface material was disregarded, and dust generation was only due to mechanical force of construction works. Table 1 shows the dust sampling dates and the corresponding road surface layers. The road surface materials were also sampled for particle size analysis and moisture content. Since the experiment measured the dust emission from the same sources the collected data should be comparable no matter the collector were at Southwest-West to the source (Figure 3) or South-Southeast to the source (Figure 4). Important thing is that different wind directions were re-
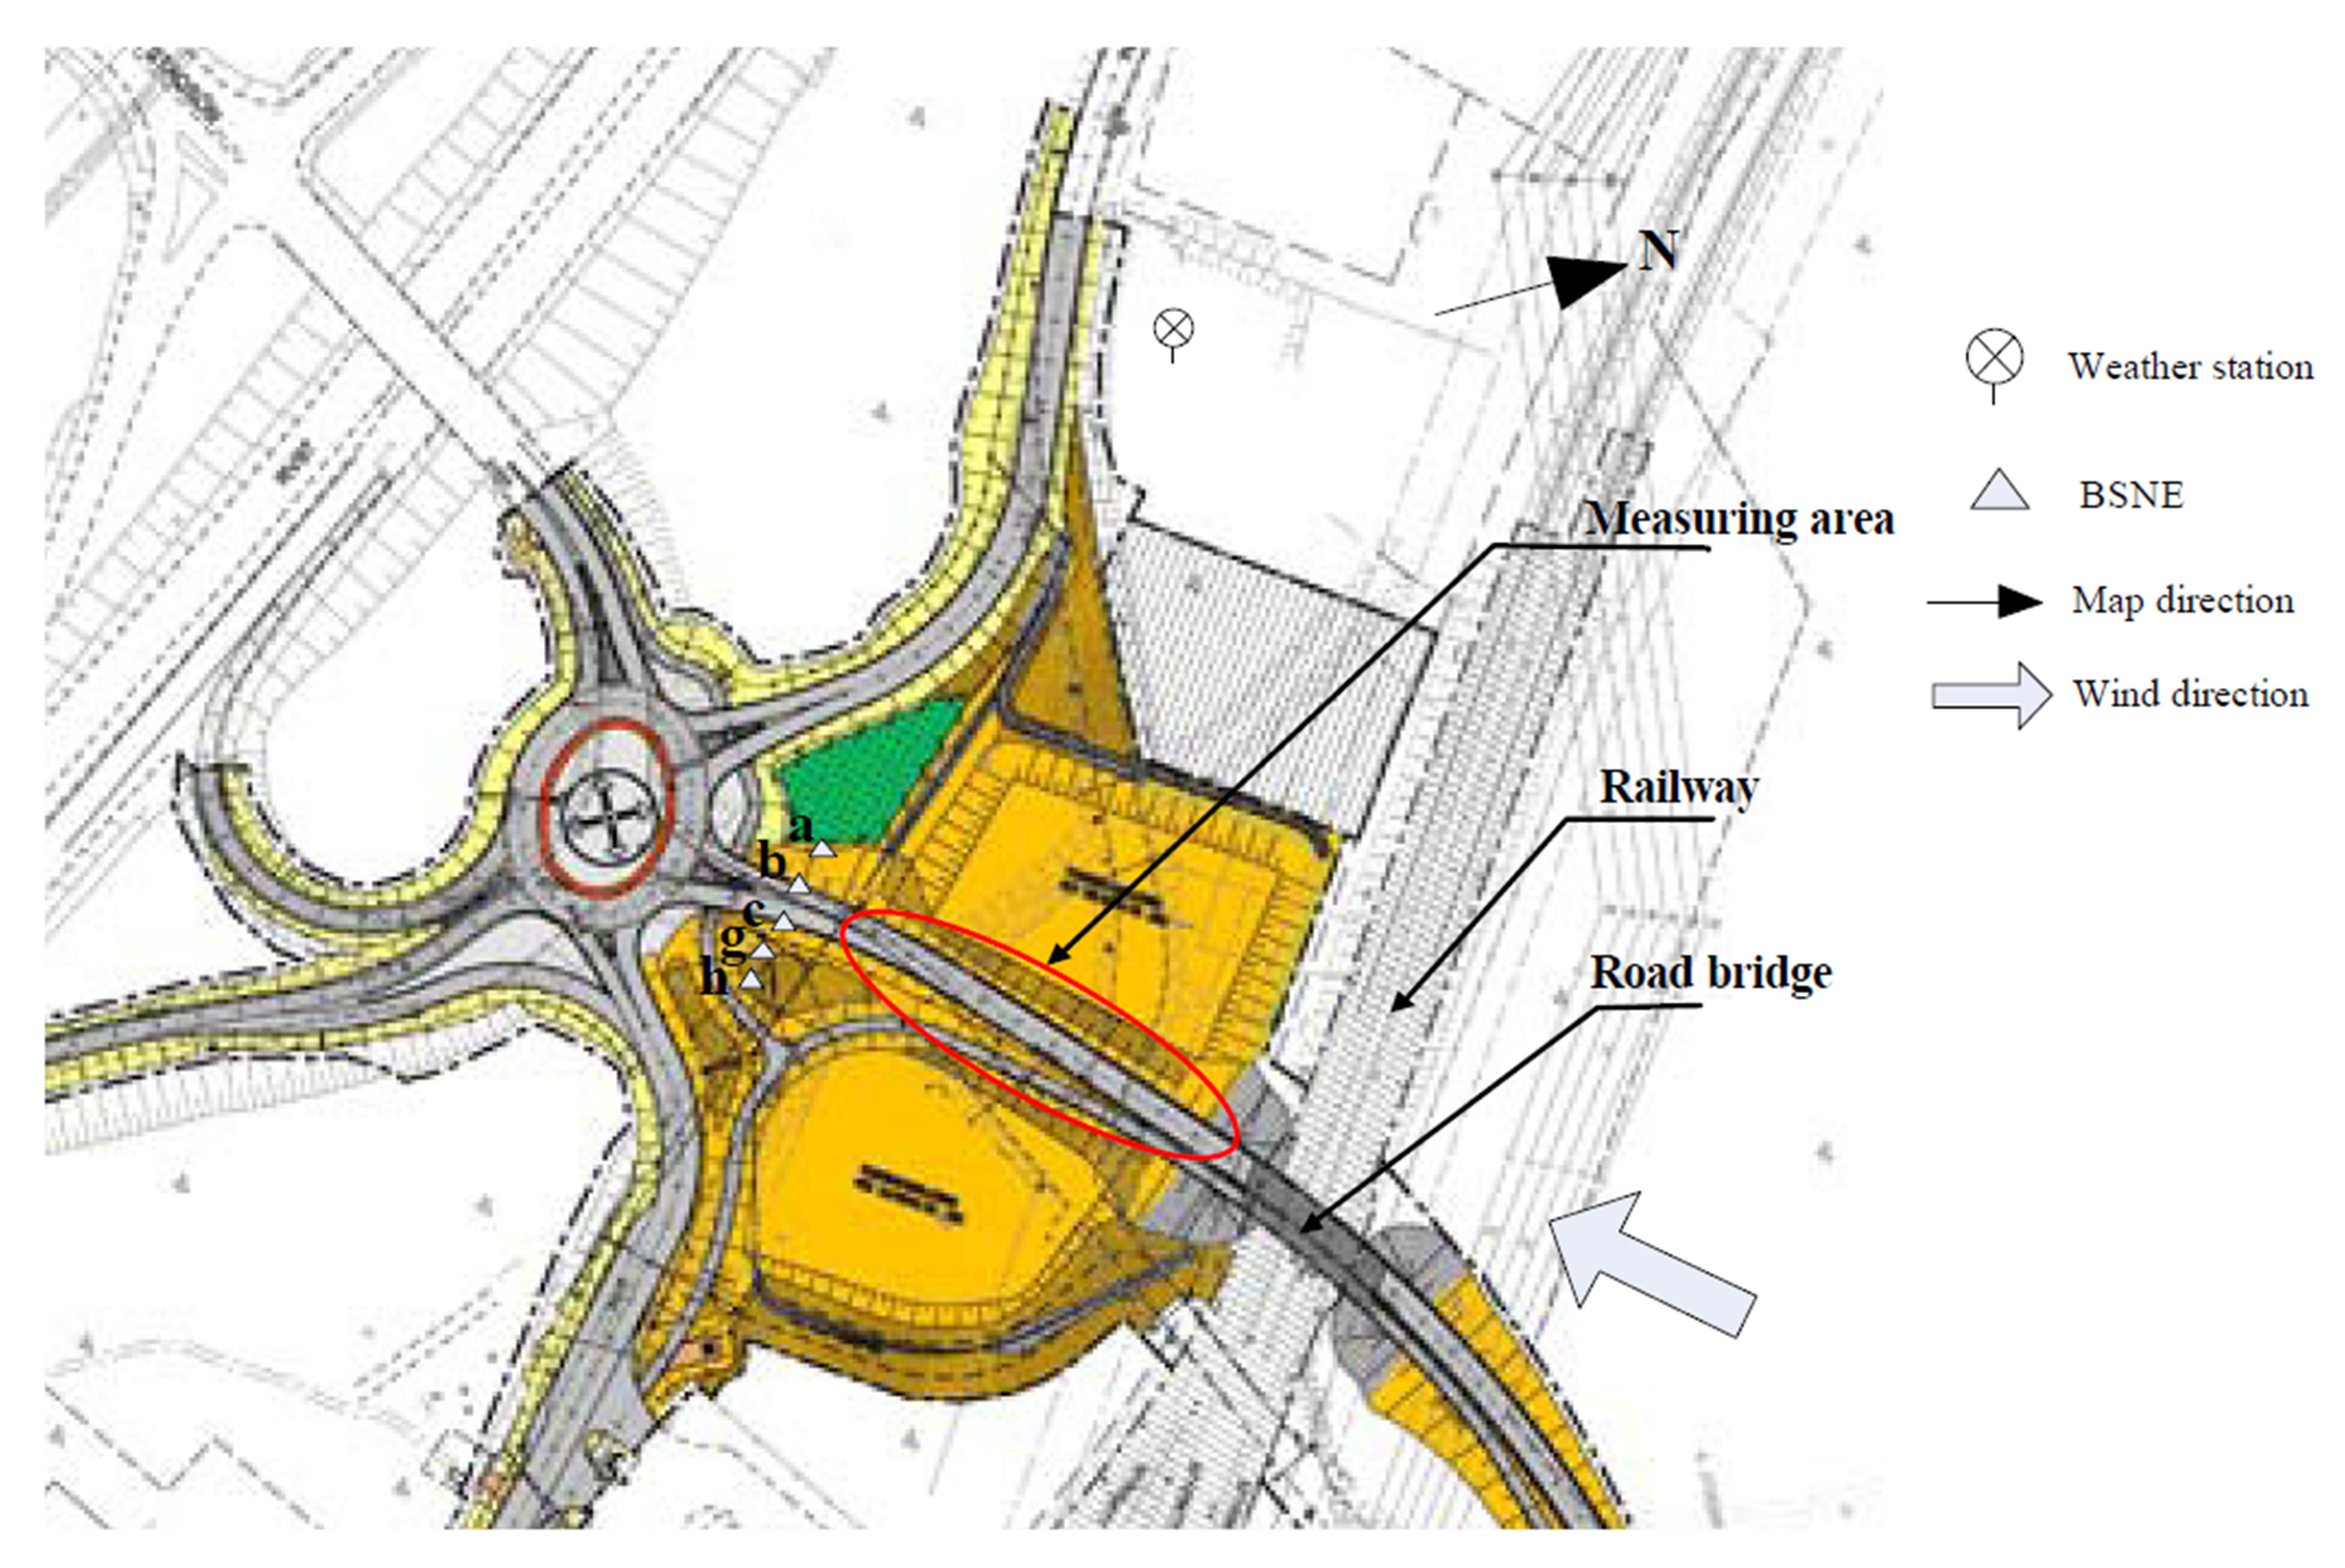
Figure 3. Mesaurement for the period 2013-08-05 to 2013-08-12.
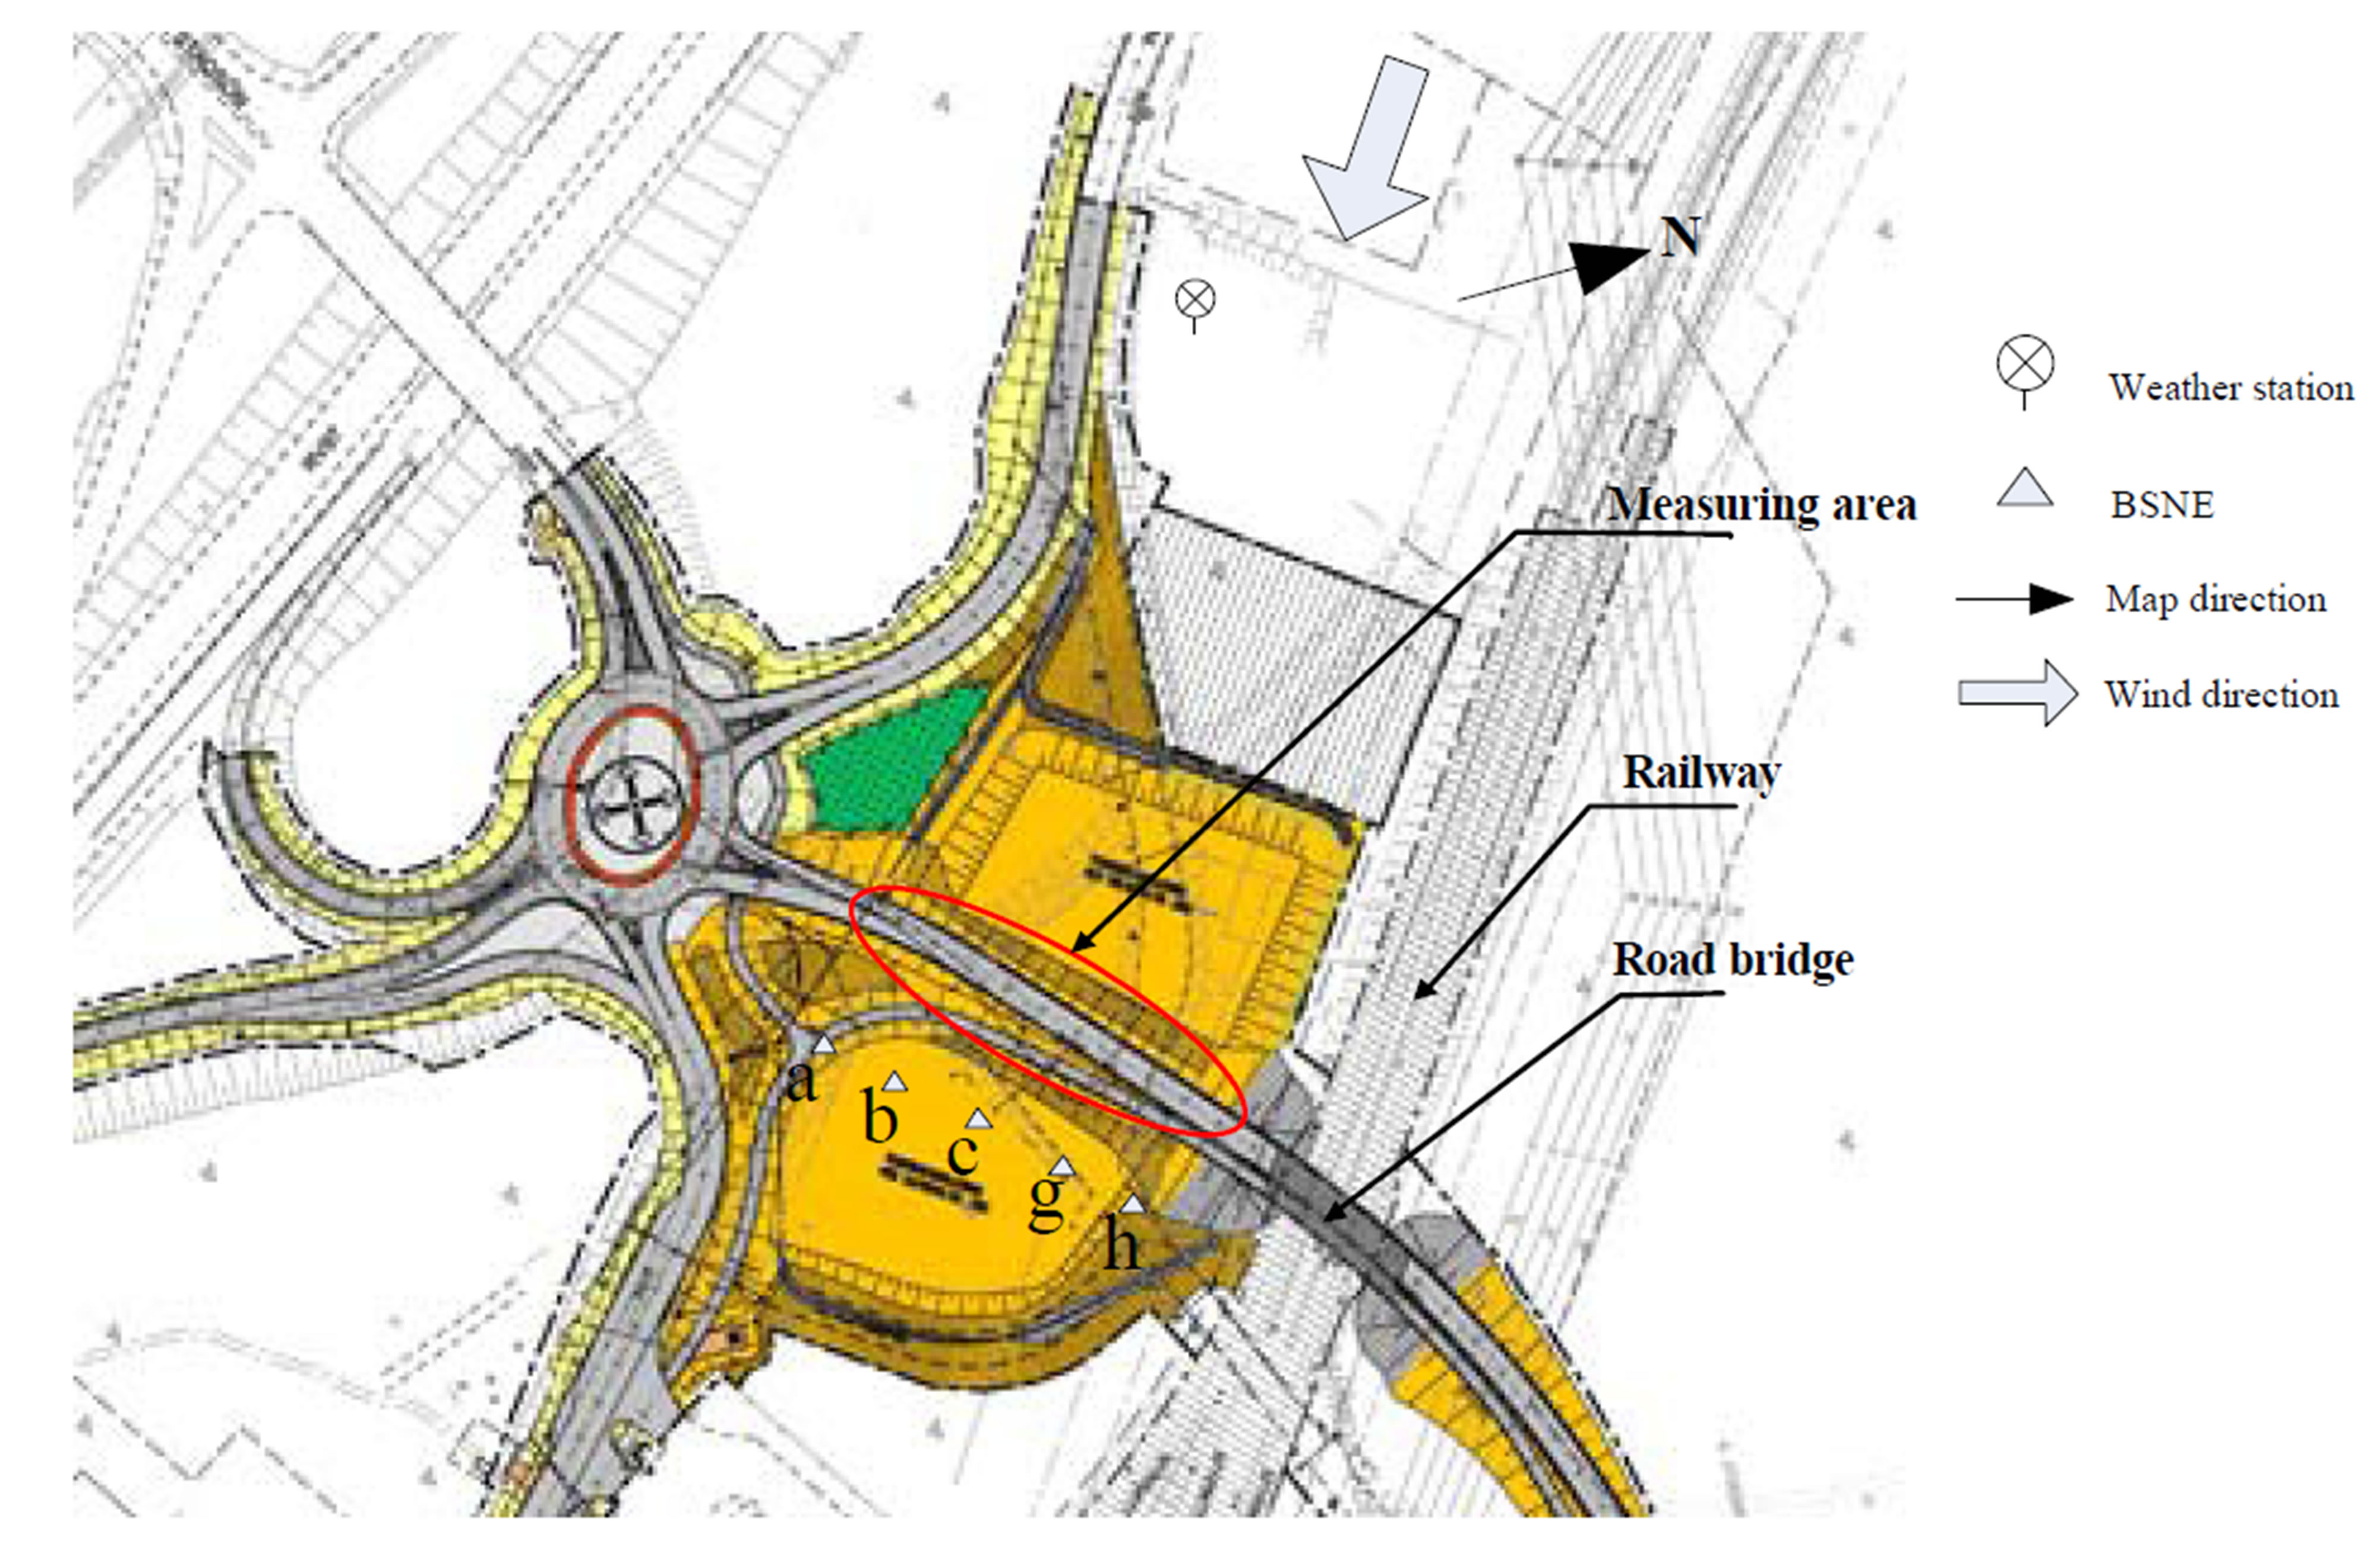
Figure 4. Measurement for the period of 20130819 to 20130913.
quired to direct the dust into the collectors.
4. RESULTS AND DISCUSSION
4.1. Texture and Threshold Velocity of the Road Material
During the measurement period, the road to the bridge was filled by layers with different materials. Table 2 shows the particle sizing of the layer materials. From layer 1 to layer 2, the material became coarser. The threshold friction velocities for wind erosion of three layer materials were estimated by sieving method [25,26]. Threshold wind velocities at the height of 2 m were calculated by a logarithmic distribution of wind speed profile above the surface [25]. In addition to particle size, threshold velocity for wind erosion to take place depends on several other soil conditions including cloudiness, mechanical stability of clouds, and formation of surface crust, bulk density, and moisture content [27]. Therefore the actual threshold wind velocities should be higher than the estimated ones in Table 2. Figure 5 shows the wind velocity and gust velocity at the height of 2 m during the measurement period. Gust is defined as short bursts of high speed wind and when talking about wind
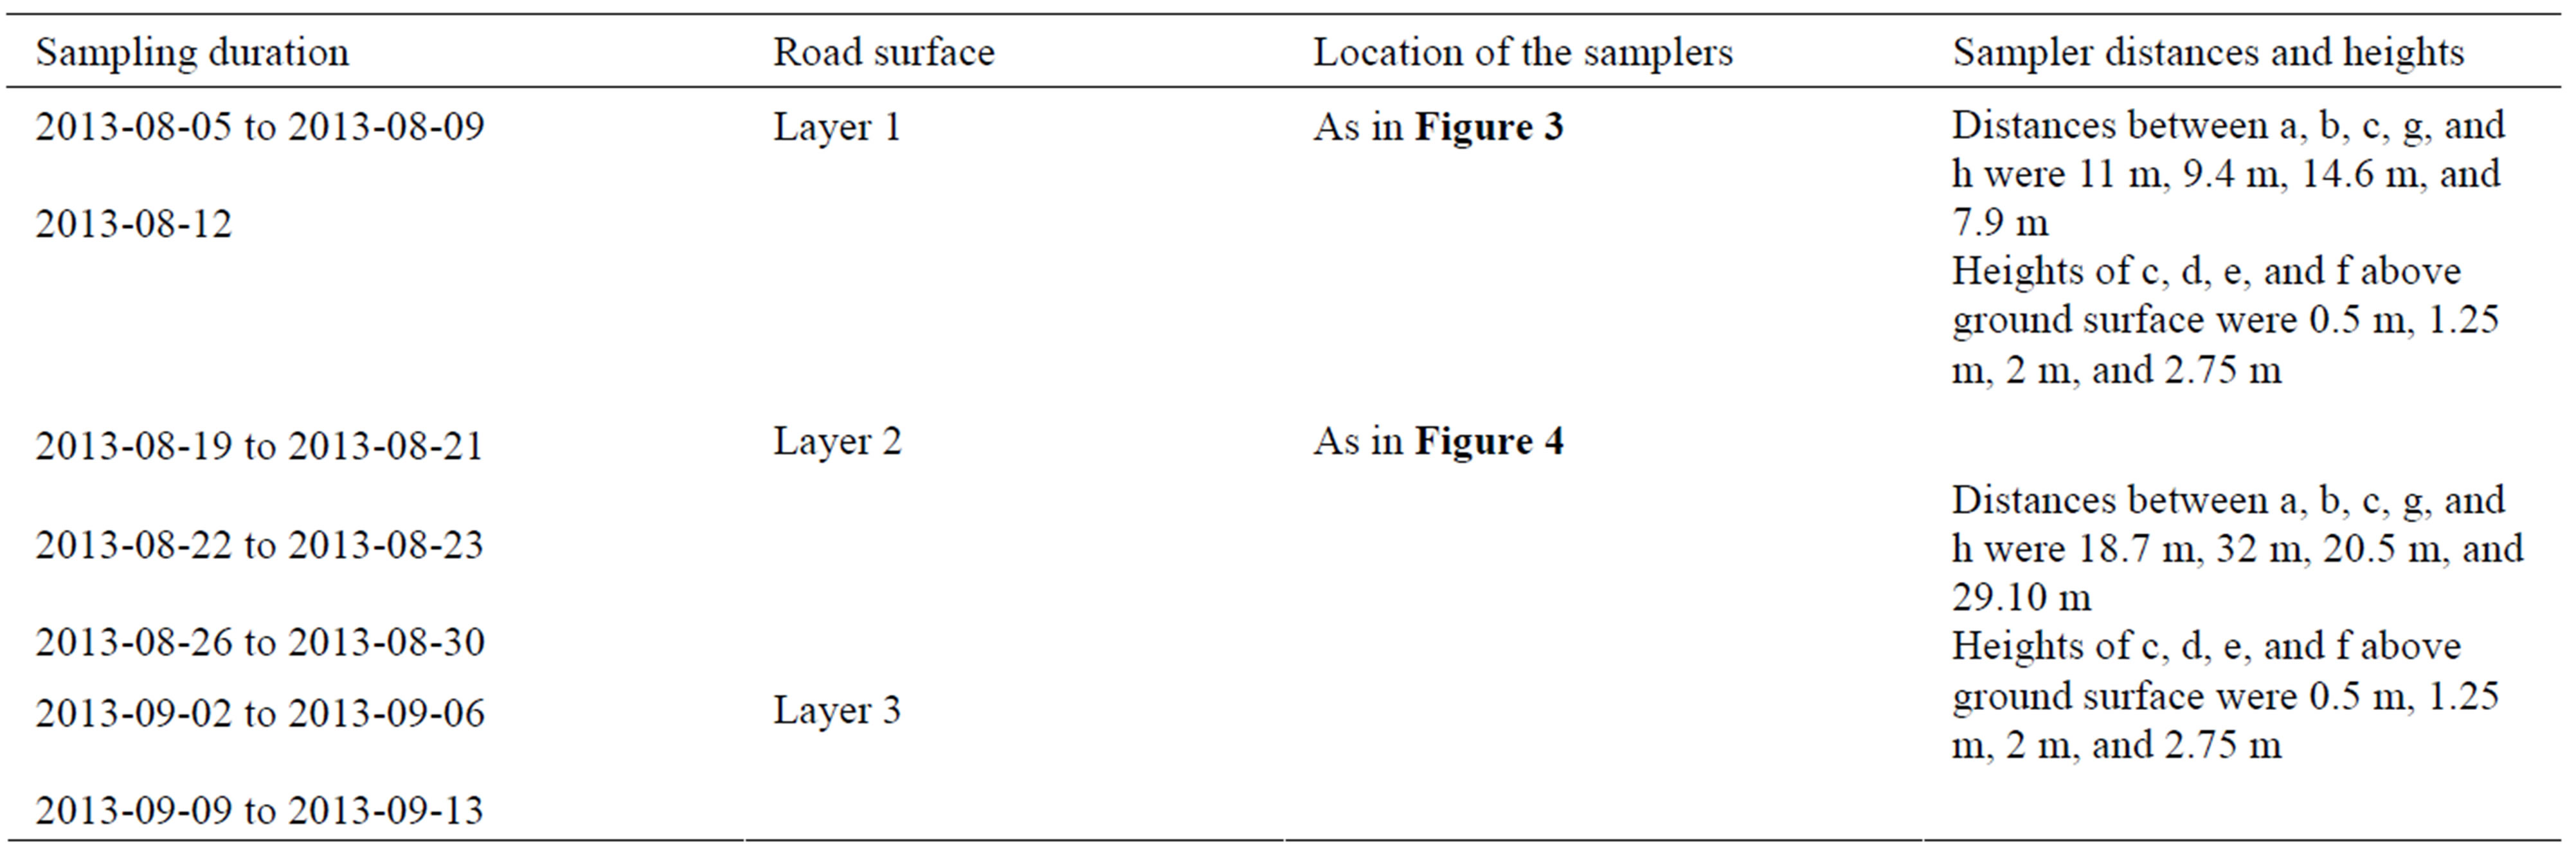
Table 1. Sampling duration, road surface and location of samplers.
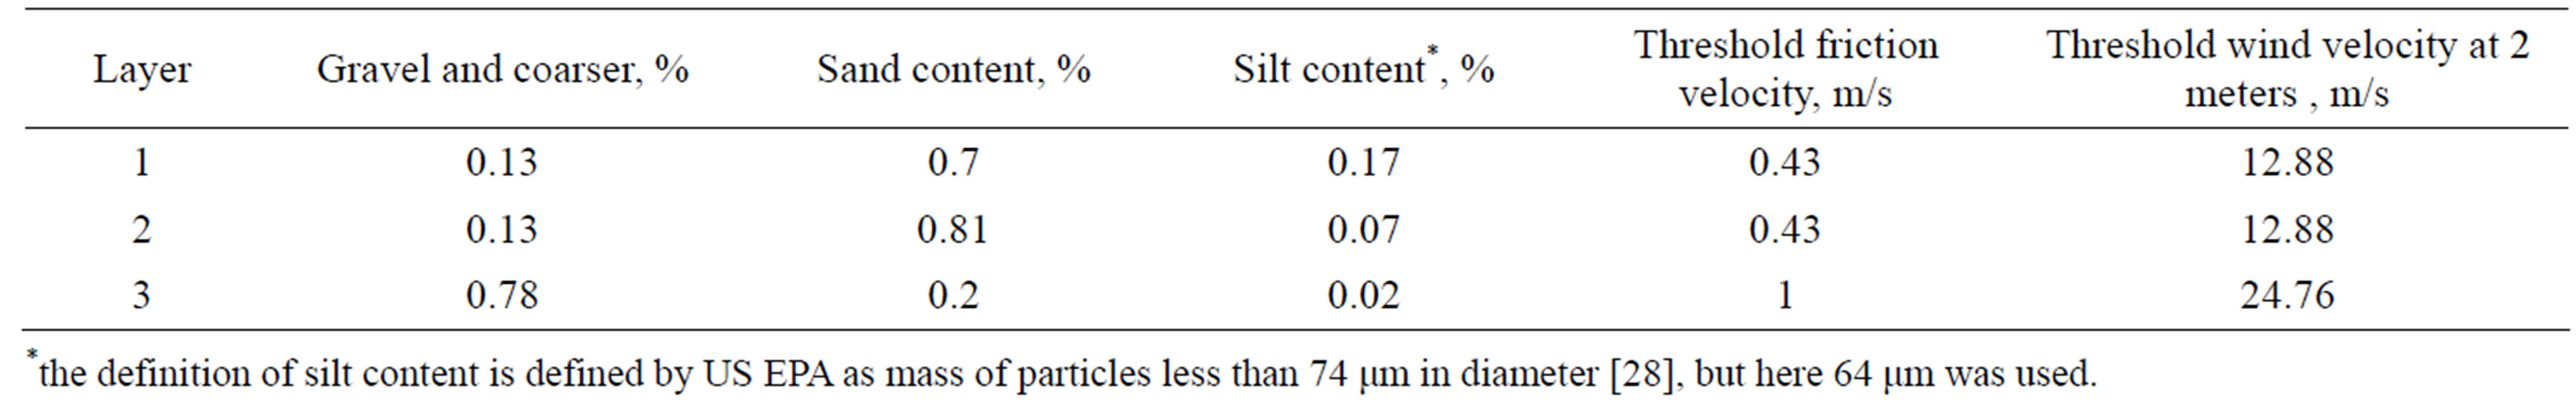
Table 2. Filling materials and threshold wind velocities.
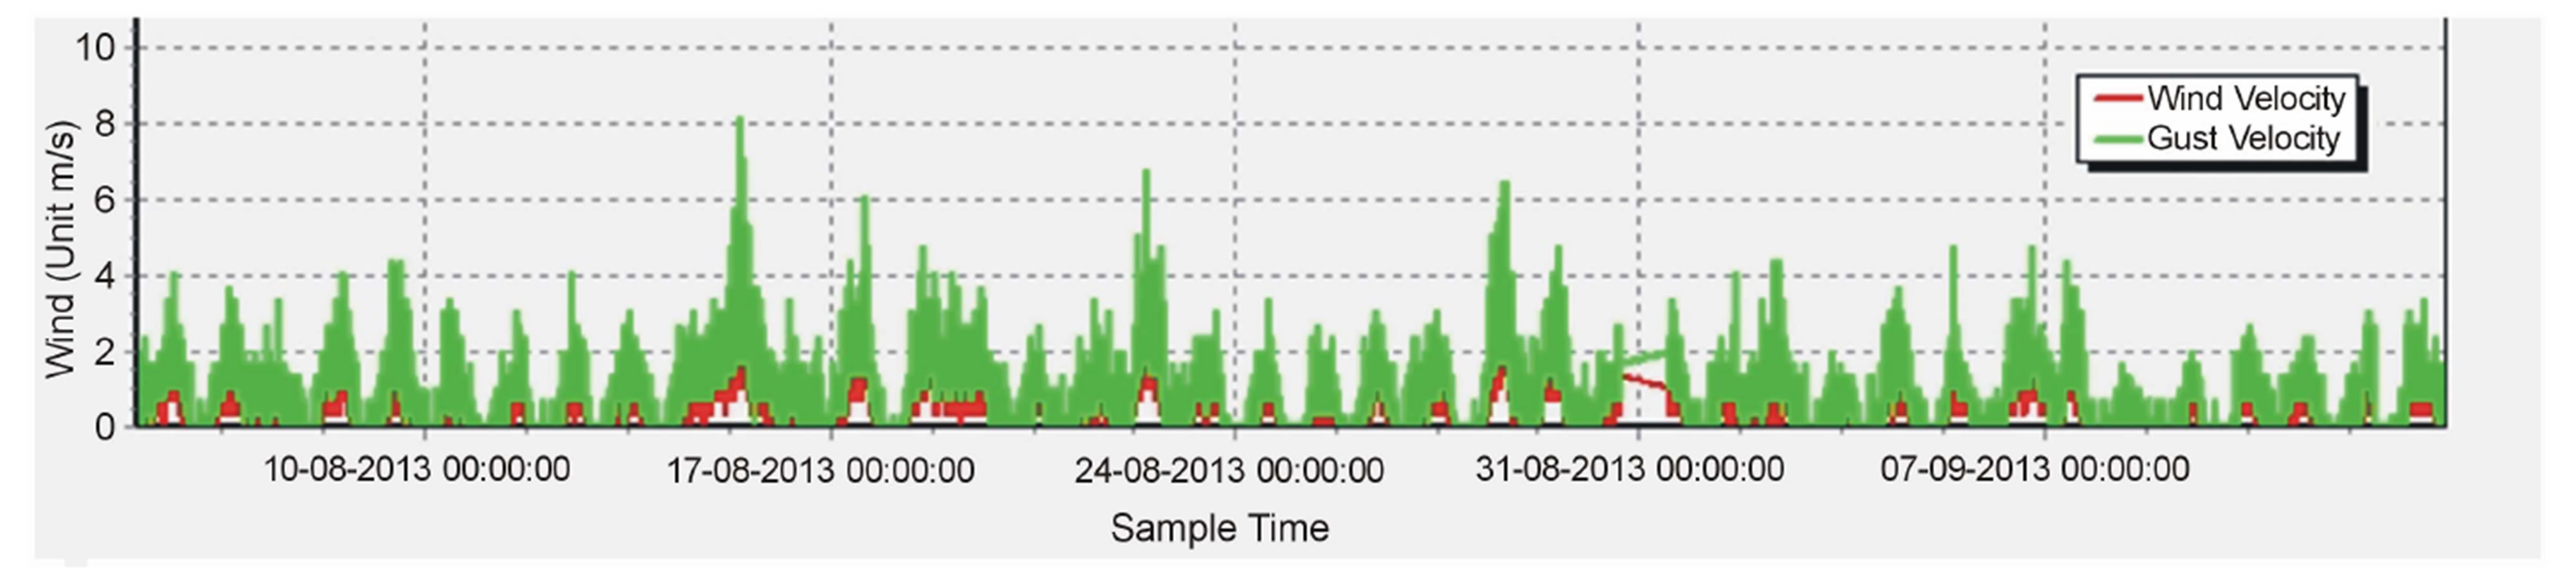
Figure 5. Wind velocity for the measuring period.
erosion, gust velocity should be considered. During the measurement period neither wind velocity nor gust velocity was higher than the threshold wind velocity for the 3 layer materials. This confirmed the assumption that the dust emission from the road construction was only generated by mechanical forces rather than wind erosion.
4.2. Influenced of Weather on Dust Emission
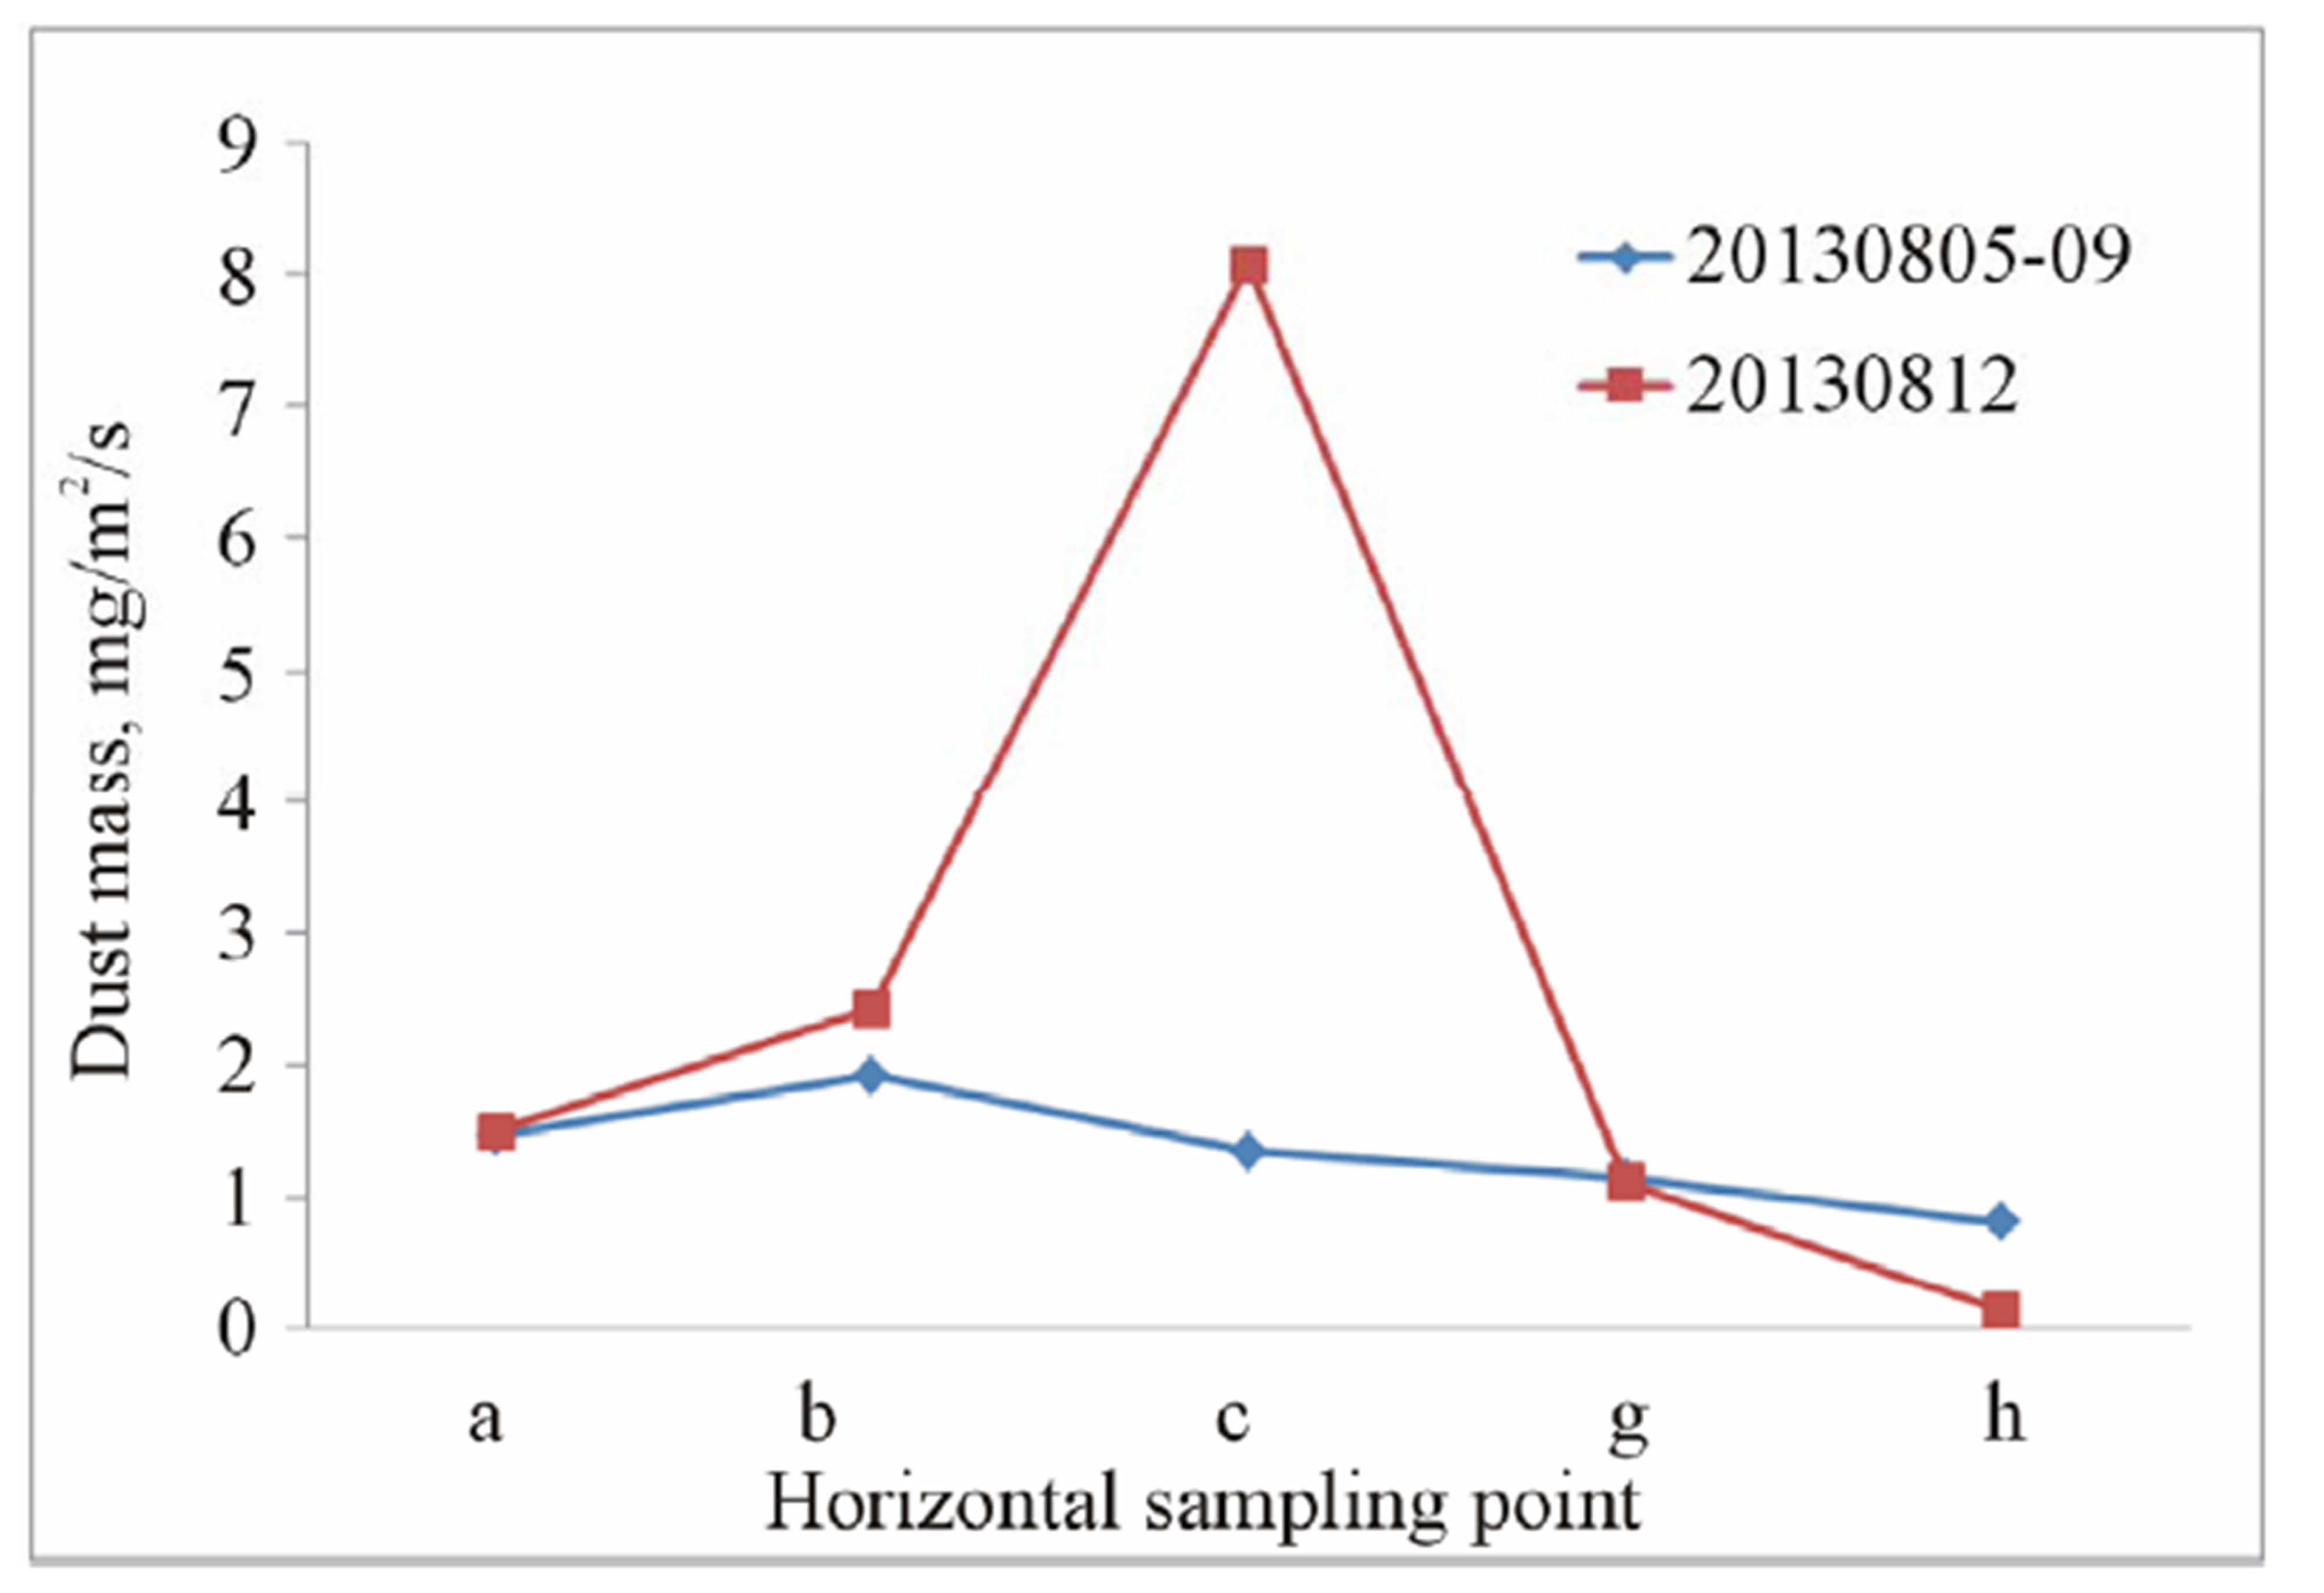
The dust masses collected from all sampling points were plotted in Figure 6. The dust masses were calculated as unit mg/m2/s. The opening of BSNE sampler is 20 × 50 mm2. According to the assumption that no wind erosion of road material was happening and the collector had no collection when the wind direction was biased more than 45 degrees to the both sides of the demanded wind direction, the measuring period excluded the weekend and non-working hours, as well as the time when the wind was beyond the required direction. The purpose of exposure-profiling method is to measure the dust mass variation over the cross section of the dust cloud to find out the boundary of the cross section when dust mass is close to zero so that the integration can be done over the cross section. It was expected that horizontally the dust mass should have a maximum value in middle sampling point and decrease to both sides to zero when reach to the boundary of the dust cloud. Vertically dust mass was expected to have a maximum value at the lowest sampling point and decrease with height to the top of the dust cloud. However due to the limited number of sampling points, it was not easy to get the expected trend for all sampling periods (Figure 6). Dust masses from five sampling periods, which were 2013-08-05 to 2013-08-09, 2013-08-12, 2013-08-19 to 2013-08-21, 2013-08-26 to 2013-08-30, and 2013-09-02 to 2013-0906, were in the expected trend. Integration could be done by simply assume dust mass varies in the same pattern horizontally at different heights, and varies in the same pattern vertically over the width of dust cloud.
 (a)
(a)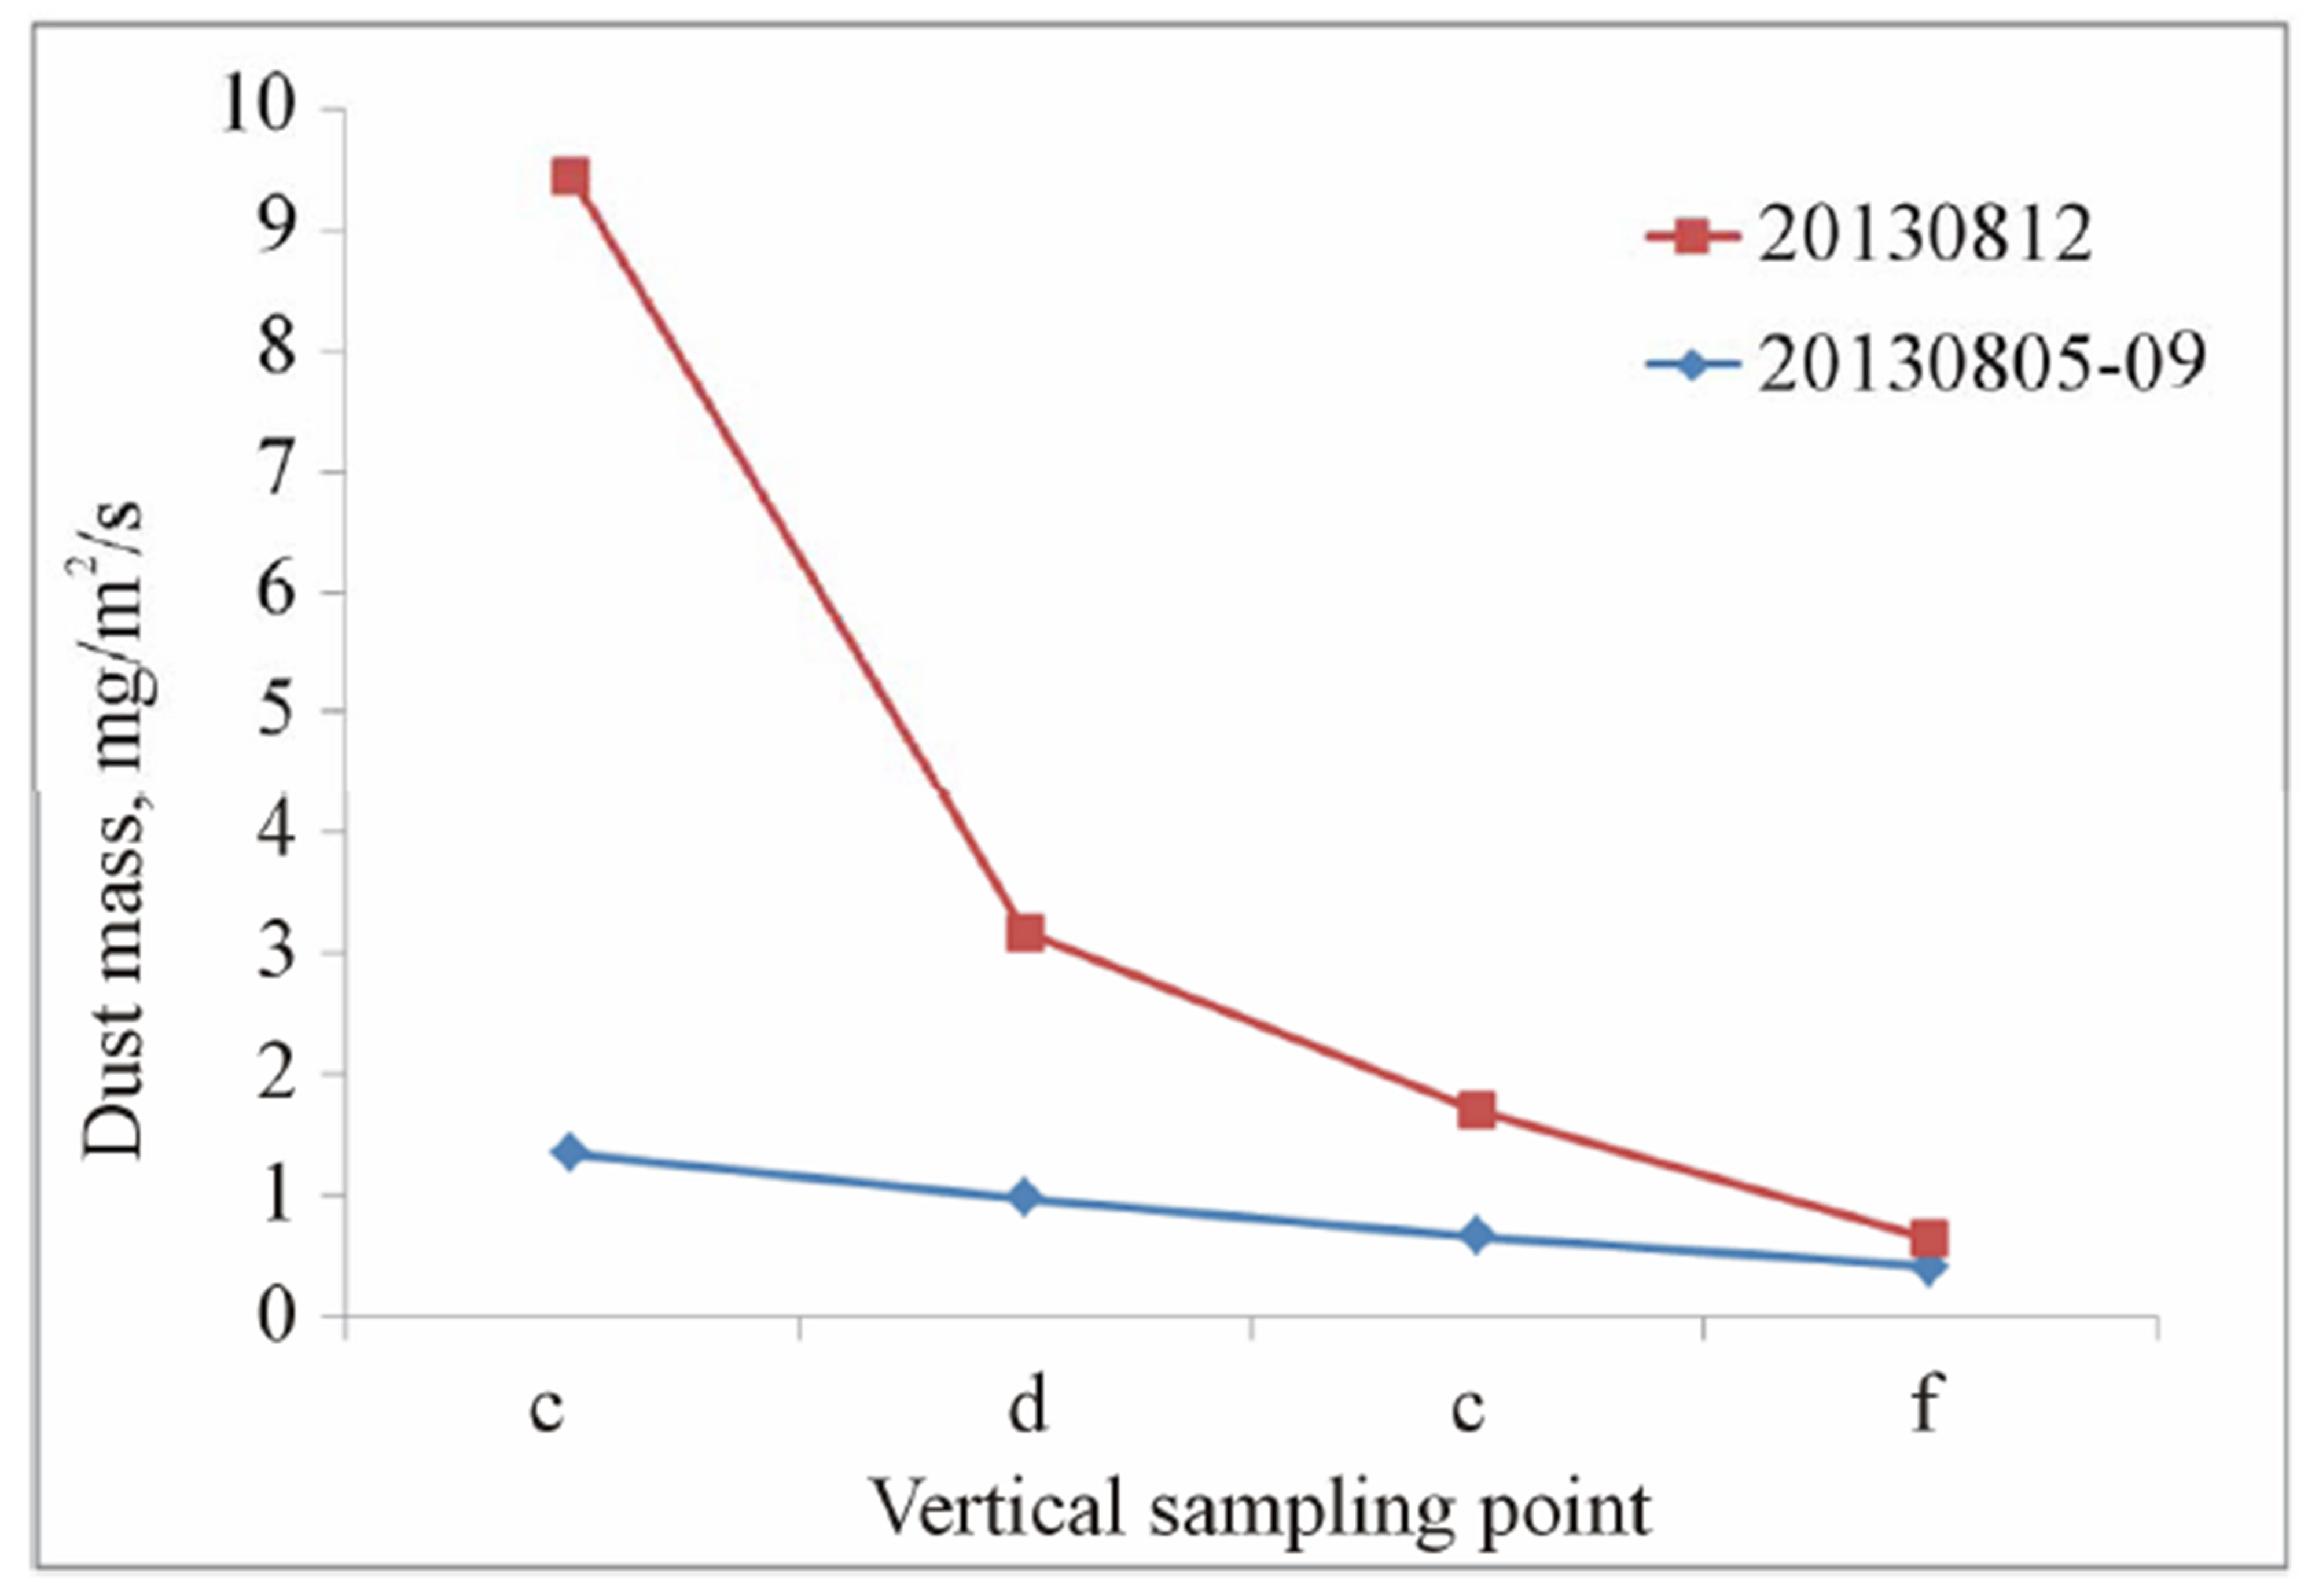 (b)
(b)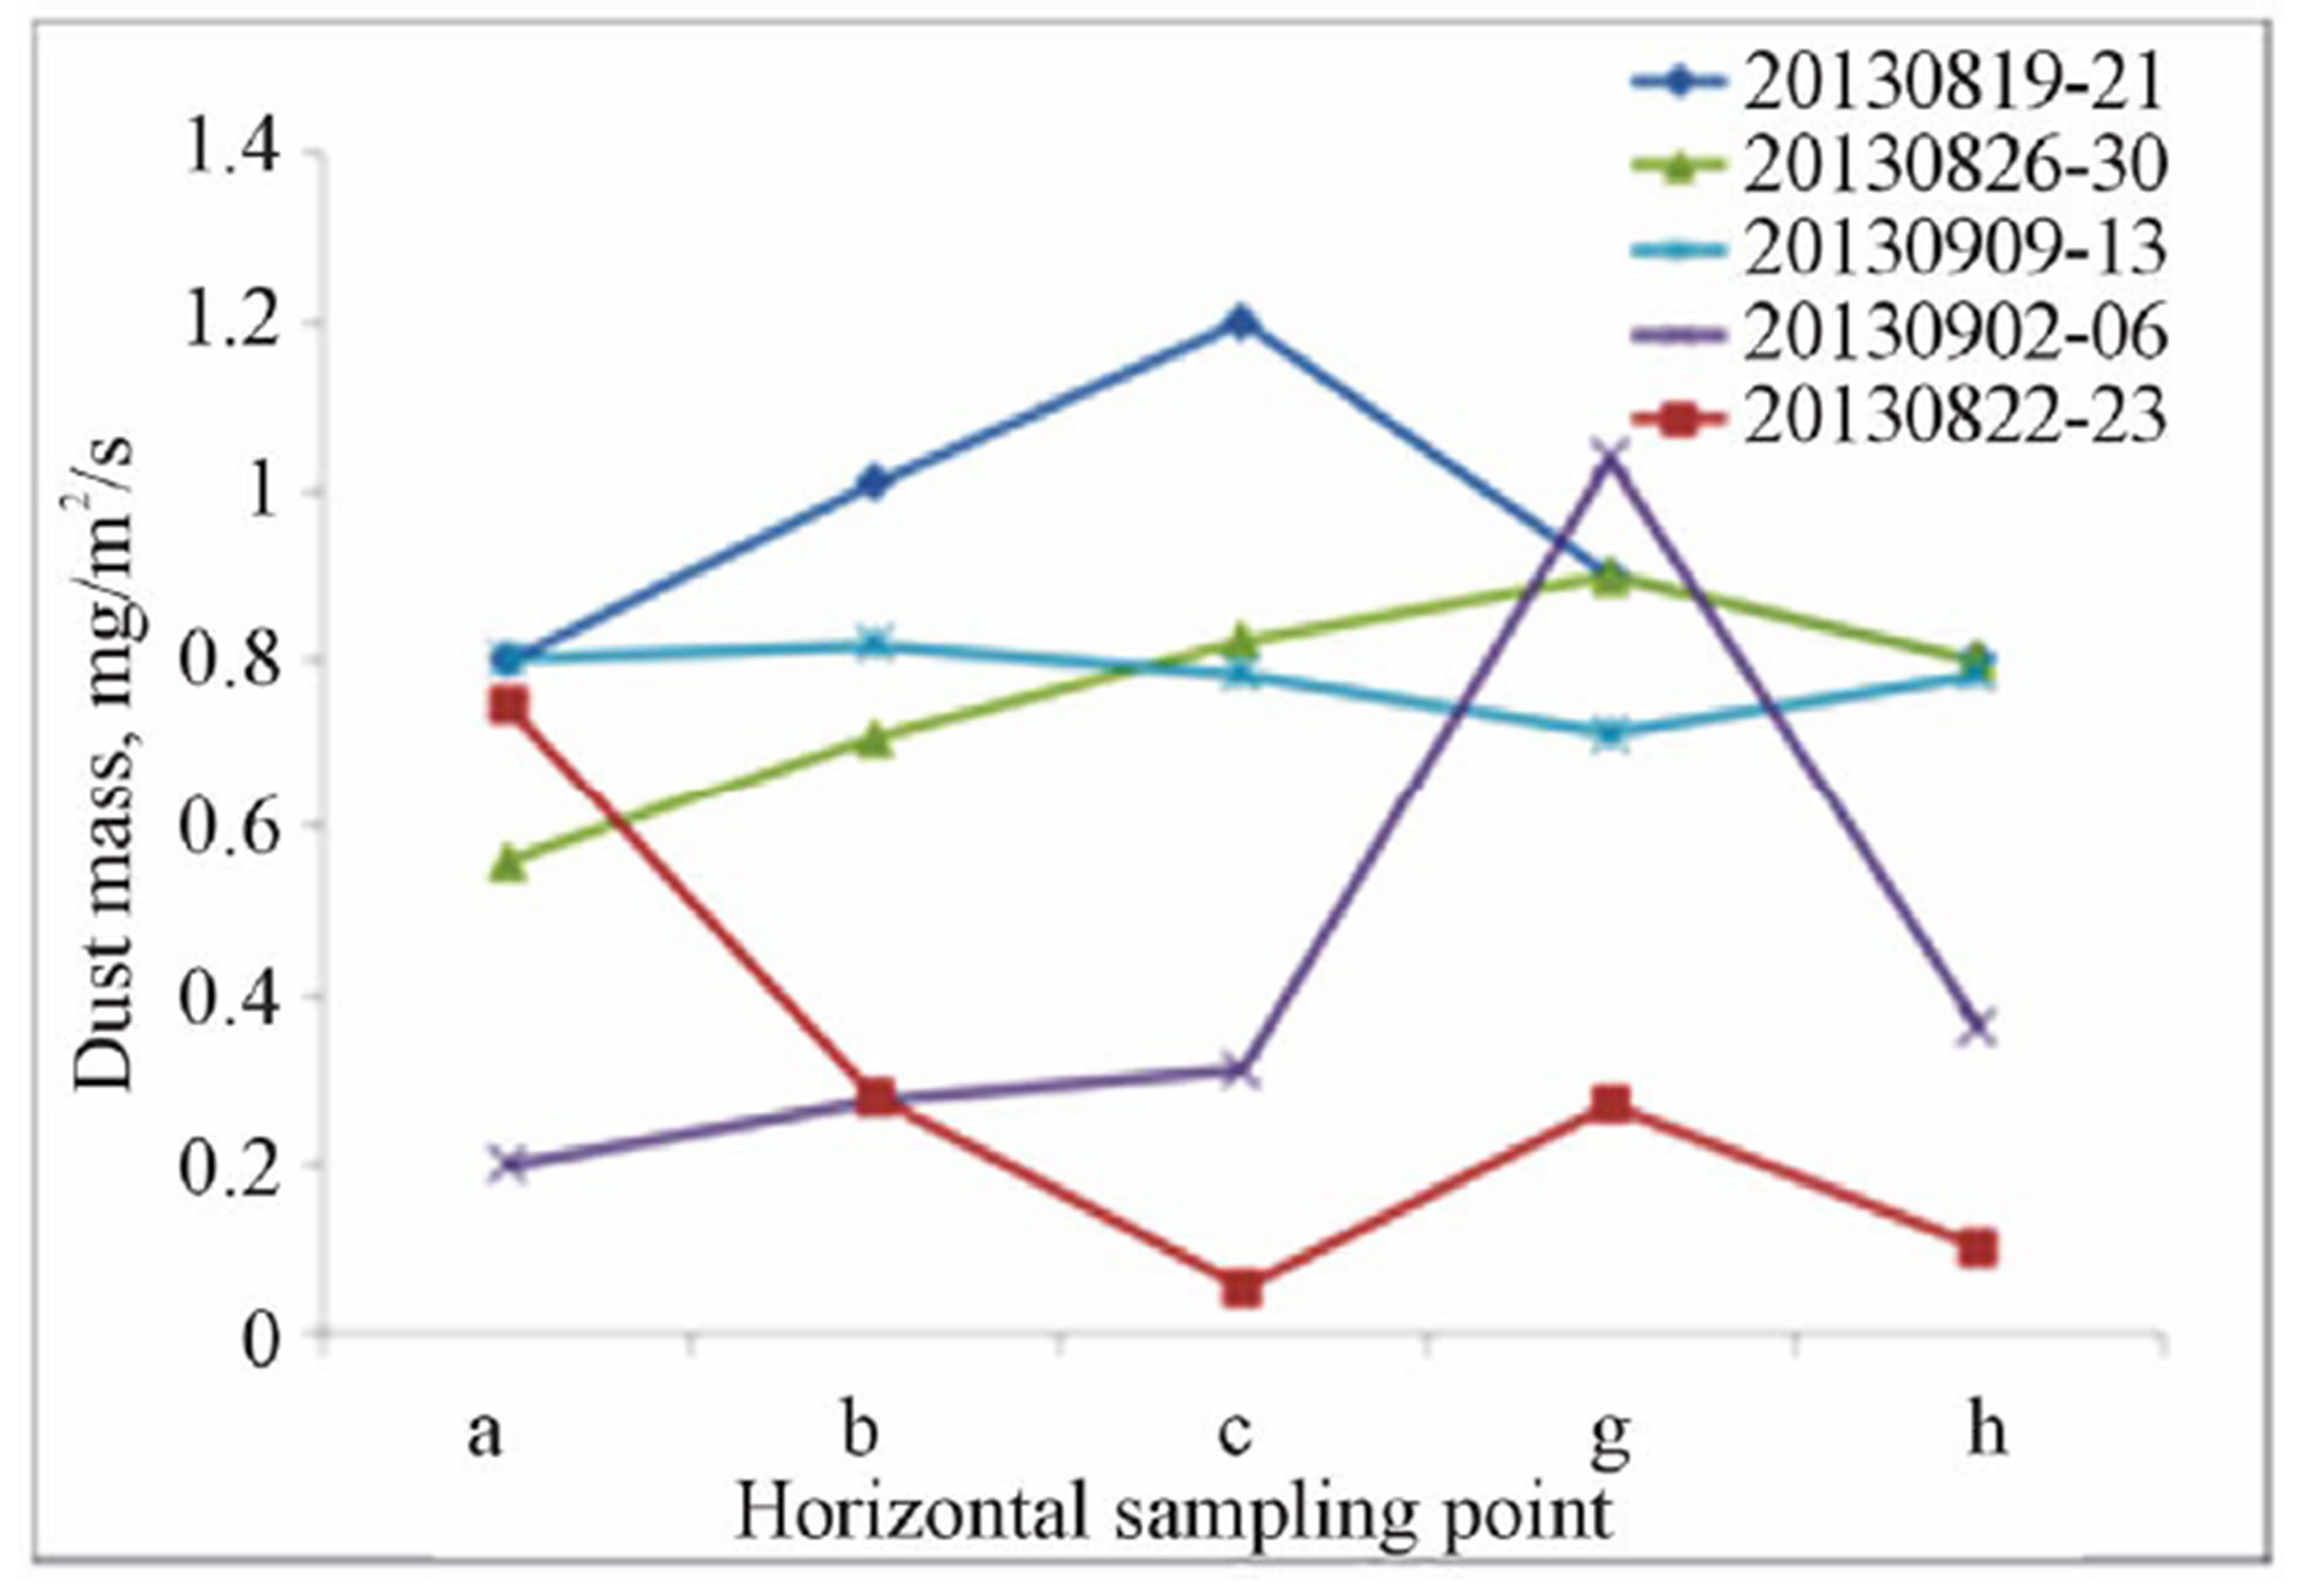 (c)
(c)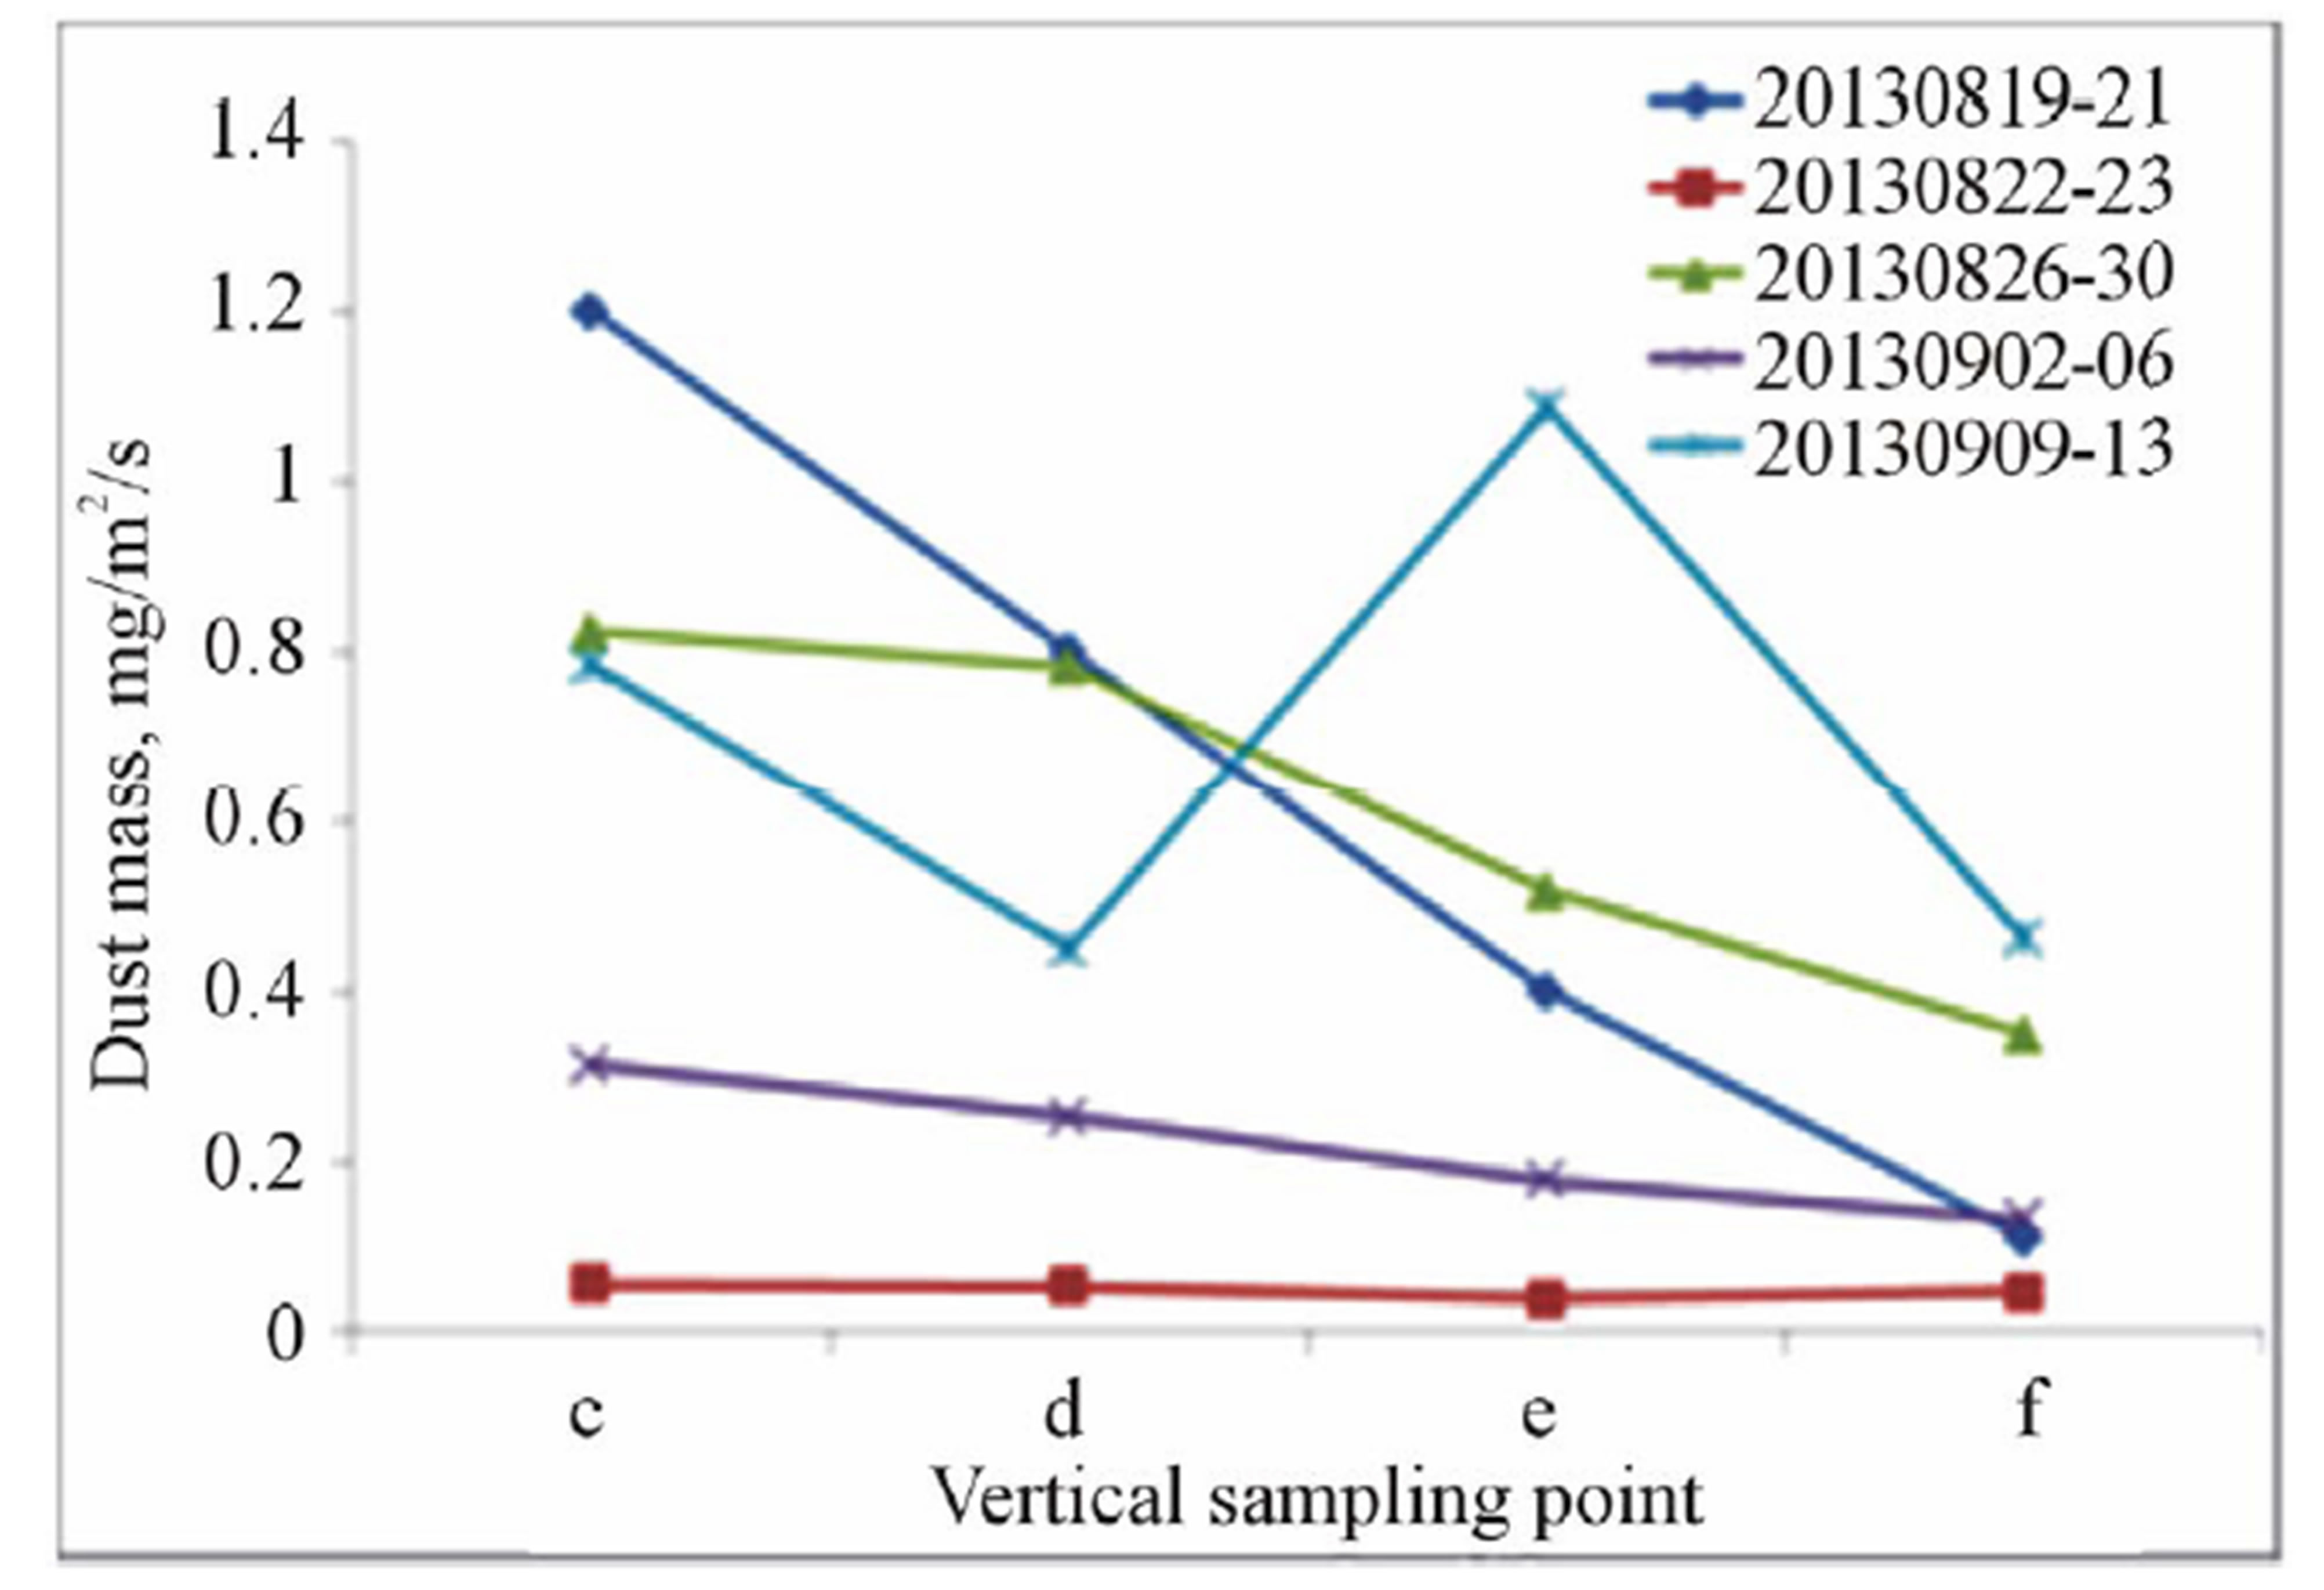 (d)
(d)
Figure 6. Dust mass for the sampling periods. a: dust mass for the sampling point a, b, c, g, h when the samplers were located as in Figure 3; b: dust mass for the sampling point c, d, e, f when the samplers were located as in Figure 3; c: dust mass for the sampling point a, b, c, g, h when the samplers were located as in Figure 4; d: dust mass for the sampling point c, d, e, f when the samplers were located as in Figure 4.
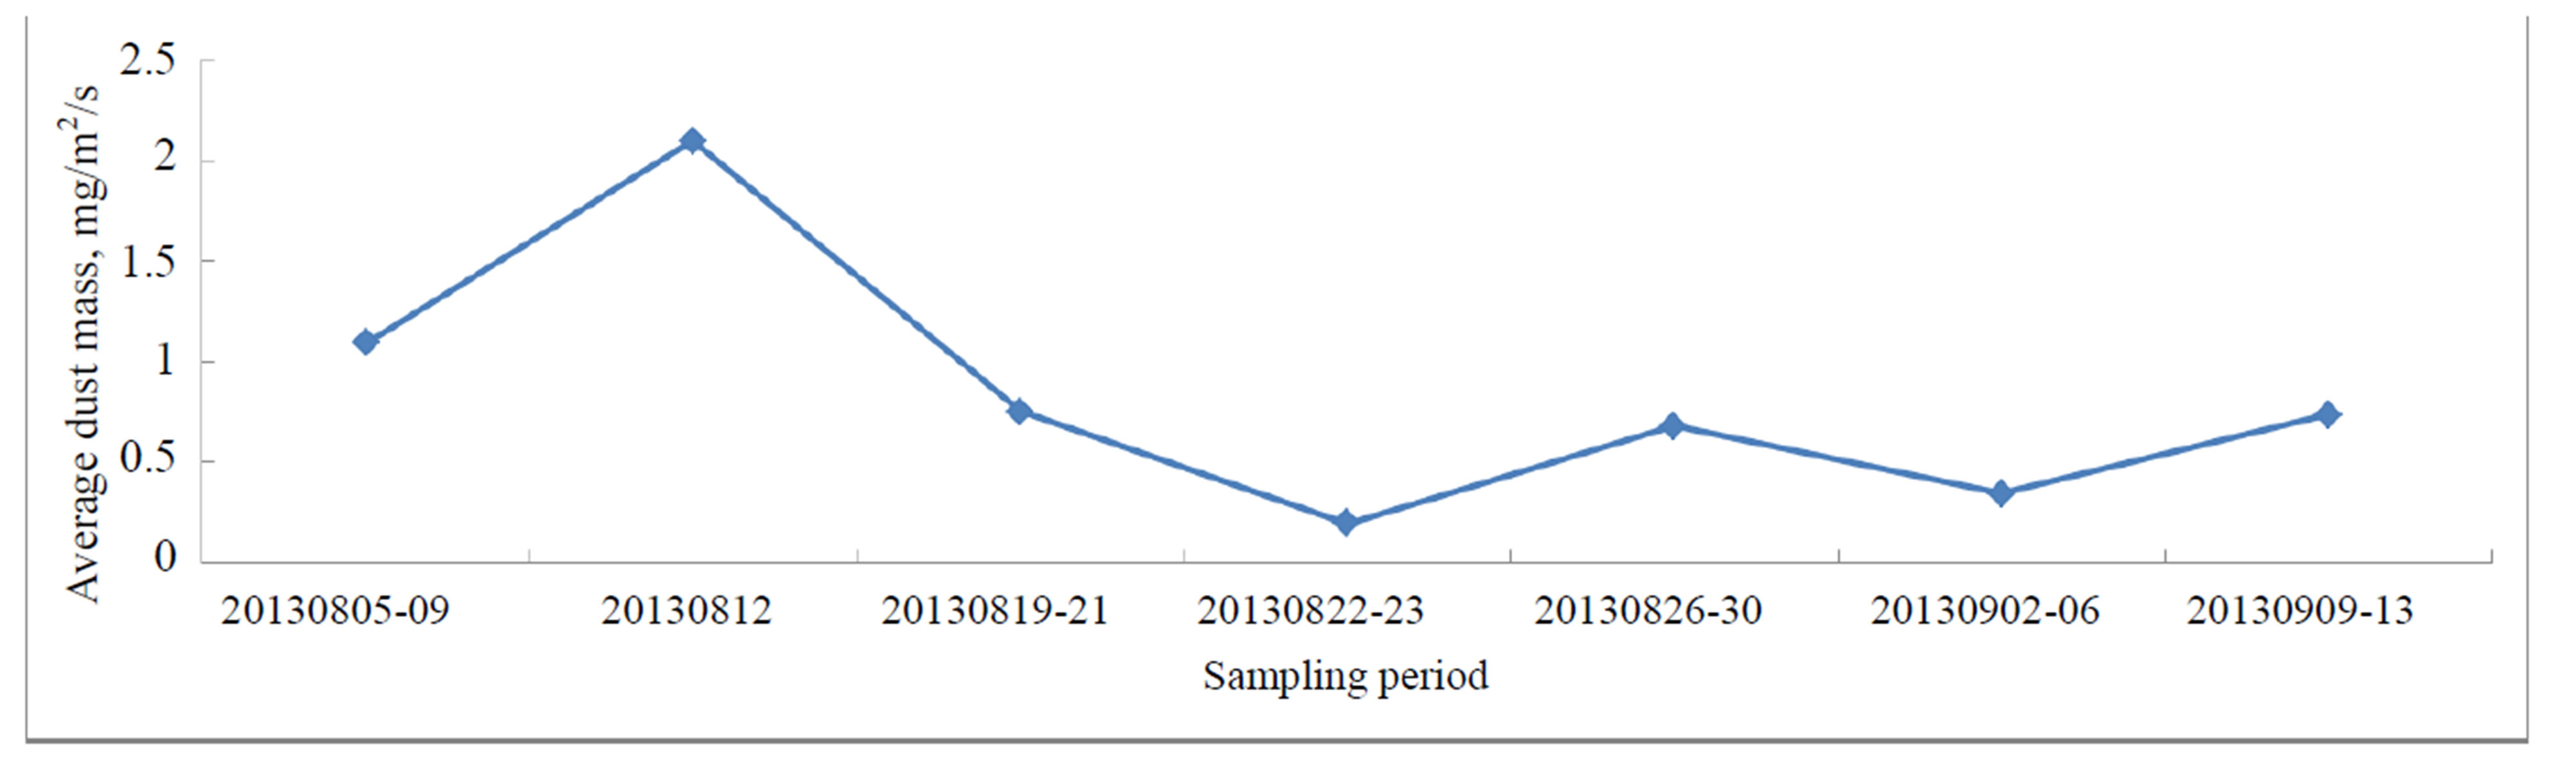
For all seven sampling periods, average dust masses of all sampling points a, b, c, d, e, f, g and h were plotted on Figure 7(a). Figure 7(b), c and d shows the moisture content of the road layer materials, wind speed and outdoor humidity for the sampling periods. The construction work was carried out 5 days a week from 6 am to 6 pm with a constant working load, therefore the effect of working scale is not considered for dust emission. Comparing dust mass (Figure 7(a)) with material moisture content (Figure 7(b)), wind speed (Figure 7(c)), and outdoor humidity (Figure 7(d)), only moisture content of surface material had some relationship with dust mass and the others had no clear relation with dust mass. Dust generation can be influenced by several factors in a complicated and interactive way. Figure 7 indicated that moisture content of surface material had the closest relation with dust generation, wind speed, and humidity had minor or no influences. Moisture in surface material is a result of the influence of rainfall, evaporation, humidity and so on. It is known that moisture content increases inter-particle binding forces and thus reduces dust emission, and this is revealed by Figures 7(a) and (b) that
when moisture content was low the dust mass was high. Wind force is an important factor concerning wind erosion, and wind speed must be over threshold velocity to initiate wind erosion of surface material. Since no wind erosion took place during the measuring period, the mechanical forces initiated dust generation and wind was only the transport agency of dust particle. Therefore, wind velocity mainly affects the speed of the dust transportation rather than the mass of dust generated. Outdoor humidity is one of the factors that resulted in changes in moisture within the surface material. Figures 7(a) and (d) show a very weak relation between dust mass and humidity. The overall effect of weather factors to moisture content should be analyzed as a whole rather than considering humidity separately.
4.3. Integrated Dust Emission Rate
Dust masses from the sampling periods, 2013-08-05 to 2013-08-09, 2013-08-12, 2013-08-19 to 2013-08-21, 2013-08-26 to 2013-08-30, and 2013-09-02 to 2013-09- 06, were able to calculate the integrated dust mass over
 (a)
(a)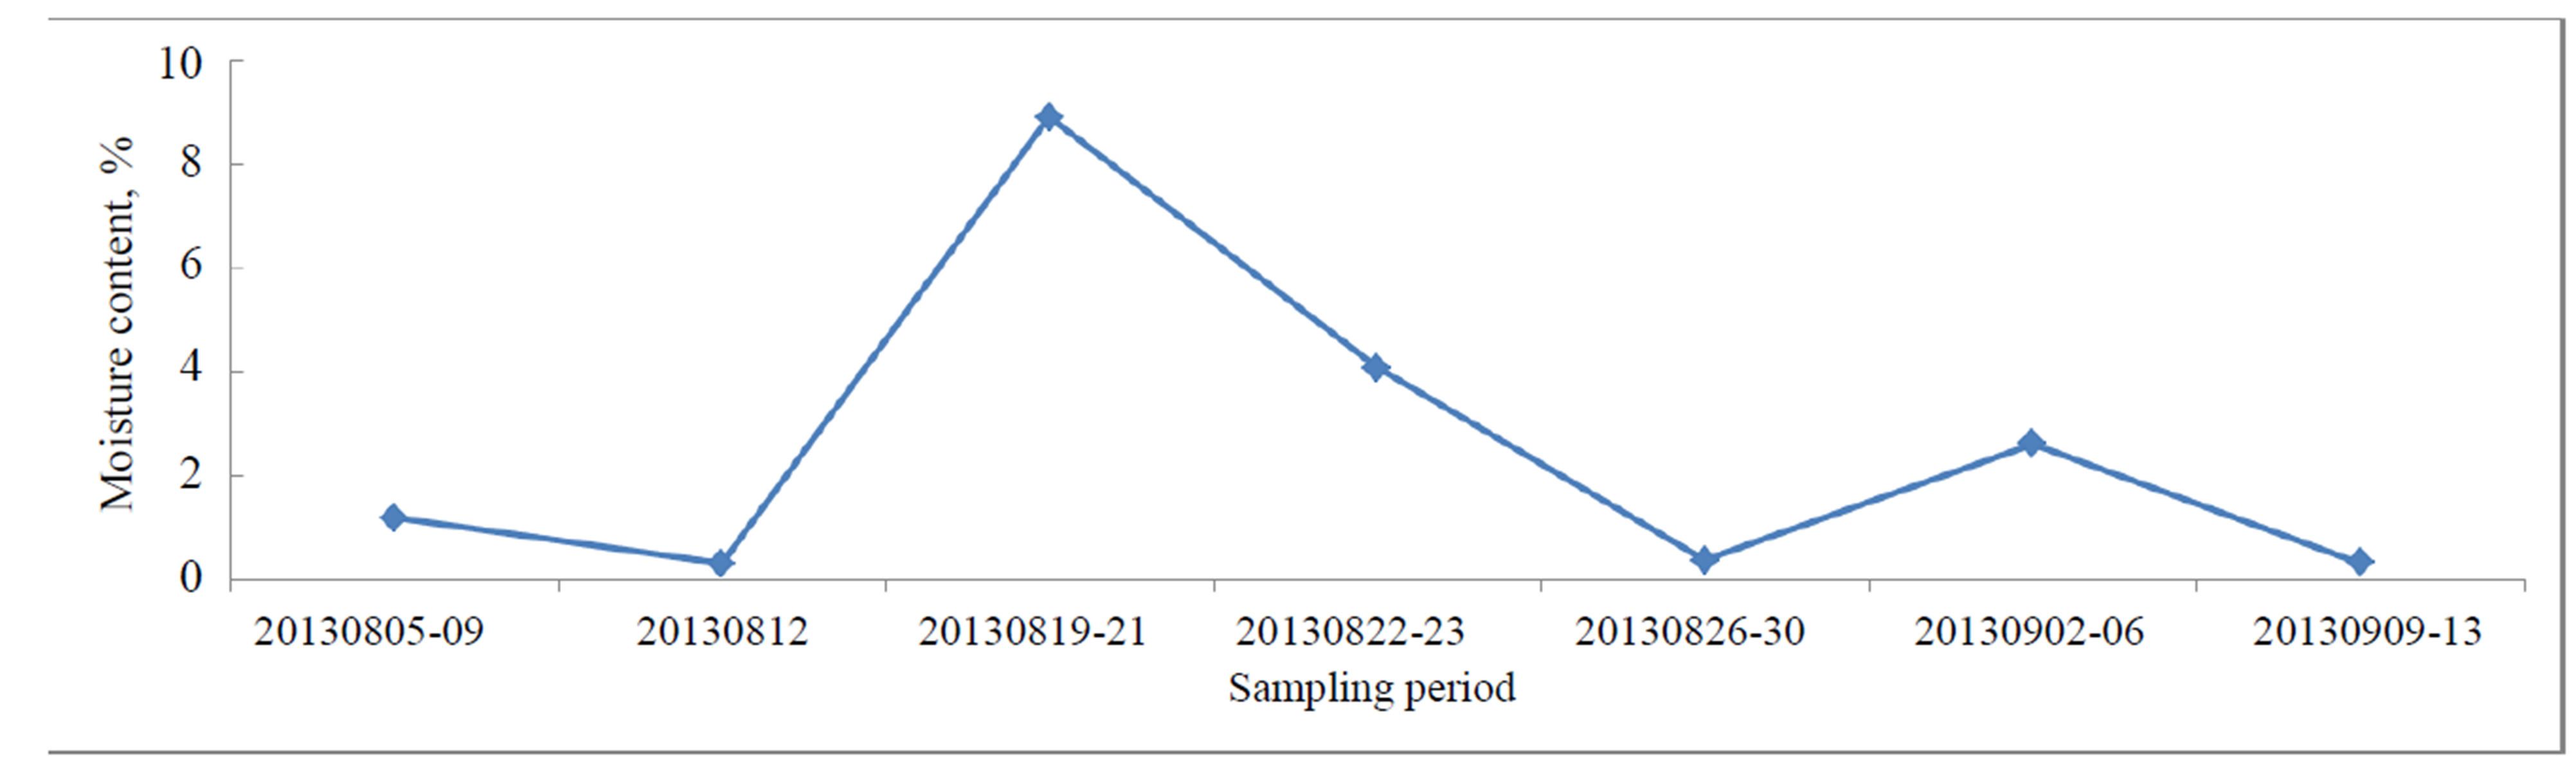 (b)
(b)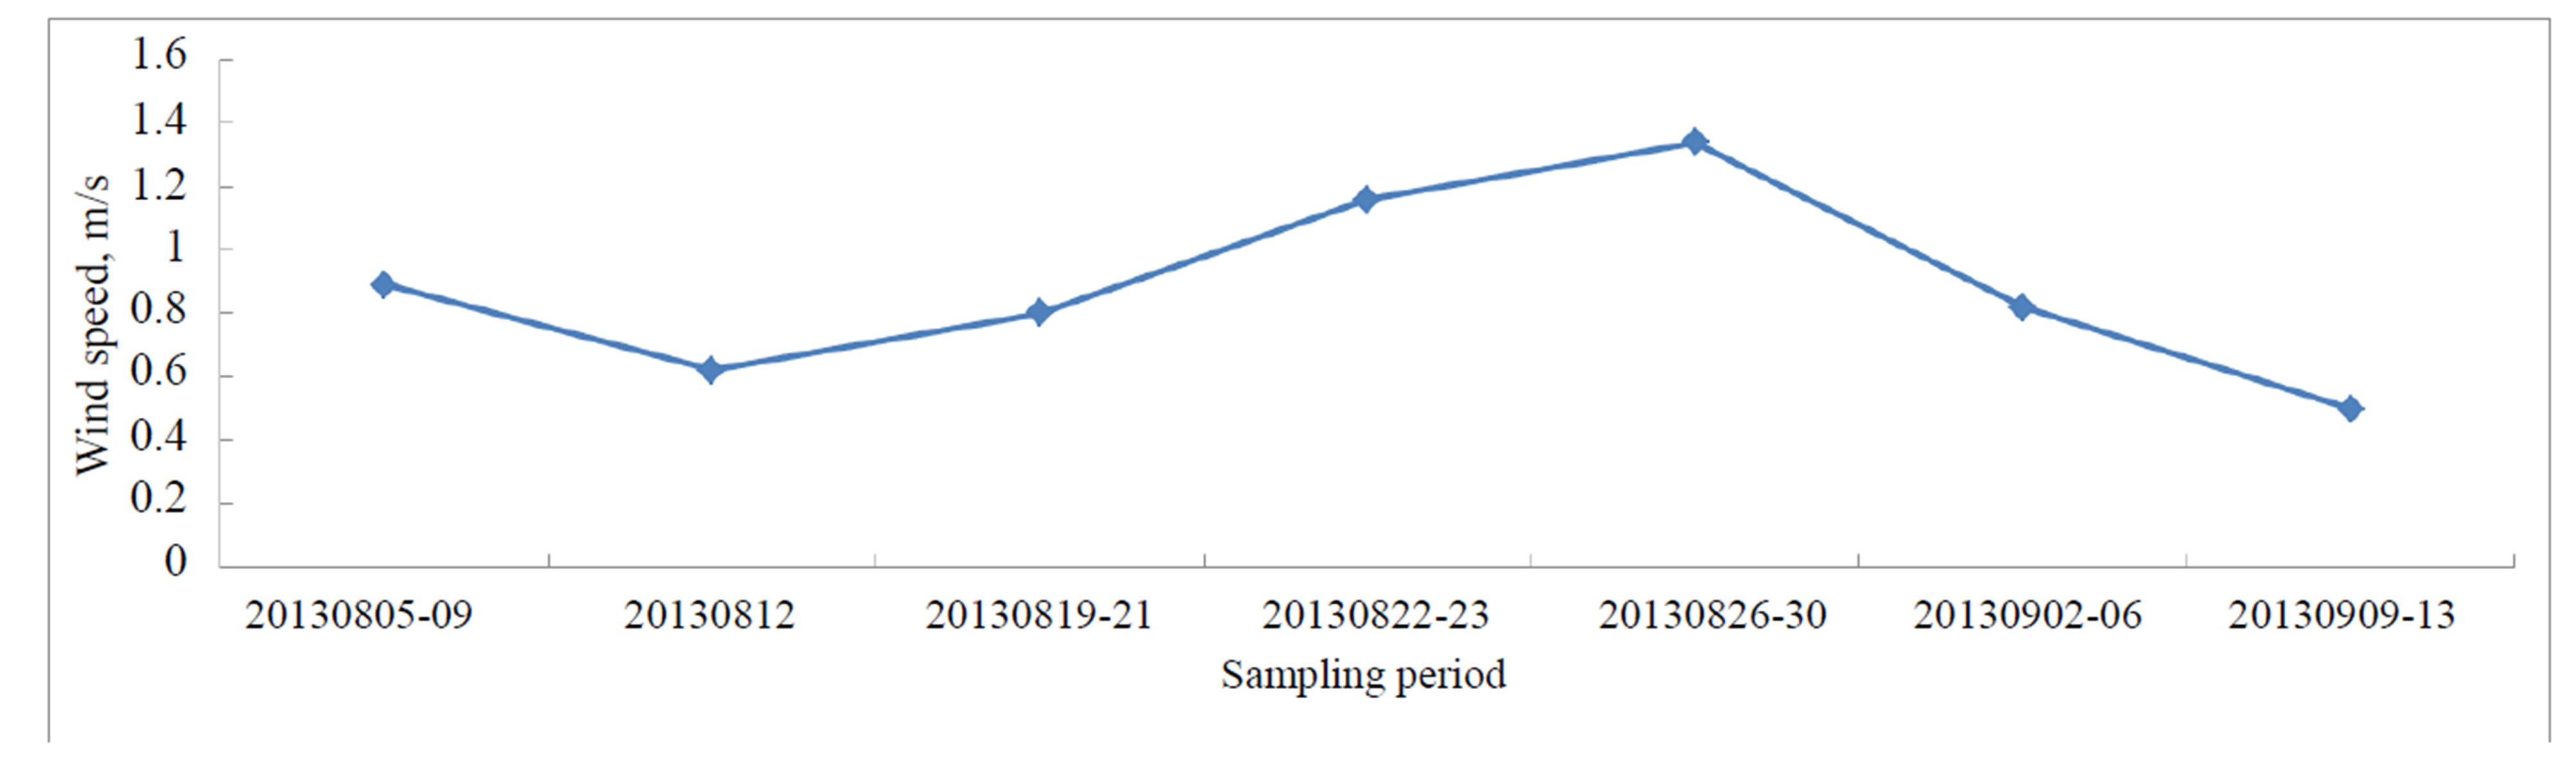 (c)
(c)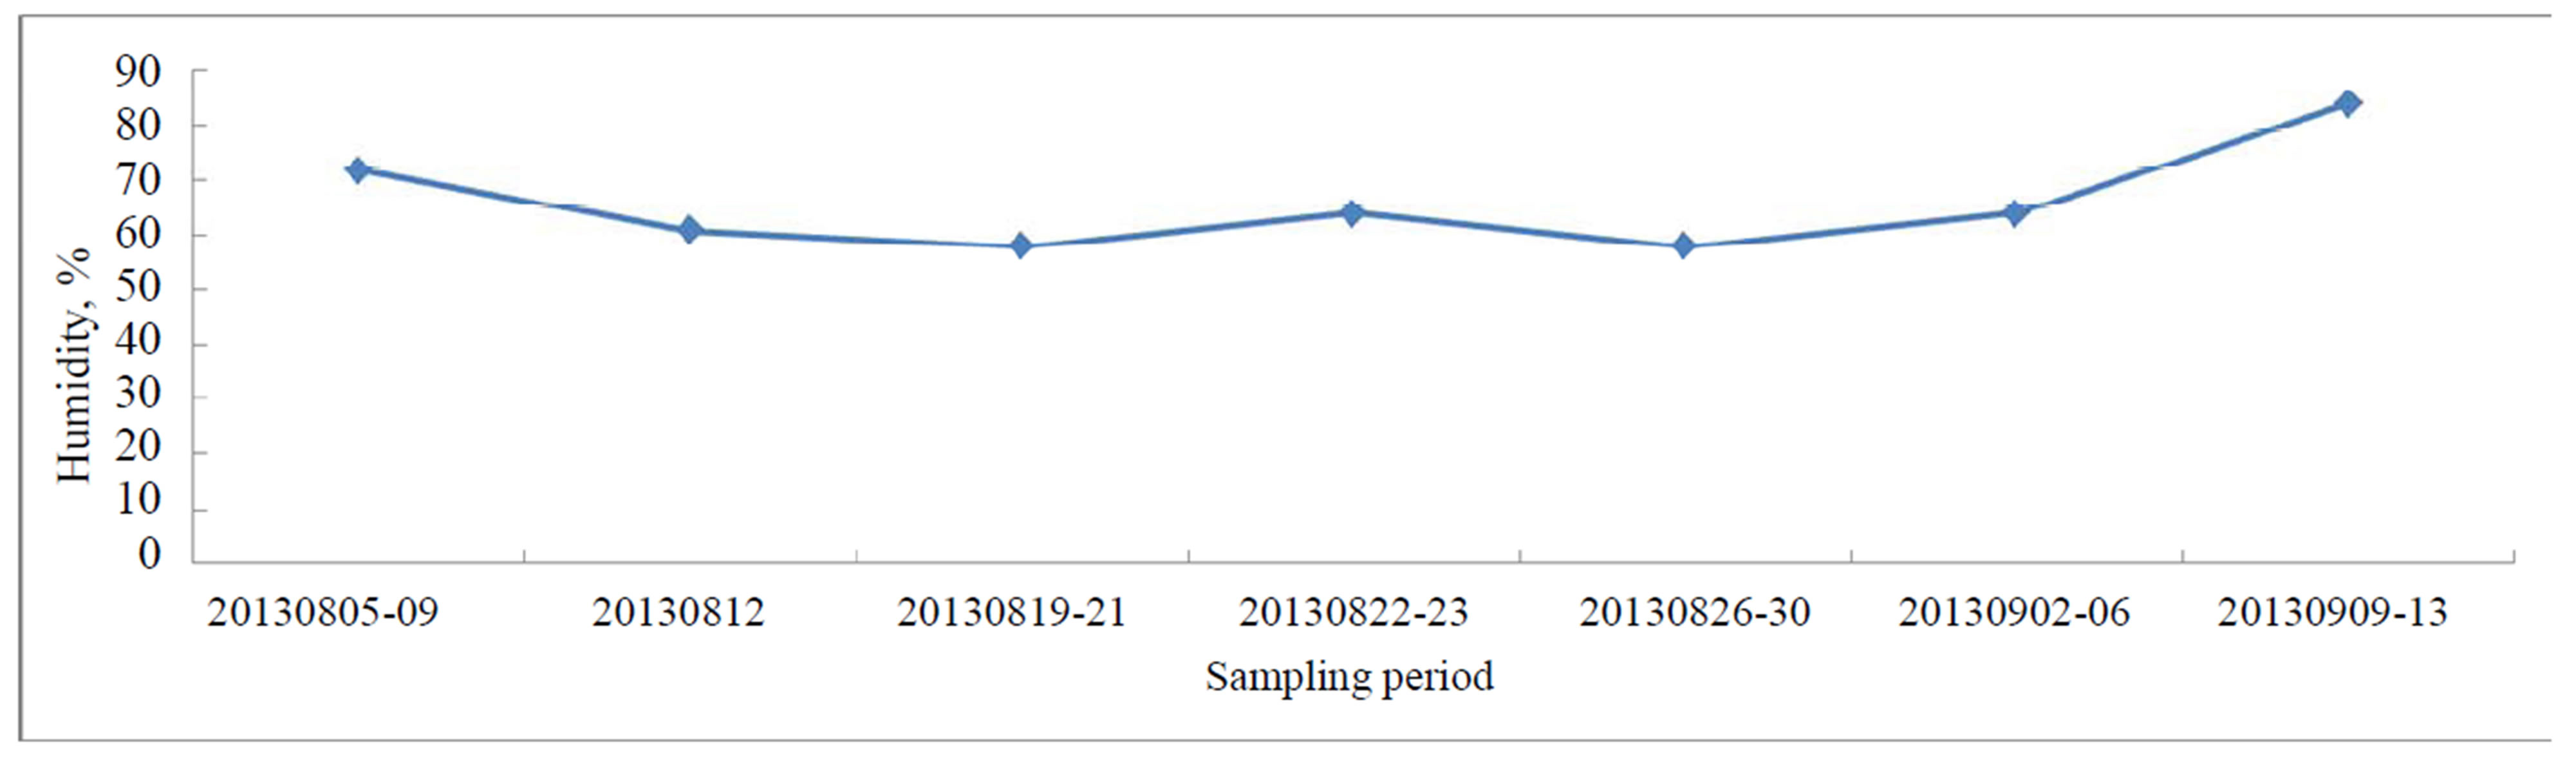 (d)
(d)
Figure 7. Average dust mass of all sampling points (a), moisture content (b), wind speed (c) , and outdoor humidity (d) versus sampling period.
the estimated cross section of dust cloud by simply assuming dust mass varies in the same pattern horizontally at different heights, and varies in the same pattern vertically over the width of dust cloud. The integrated values corresponding to the sampling periods were 6.2 kg/d, 6.5 kg/d, 5.8 kg/d, 5.6 kg/d and 5.6 kg/d. Therefore the average dust production during the measuring period is estimated to be 6 kg TSP/d. This value doesn’t include the dust generated due to the traffic travelling on the temporary roads.
Using Eq.1 with acre to mile conversion factor of 7.9 [8], the length of the road to the bridge of 0.1 km, PM10 amount was calculated to be 6.86 in a unit of kg/day. Based on sufficient field measurement, a typical ratio of 0.3 for PM10/TSP has been used by US EPA [18, 25]. The amount of TSP generated by the source was estimated to be 22.87 kg/d. This value includes all dust generation from construction works and traffic travelling on temporary roads. Therefore the dust emission for the road construction during the measurement periods is estimated to be 22.86 kg TSP/d and that is 6 kg TSP/d generated from construction works and 16.86 kg TSP/d from traffic travelling on temporary roads.
5. CONCLUSIONS
The study measured the dust emission from a road construction in Luleå, Sweden. The measurement was done by US EPA recommended exposure-profiling method using inexpensive BSNE dust samplers instead of high volume samplers. As estimated threshold wind velocities of surface materials were higher than measuring wind velocity, dust emission was only from mechanical construction works rather than wind erosion of surface material. Dust masses from 7 sampling periods indicated that dust emission was mainly influenced by moisture content of surface material which was a result of influences of several weather factors. Since no wind erosion happed, wind speed mainly affects the speed of dust transportation rather than the amount of dust generated. Due to the limited number of sampling points, dust masses that aren’t collected from dust data from all 7 sampling periods were able to find out the boundary of the dust cloud. A larger number of inexpensive BSNE samplers are strongly recommended to increase sampling point over the effective cross section of the dust cloud. The estimated dust emission rate for the construction work was 22.86 kg TSP/d, 6 kg/d was from construction work and 16.86 kg/d was generated due to traffic on temporary roads.
REFERENCES
- WRAP (2004) Definitions of dust. Western regional air partnership.
- US EPA (1995) Compilation of air pollutant emission factors. AP-42. 5th Edition, 13.2.3 Heavy Construction Operations. Research Triangle, Kansas City.
- Molvaer, T. (2009) Regulations for particulate matter pollution from heavy diesel machinery in urban areas-examples from Sweden, Denmark and Norway. Oslo.
- Phillips, R. (2006) Air pollution associated with the construction of Swedish railways. Banverket Norra Banregionen, Luleå.
- Johansson, C., Hadenius, A., Johansson, P.Å. and Jonson, T. (1999) The Stockholm study on health effects of air pollution and their economic consequences part 1. Stockholm Environment and Health Protection Administration, Stockholm.
- Edvardsson, K. (2010) Evaluation of dust suppressants for gravel roads: Methods development and efficiency studies. Doctoral Thesis at the Royal Institute of Technology, Stockholm.
- Gustafsson, M. (2011) Road dust-sources, properties and abatement strategies. Swedish National Road and Transport Research Institute, Linköping.
- Midwest Research Institute (MRI) (1999) Estimating particulate matter emissions from construction operations. Kansas City.
- US EPA (1977) Standards of performance for new stationary sources, revision to reference methods 1-8, federal register, Part II.
- US EPA (1998) Stationary source control techniques document for fine particulate matter. Research Triangle Park.
- US EPA (1993) An review of methods for measuring fugive PM-10 emission rates. Research Triangle Park.
- US EPA (1974) Development for emission factors for fugitive dust sources. Research Triangle Park.
- Goossens, D. and Buck, B. (2009) Dust emission by offroad driving: Experiments on 17 arid soil types, Nevada, USA. Geomorphology, 107, 118-138. http://dx.doi.org/10.1016/j.geomorph.2008.12.001
- Ghose, M.K. and Majee, S.R. (1998) Assessment of dust generation due to opencast coal mining—An Indian case study. Environmental Monitoring and Assessment, 61, 255- 263.
- Chaulya, S.K. (2006) Emission rate formulae for surface iron ore mining activities. Environmental Modeling and Assessment, 11, 361-370. http://dx.doi.org/10.1007/s10666-005-9026-2
- http://www.lulea.se/samhalle--gator/aktuella-projekt/planskild-korsning-gammelstad.html
- Fryrear, D.W. (1986) A field dust sampler. Journal of Soil and Water Conservation, 41, 117-120.
- Goossens, D. and Buck, B.J. (2012) Can BSNE (Big Spring Number Eight) samplers be used to measure PM10, respirable dust, PM2.3 and PM1.0? Aeolian Research, 5, 43-49. http://dx.doi.org/10.1016/j.aeolia.2012.03.002
- Shao, Y., McTainsh, G.H., Leys, J.F. and Raupach, M.R. (1993) Efficiencies of sediment samplers for wind erosion measurement. Australian Journal of Soil Research, 31, 519-532. http://dx.doi.org/10.1071/SR9930519
- Stout, J.E. and Fryrear, D.W. (1989) Performance of a windblown particle sampler. Transactions of the ASAE, 32, 2041-2045. http://dx.doi.org/10.13031/2013.31260
- Goossens, D. and Offer, Z.Y. (2000) Wind tunnel and field calibration of six Aeolian dust samplers. Atmospheric Environment, 34, 1043-1057. http://dx.doi.org/10.1016/S1352-2310(99)00376-3
- Goossens, D., Offer, Z.Y. and London, G. (2000) Wind tunnel and field calibration of five Aeolian sand traps. Geomorphology, 35, 233-252. http://dx.doi.org/10.1016/S0169-555X(00)00041-6
- Sharrat, B., Feng, G. and Wendling, L. (2007) Loss of soil and PM10 from agricultural fields associated with high winds on the Columbia Plateau. Earth Surface Processes and Landforms, 32, 621-630. http://dx.doi.org/10.1002/esp.1425
- Sharrat, B. (2011) Size distribution of windblown sediment emitted from agriculture fields in the Columbia Plateau. Soil Science Society of America Journal, 75, 1054- 1060. http://dx.doi.org/10.2136/sssaj2010.0337
- US EPA (1995) Compilation of air pollutant emission factors. AP-42. 5th Edition, 13.2.5 Industrial Wind Erosion, Research Triangle, Kansas City.
- Chepil, W.S. (1952) Improved rotary sieve for measuring state and stability of dry soil structure. Soil Science Society of America Proceedings, 16, 113-117. http://dx.doi.org/10.2136/sssaj1952.03615995001600020001x
- Chepil, W.S. (1958) Soil conditions that influence wind erosion. Technical Bulletin, 1185, 1-40.
- http://www.epa.gov/region9/air/phoenixpm/define.html