Natural Science
Vol.5 No.2A(2013), Article ID:28352,9 pages DOI:10.4236/ns.2013.52A038
Effects of change of use of land on an aquifer in a tectonically active region
![]()
1Pg Postgraduate Applied Geoscience, Potosin Institute of Scientific and Technological Research, San Luis Potosí, México; *Corresponding Author: simon.carranco@ipicyt.edu.mx
2Applied Geoscience Division, Potosin Institute of Scientific and Technological Research, San Luís Potosí, México
3Faculty of Engineering, Autonomous of San Luis Potosí (UASLP), San Luis Potosí, México
4The College of San Luis, San Luis Potosí, México
5Geoscience Center, Campus Juriquilla, Juriquilla, México
Received 21 December 2012; revised 20 January 2013; accepted 5 February 2013
Keywords: Land Use; Faults; GIS; Drawdown; Remote Sensing
ABSTRACT
This paper shows the effects caused by the combination of two factors: an anthropic factor and one natural. The leading causes of imbalance in the subsoil due to drawdown of the aquifer is reflected on the surface with the appearance of cracks on ground, then came the lateral and vertical movements called faulting. This geological phenomenon is due to a pattern of orientation is associated with a regional fault system, lateral movement is almost imperceptible but the vertical displacement becomes important because it is the most conspicuous and be responsible for the damage caused to the urban infrastructure, vertical faulting is related to the drawdown generated by intense extraction of groundwater. The demand for groundwater, increasing year by year in the past four decades because of the change in land use, the most significant change was the shift from rain feed crop to irrigated crop agriculture, this change in land use occurred on Celaya’s Valley between year period 1976-2009 was quantified by use of remote sensing and geographic information systems (GIS).
1. INTRODUCTION
In the case of land use changes, remote sensing is a valuable tool of management of spatial information and its usefulness has been demonstrated in many parts of the world [1].
In many regions agriculture is considered as the main activity. For the development of agricultural areas should have three characteristics: proximity to rivers or lakes, settled in vast plains and having fertile lands. Under this context, agriculture in Central Mexico, in the study area, was initially developed in the Valley of Santiago. However, this area was not part of the route of the proceedings of the New Spain, main cause which motivated the development of agriculture on the Valley of Celaya [2].
Agricultural activity in the Valley of Celaya, home with rain fed crops, this implied 1) only it sowed in times of rain and 2) not be towards use of groundwater. Seasonal Agriculture spread throughout the Valley, but due to the demand for food by the population growth in the city of Celaya and neighboring towns, it was necessary to accelerate and increase agricultural production, beginning to irrigate crops with groundwater [3]. For the Decade of the 50’s, in the majority of plots were still cultivating only in the rainy season and very few plots were toward use of water extracted from the subsoil. The disproportionate increase of the emergence of new wells and the intensive extraction of groundwater highlighted its first negative effect on the ground. In the years 70’s, cracking occurred in the soil as a result of the over exploitation of water [4]. Subsequent studies of regional geology, showed that a portion of the Valley of Celaya was affected by fault Taxco-San Miguel de Allende System [5,6]. This system of faults with NNW-SSE orientation crosses cities of Taxco, Toluca, Celaya, Queretaro and San Luis Potosi. Much has been the speculation on sinking of the Celaya region processes relating to the increase of the extraction of underground water for agricultural purposes.
This work aims to establish the relationship between land use change and subsidence processes observed in the urban area. In this work was carried out an analysis of change of soil use from Landsat satellite images MSS and TM to cover a period of time that goes from 1976 until 2011. The results of image processing, were integrated through a system of geographic information (GIS), with data of lithology, structural geology and hydrogeology.
2. GEOLOGICAL SETTING
The study area is located in the State of Guanajuato, in the central part of Mexico, lies within the physiographic Province called the Neovolcanic axis (Figures 1 and 2), that is characterized by a volcanic chain of plioQuarternary Age volcanic chain which extends from the Ocean Pacific to the West of the country, to the Gulf of Mexico.
2.1. Stratigraphy
The oldest rock in the study area corresponds to the lower Cretaceous Metamorphic (schists). Above these metamorphic rocks are clayey limestones and Shales of the Cretaceous Soyatal Formation. The sedimentary rocks of the Cretaceous are covered by (ignimbrites and rhyolites) felsic volcanic rocks of the oligocene-miocene
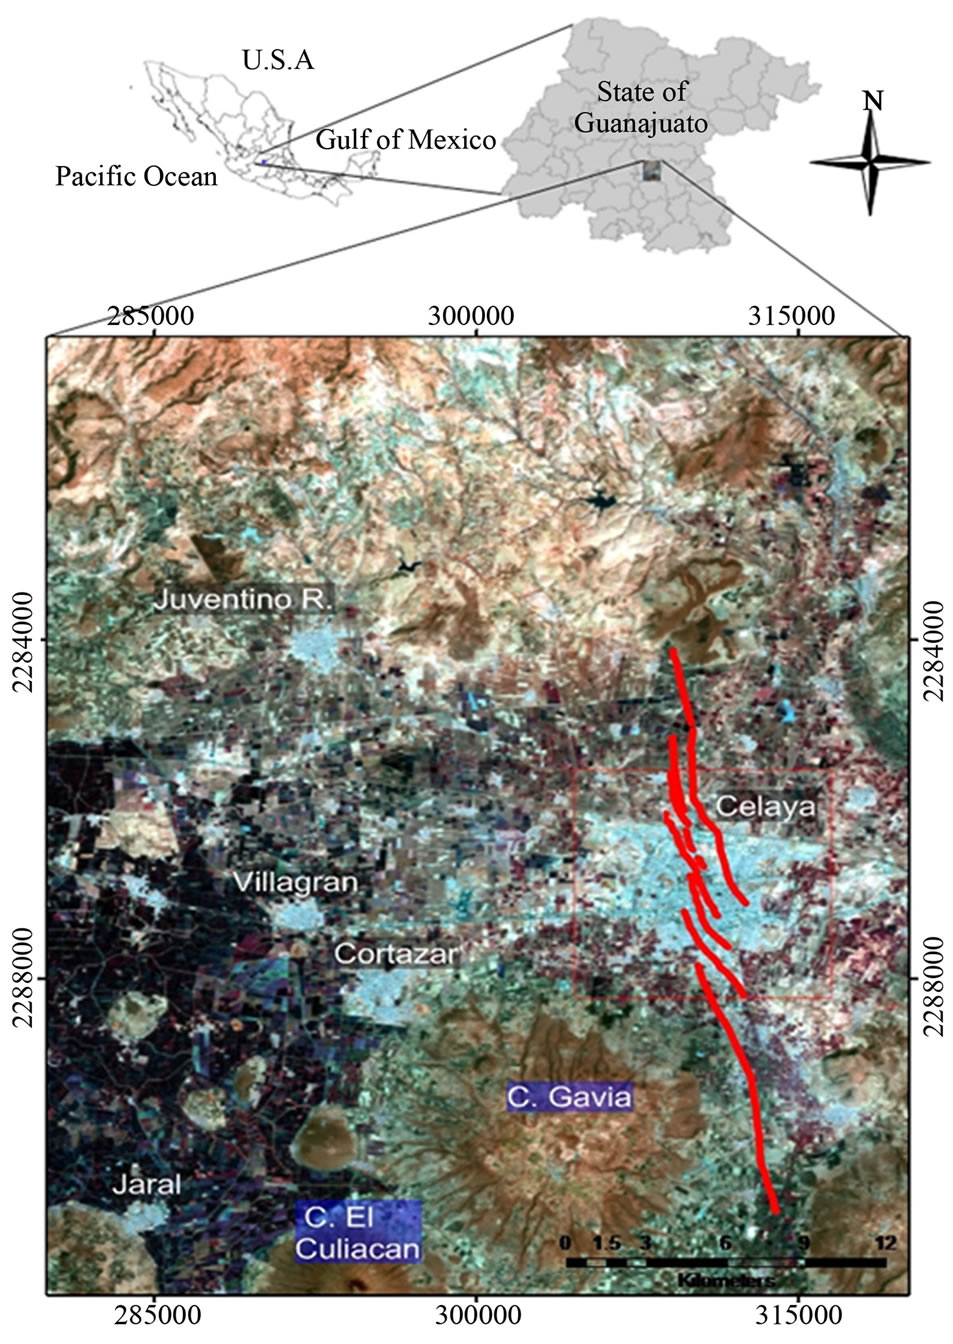
Figure 1. Location of the study area.
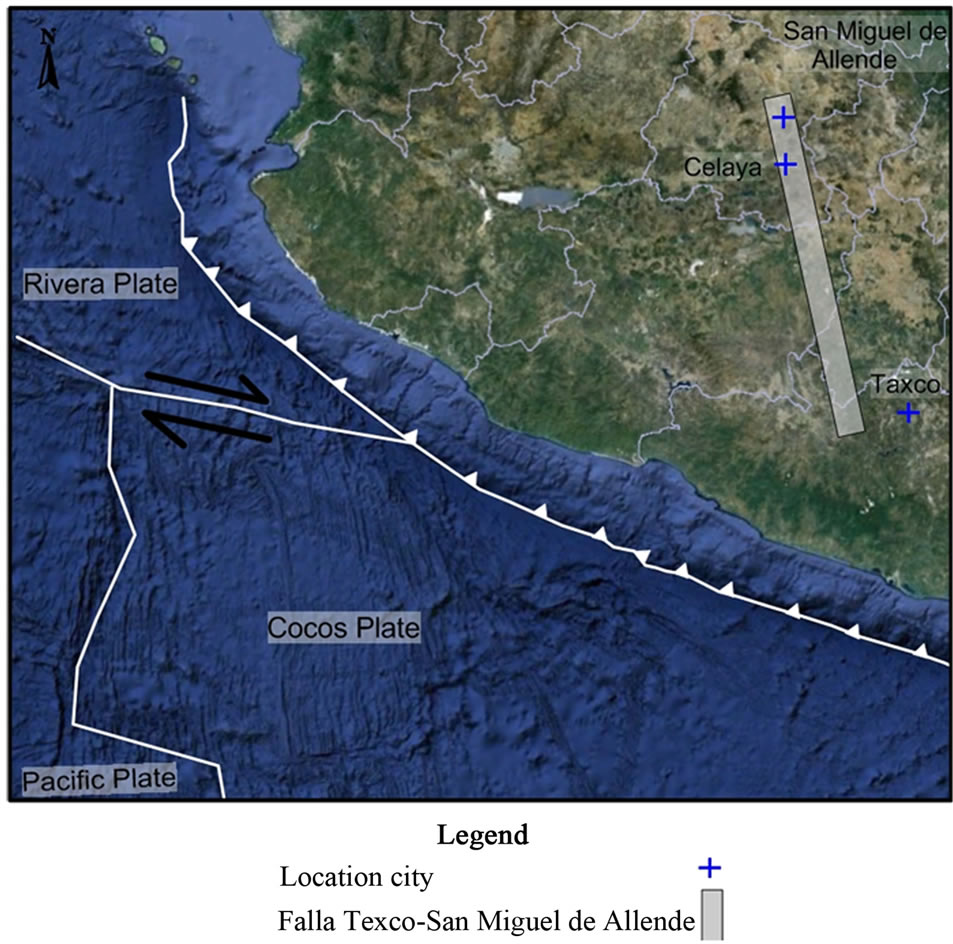
Figure 2. Taxco-San Miguel de Allende fault system.
reaching thicknesses of 600 m. Since the Valley is of tectonic origin, collapsed, volcanic rocks are covered by continental deposits (sandstones and conglomerates) with a thickness of 300 m. The last volcanic activity (basalts) occurred during the Quaternary. Finally, Quaternary clayey deposits cover the Valley, reaching 150 m thick (Figure 3).
2.2. Structural Geology
The vertical forces that cause fracturing the rock are due to the internal movements of the Earth’s crust which in turn cause deformation, cracks and faulting in the rock.
The structural geology of Celaya Valley lies within what is known as the Neovolcanic axis, reason why there are numerous faults in this area. The study area is affected by various systems of faulting, one belonging to the system Taxco-San Miguel de Allende orientation NNW-SSE [6], which passes through the center of Mexico, another fault with orientation system E-W is associated with the Transmexican Volcanic Belt. Normal type faults are reported in the study area (Figure 3(b)), similar to the system oriented Taxco-San Miguel.
In the city of Celaya at the end of the 70’s, were appreciated for the first time cracks and subsidence affecting urban infrastructure, mainly, was in these years that a study was begun to determine the cause of the cracking, within the results, it was determined that in the city the largest differential movement was 60 cm, currently the displacement is 3.5 m, these normal faults remain active and glide at a speed of 15 cm a year.
There are six normal faults that have records: 1) Fault
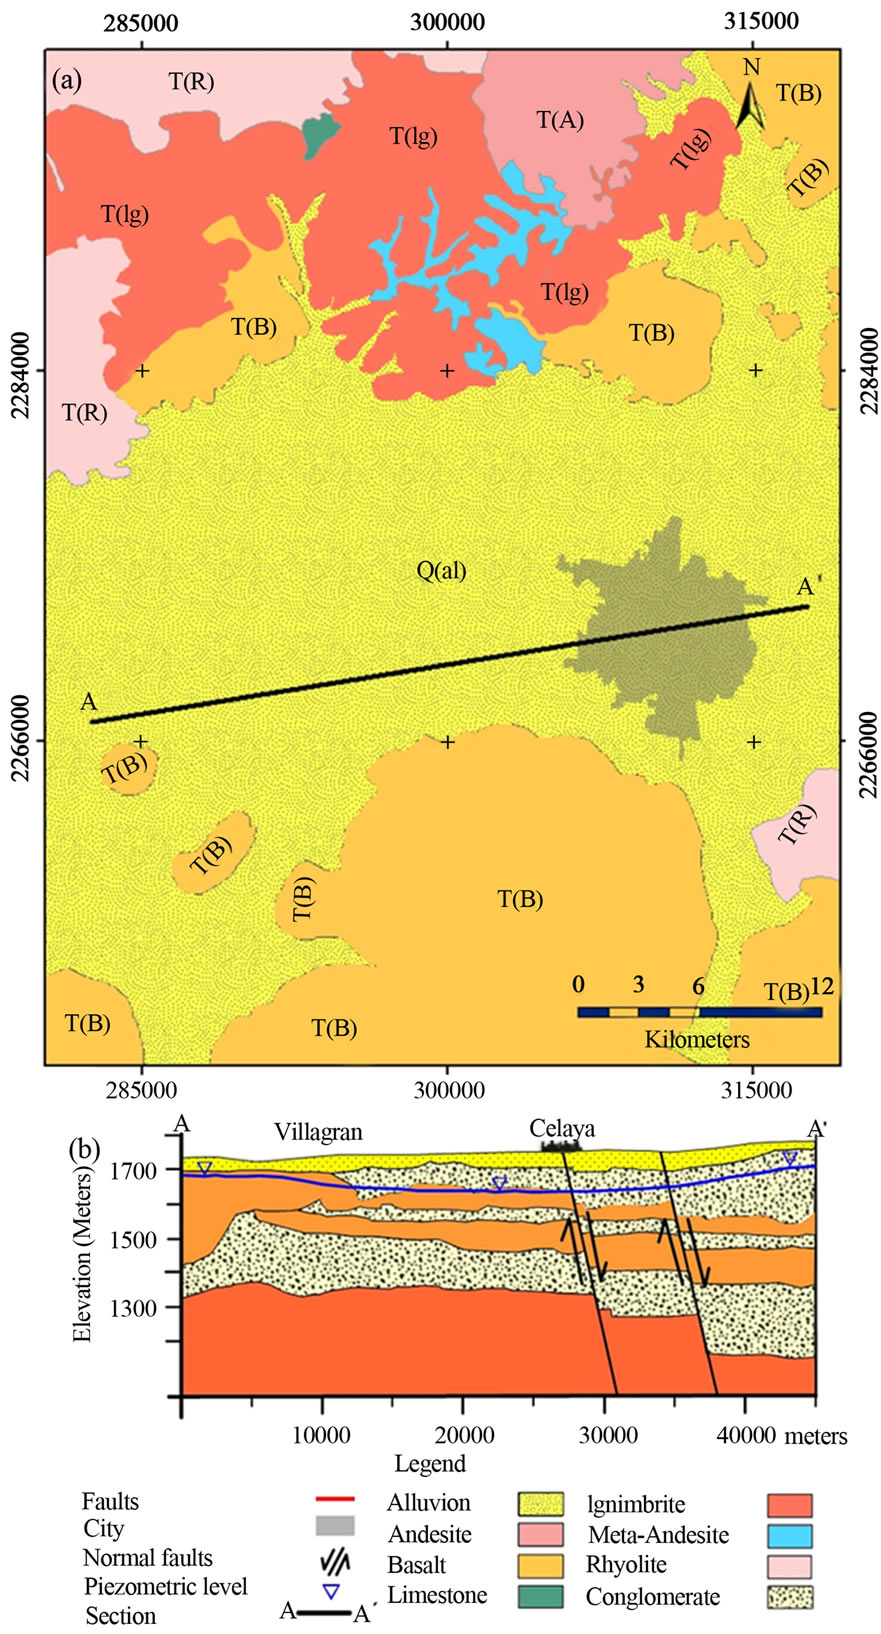
Figure 3. (a) Map shows the distribution of the different geological units in the Valley of Celaya, with rocks coming from the Cretaceous to Quaternary. (b) Geological section, which passes through the Valley of Celaya from East to West.
Pradera de la Hacienda, 2) Failure La Corona, 3) Gobernadores fault, 4) Fault Universidad Pedagógica, 5) Fault Insurgentes and 6) Mercado de Abastos fault, these six mentioned are only visible within the urban area, the continuation that have these faults to the North and South of the city, on the agricultural zone is evident, however, because the soil is removed constantly affected agricultural land leveling, you can not specify a rate of displacement.
3. HYDROGEOLOGY
According to the stratigraphy of the Celaya Valley is found as a shallow layer, alluvial deposits and chipboard polymictic which functions as a free aquifer with small thickness. The main aquifer is mainly constituted by fractured volcanic rocks whose thickness may exceed 300 m [3]. Some hills of basalt, with morphology of volcanic cone delimit the Valley of Celaya, they are favorable because they behave as a recharge area and because they are highly fractured and allows rapid infiltration. The geological formations that function as aquitards due to their low permeability are; Formation Soyatal-Mezcala formed by clayey limestones and shales of the lower Cretaceous.
3.1. Increasing of Wells on the Aquifer of Celaya
Celaya Valley aquifer is one of the largest aquifers that exist in the State of Guanajuato because of its number of wells. The oldest well reported in the Valley of Celaya is known as Bola de Agua was one of the first wells drilled in the year of 1910, to supply the population of Celaya, when this well was drilled the water raised 2 m above the ground level. By the year of 2009 the depth of the static level reached 110 m [3]. The density of wells was growing over the years, only to 1970 there were approximately 1032 wells, by the year of 1990 reported a total of 1897 wells (Figure 4) of which the 0.26% were abandoned, the 0.42% were used for watering holes, the 94.80% for agricultural use, the 2.37% were for household use and finally the 2.11% were used in drinking water for the city [7], in 1999, surveyed 2162 wells, and the 1.99% were abandoned, the 1.06% were used even as a watering hole, the 84.18% were for agriculture irrigation, 2.08% were to domestic use, the 7.59% were for drinking water, the 2.59% of the wells were used for the industry and finally the 0.51% of the wells were used for
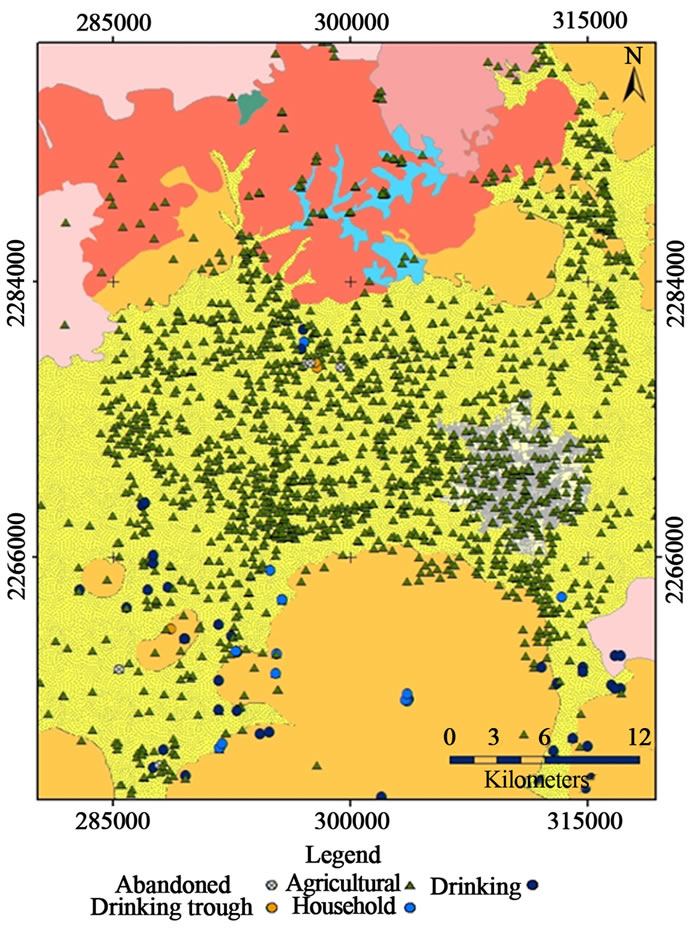
Figure 4. The density of wells increased to 1897 by the year of 1990.
recreational use [8]. The National Commission of Water (CNA), in 2003 reported the existence of 2948 wells and only 2441 were active; they were classified in three categories, agriculture with a total of 1830, public supplying 540 and industrial with 71 wells.
3.2. Evolution of Drawdown
With regard to the lifting of the static level, in the year of 1956, there were so many alterations to the aquifer and the number of wells did not exceed 100 (Figure 4). Agricultural activity and the development of the aquifer were located mainly in the central part of the Valley and another area where there was this same development was to the West of the city of Celaya. The extraction of groundwater in the Valley initiated the formation of a small drawdown elongated of orientation NW to SE. Figure 5 shows to the northeast of the study area, high piezometric of 1760 meters above sea level (MASL), indicating an important recharge area (Figure 5(a)).
Census of 1990, the CEASG reports 1897 wells in the
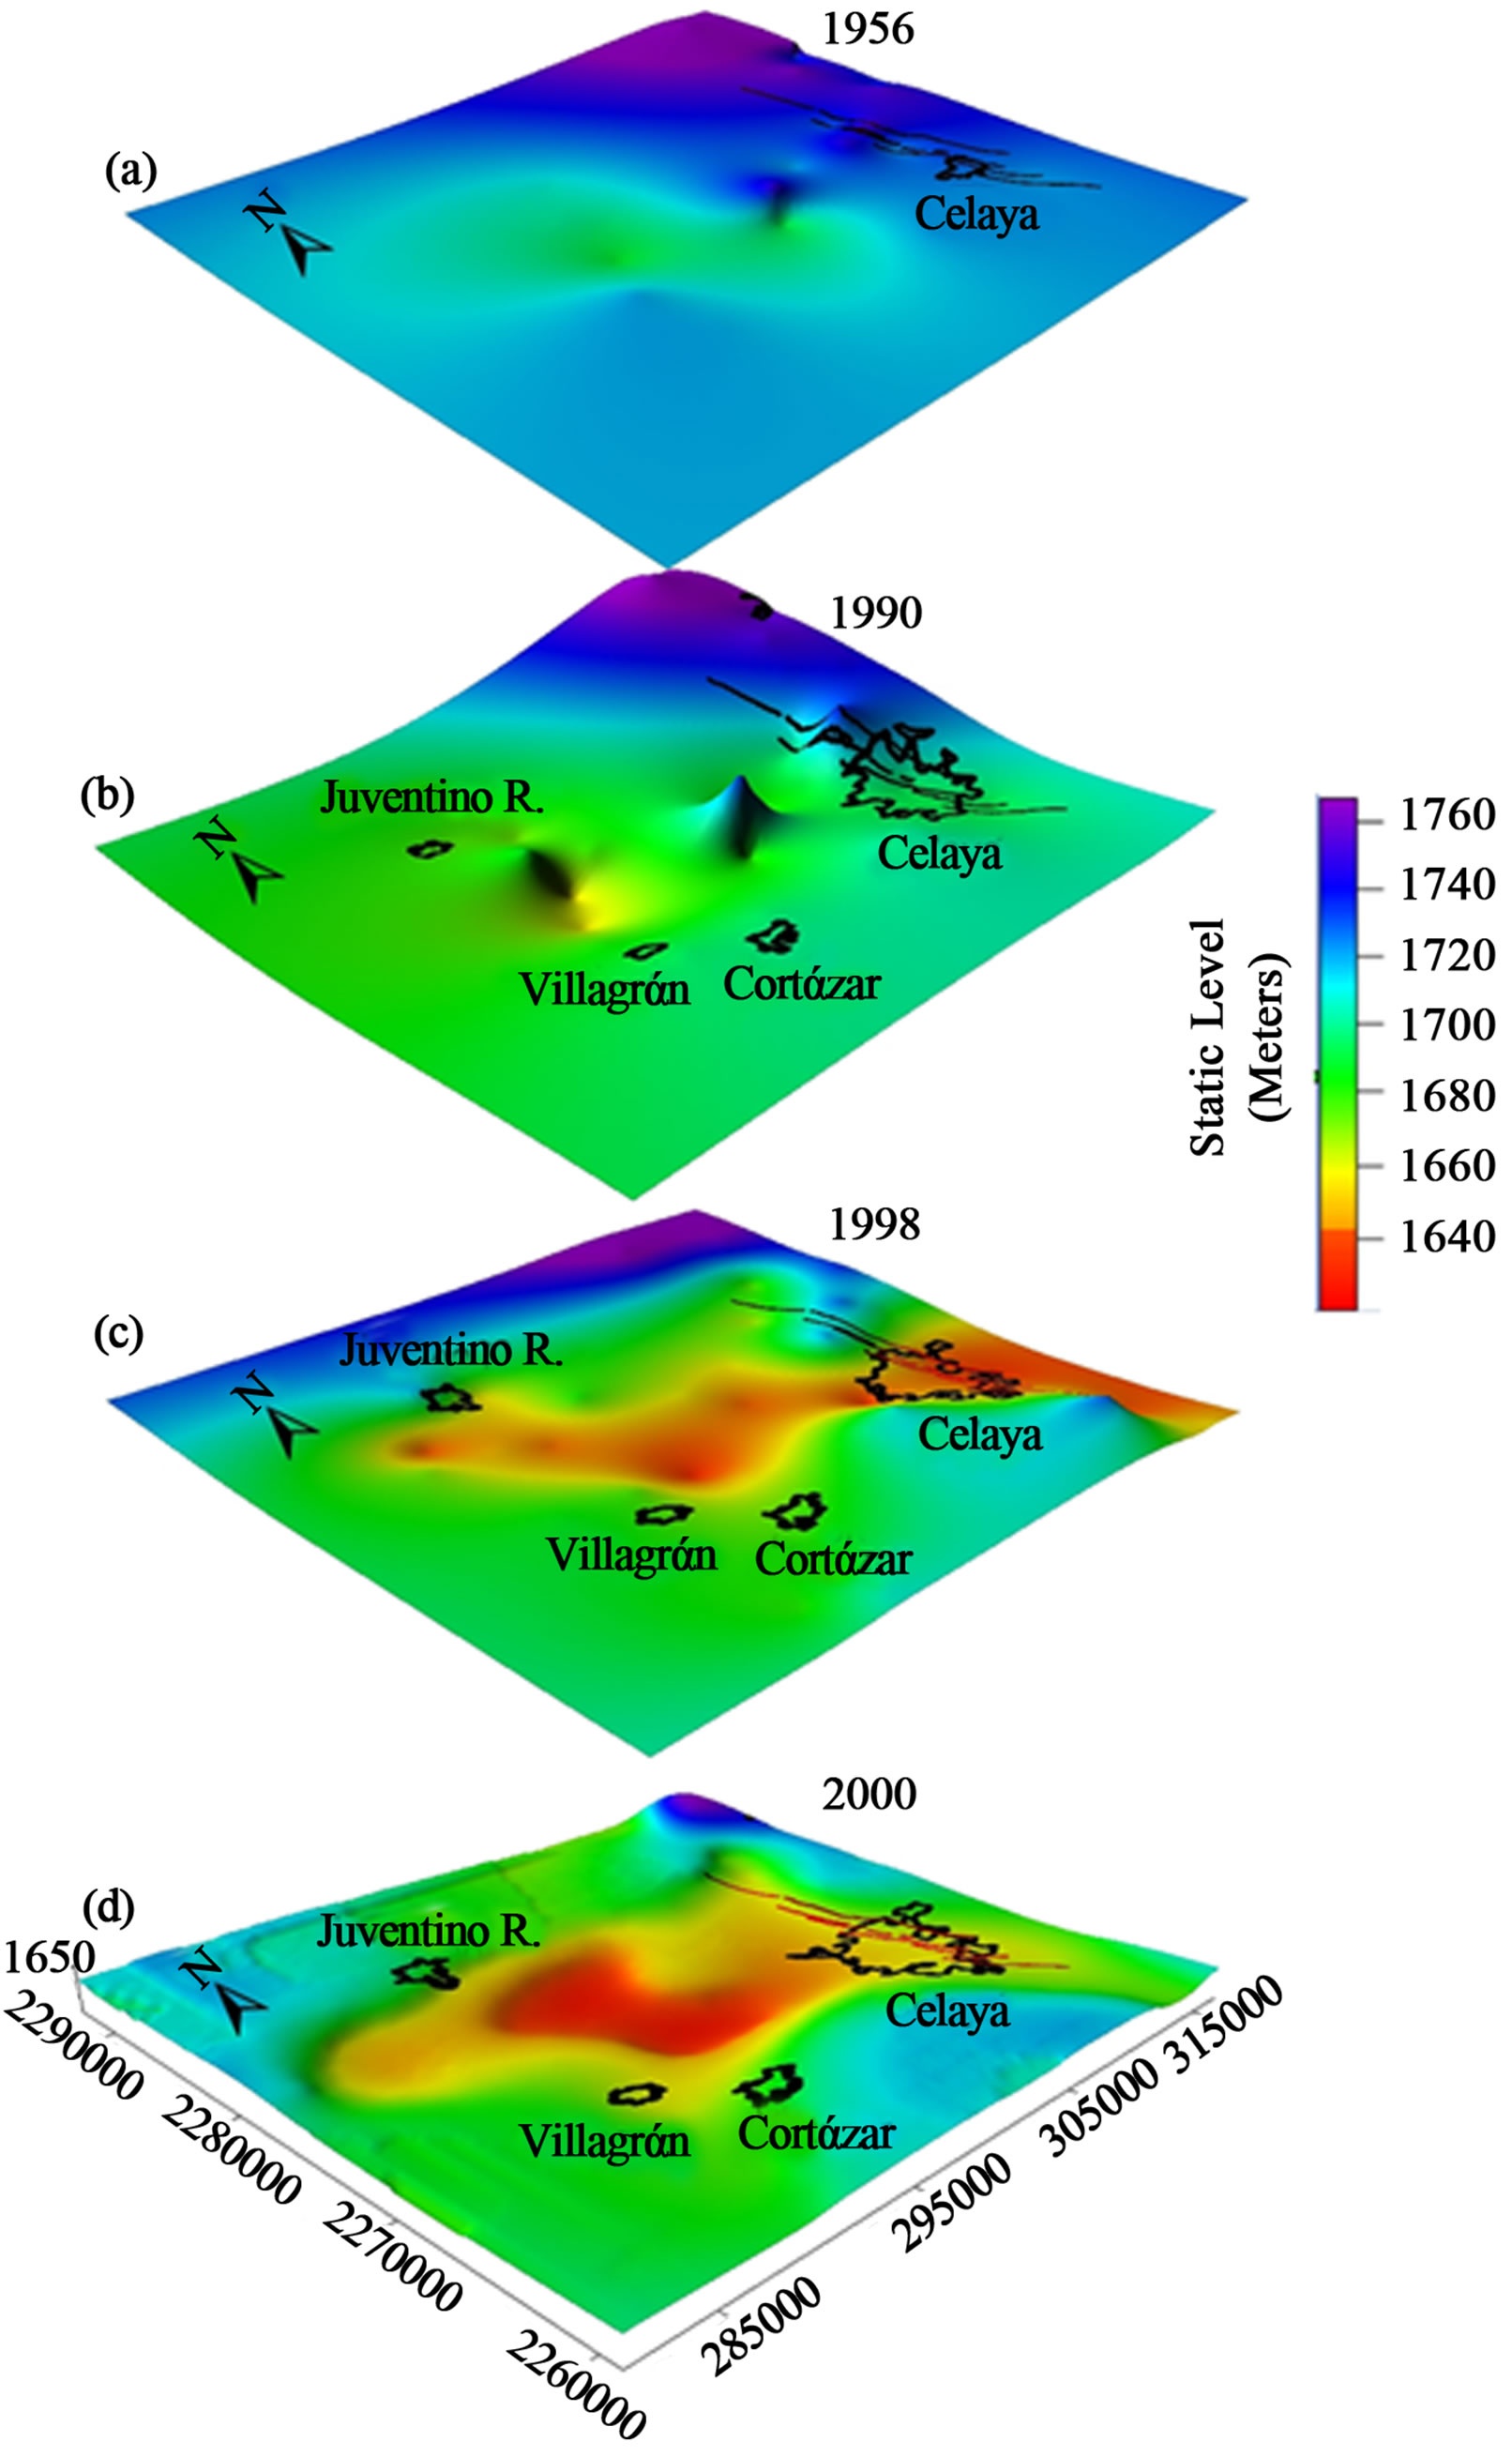
Figure 5. Distribution of piezometry by the end of the 50’s. (a) recharge zones occur where the elevation of the static level is high; (b) panorama of 1990 where the drawdown reaches the city of Celaya; (c) in 1198 drawdown has more definition in the Valley; and (d) in 2000 the drawdown shows recovery in Celaya and significant decreases in Villagran.
Valley of Celaya. The piezometry shows a greater extension of the drawdown that reaches the city of Celaya (Figure 5(b)), with a low piezometric level (1678.45 MASL) and in addition, a general decrease of the Valley piezometric levels.
With an increase in a period of eight years, the number of wells increased to 2162 on the year 1998, the drawdown defined towards the center of the Valley, taking an elongated form with directions NW-SE which passes through the city of Celaya (Figure 5(c)).
In the 2000 census, the number of wells had no significant variations and the drawdown displayed a recovery of its levels towards Celaya; however, towards Villagran, the drawdown had significant declines (Figure 5(d)).
4. METHODOLOGY
In this work was necessary the use of Remote Sensing which is the science of obtaining information in the indirect form of an object through a sensor. For this it is necessary to have a source of energy, an object that reflects, absorbs or transmits energy, and a sensor that receives the information of the objects [9,10]. The main contribution of this discipline is the extraction of data from large tracts of land in a short time. For the assessment of land use change were used Landsat MSS and Landsat TM images to have a temporary covering of 1976-2011 (Table 1). The images were downloaded from the site http://glovis.usgs.gov. A digital elevation model (DEM) was also used to obtain a better discrimination of classes based on elevation and land texture.
The methodology developed in this work consists of pre-processing stage and the stage of processing (Figure 6). The first stage is to apply correction techniques to satellite images to later extract information based on spectral or textural characteristics of the different surfaces of the land. The main processes that are conducted at this stage are; geometric correction of the original bands of the Landsat images, with the purpose of obtaining a good overlap between the data obtained from Landsat MSS, Landsat TM and DEM images. In addition for each satellite image was performed radiance calculation
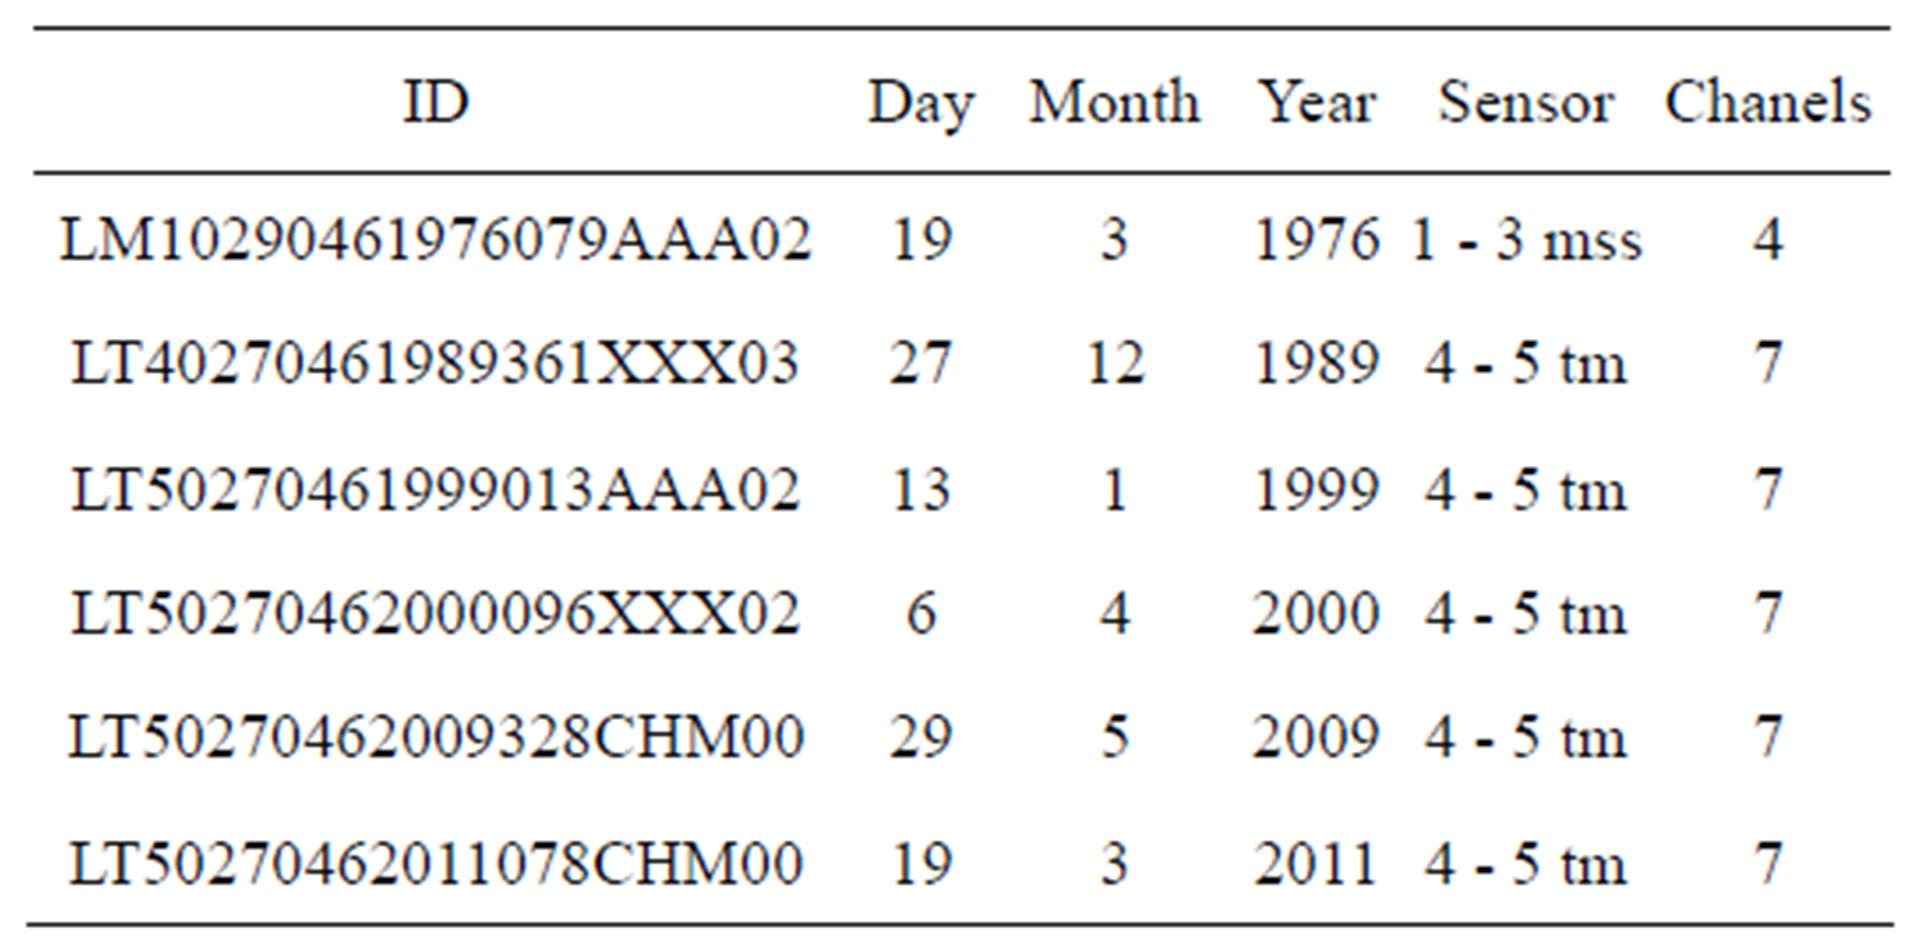
Table 1. Scenes Landsat (TM and MSS), used in research.
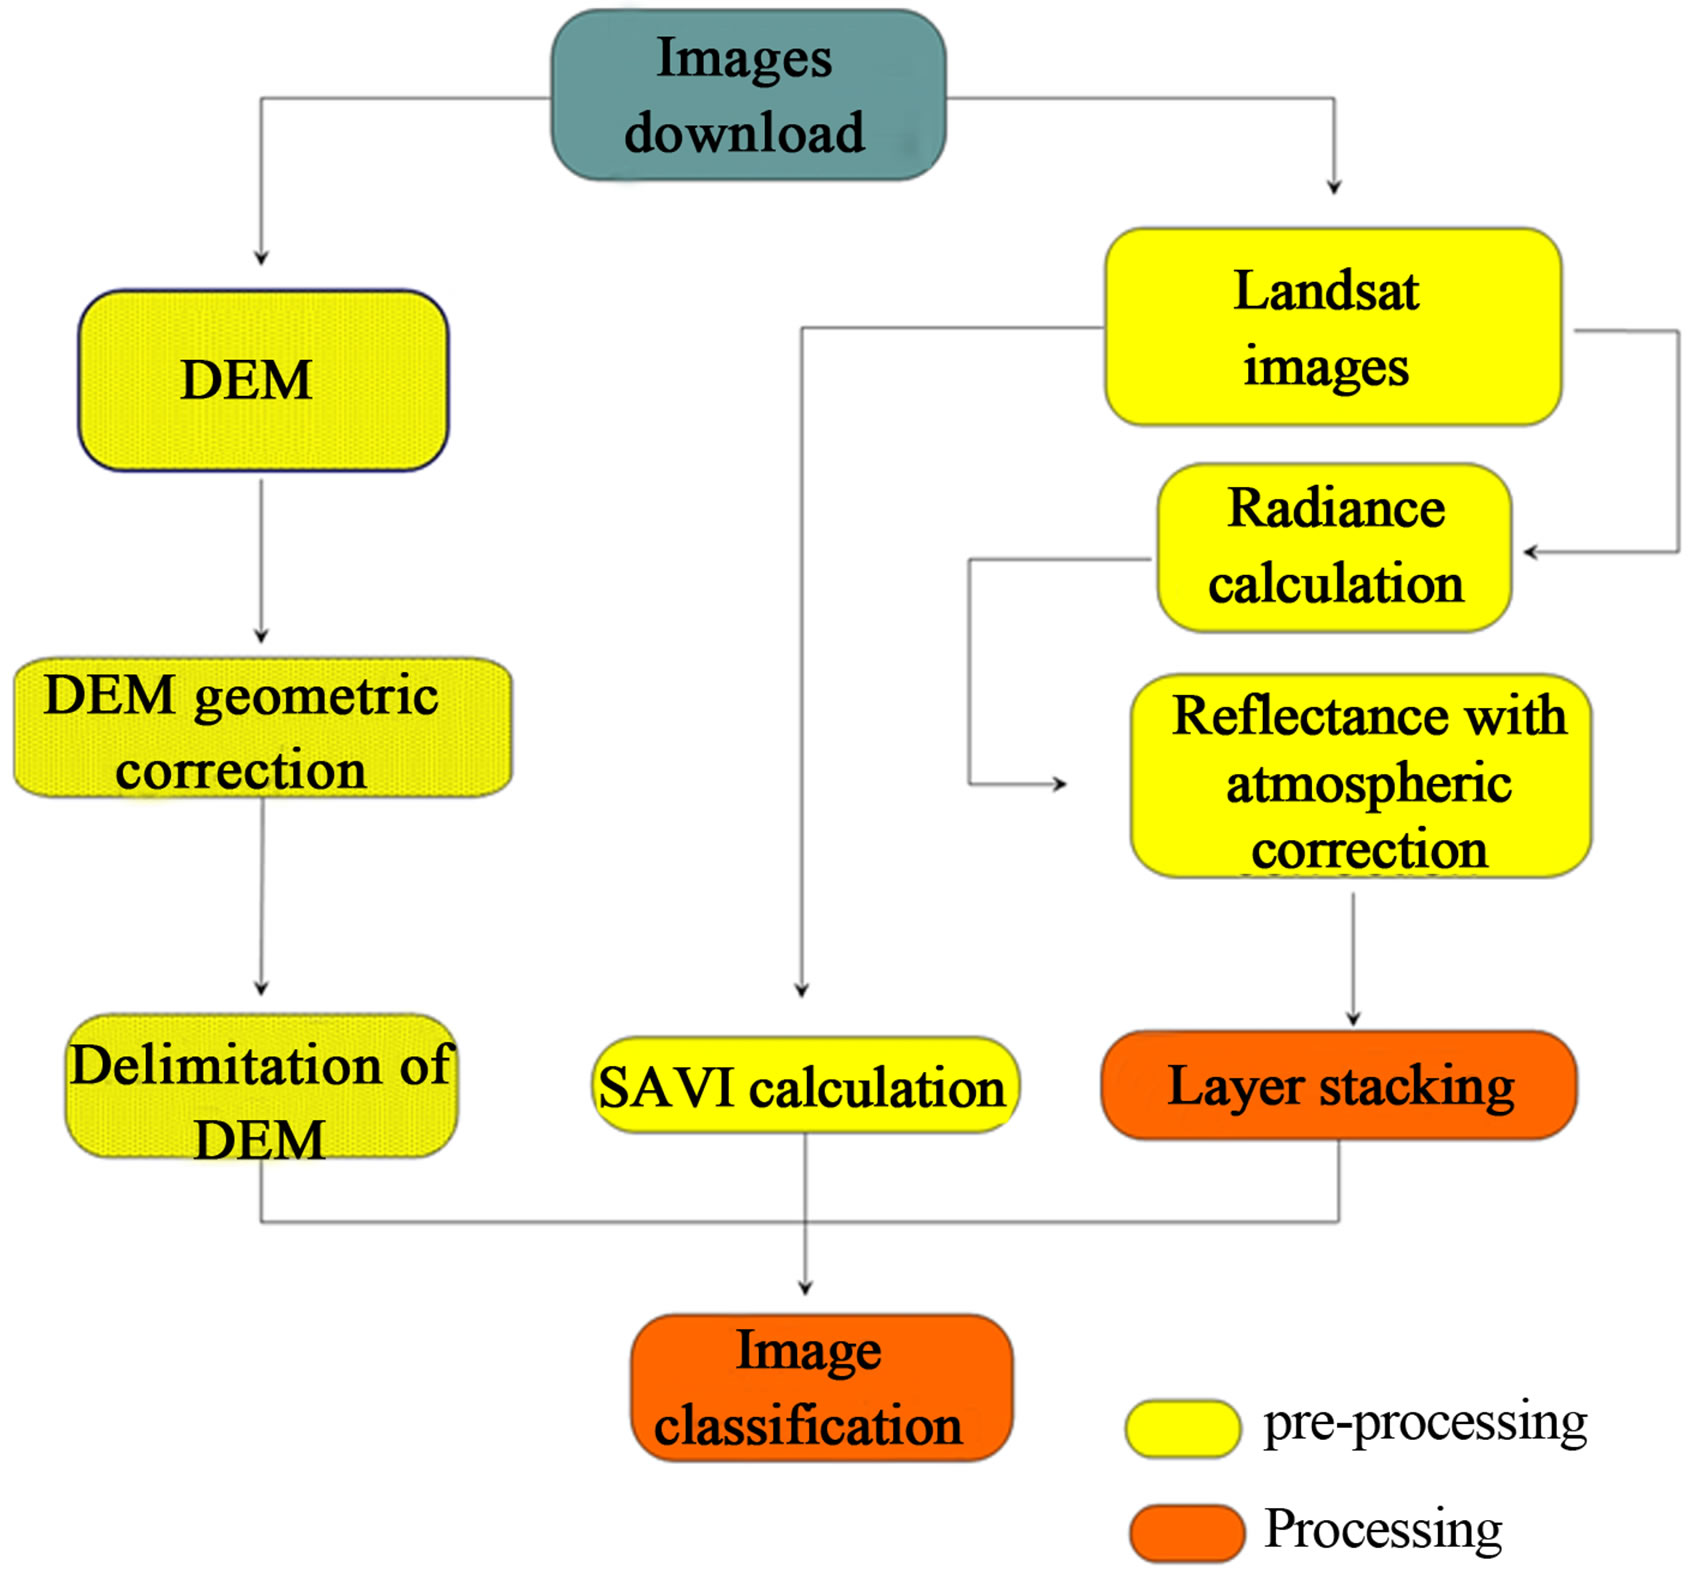
Figure 6. Methodology applied to the treatment of the Landsat MSS, Landsat TM images.
and from these data atmospheric correction was made, with which images with reflectance data were obtained. For radiometric correction the calibration of Chander and Markham (2003) data were taken. Missing data in the DEM were obtained by interpolation, applying the nearest neighbor method.
Several techniques for data extraction were applied in the processing stage, among them are the analysis of spectral signatures to identify the different coverages of soil and vegetation Soil-Adjusted Vegetation index (SAVI) to separate different types of vegetation based on the presence of chlorophyll and humidity which are related to the vigour of the vegetation [11]. The results of these operations were used as input data for the classification made on each satellite image (Figure 6).
The classification of satellite images was performed using the technique of the decision tree also known as “Induction using decision trees” ID3. The basic idea of the ID3 is to determine for a set of data, the most important attribute, i.e. that which has the greatest discriminating power for a set. This first attribute is associated with the values of the set and it is used to perform an initial partition in the classification. After the first test attribute, this threw a result, which is in itself a new learning problem of the decision tree, with the difference that it will have fewer elements and one attribute less, thus, each attribute that is selected is discarded for the next test. The way in which develops the ID3 classification is by the principle of binomial math (Figure 7). For the classification were assigned six classes according to the characteristics of each scene and taking into account the nomenclature of the Instituto Nacional de Estadística y Geografía (INEGI). These six classes are: Water bodies (w), Scrub (Sc), Irrigated crop (Ic), Rain feed crop (Rc), Soil without vegetation (S) and Urban (U).
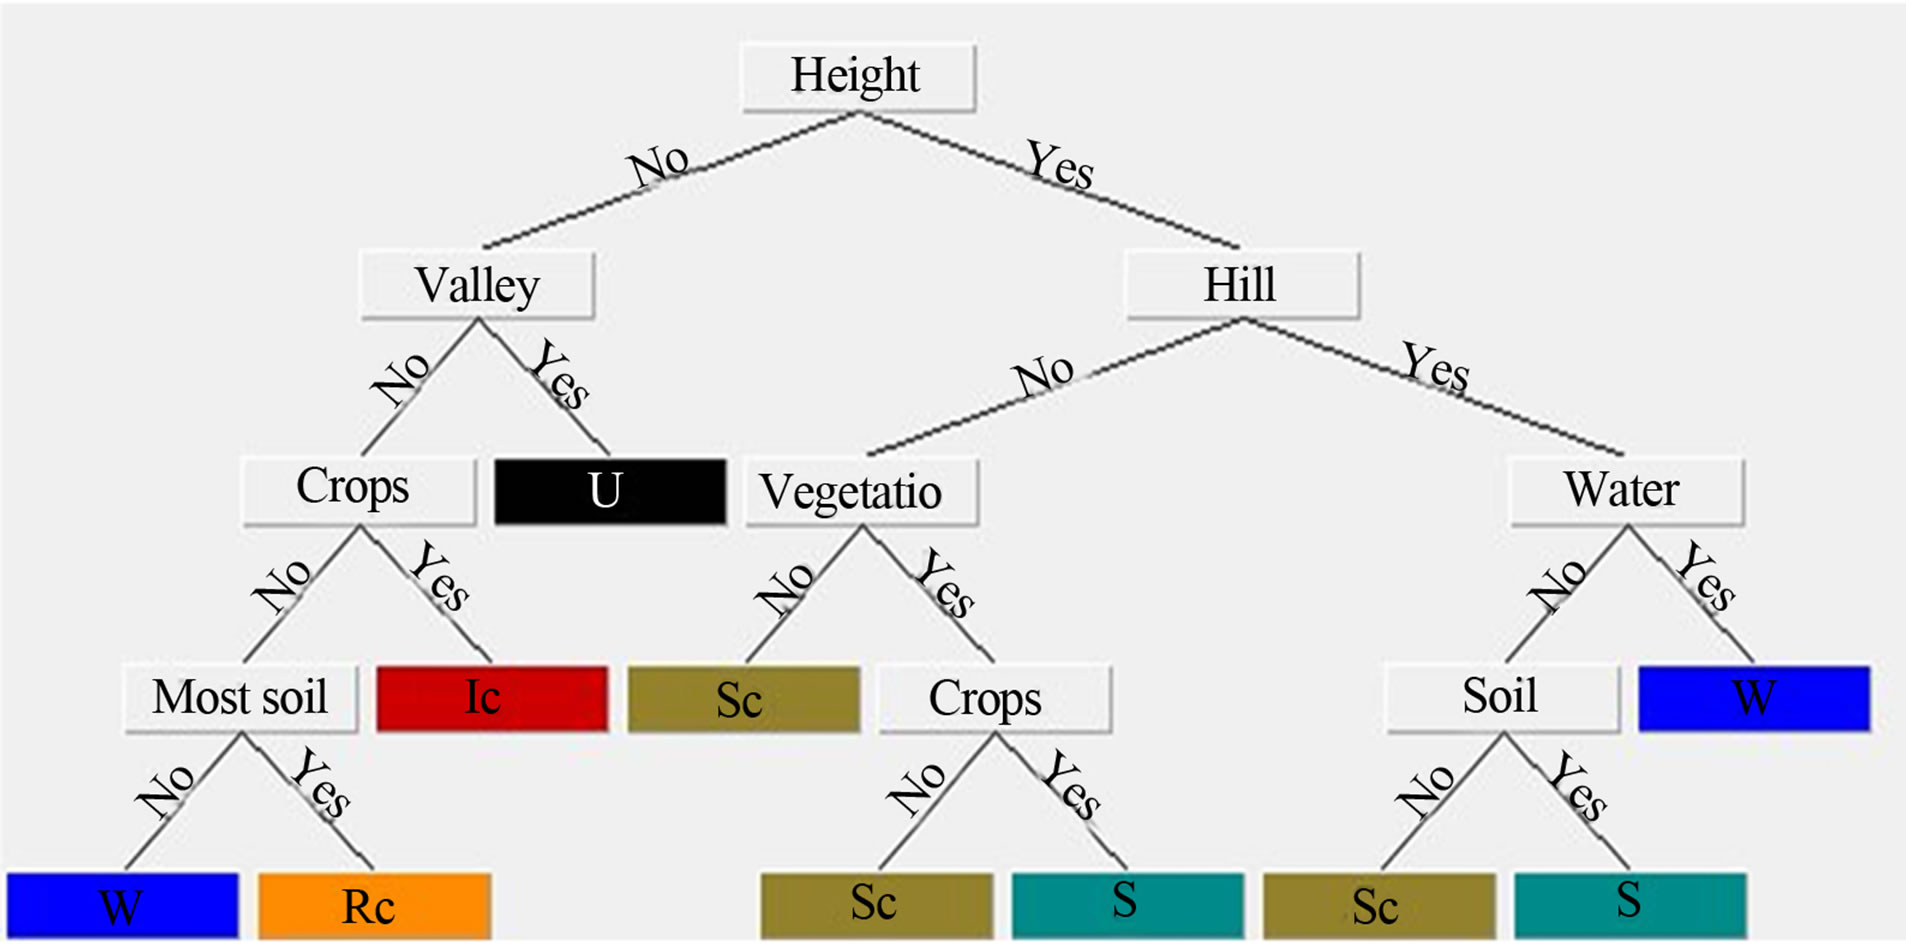
Figure 7. Methodology ID3 applied as a technique of classifycation of the Landsat MSS, Landsat TM images. The nomenclature used was b1 = DEM, b2 = Band 1 used to highlight the urban zone, b3 = 4 Band used to highlight water bodies, gt = Greater tan, lt = Less tan. The figures (quantities) that accompany the parameters are the values constraints.
5. QUANTIFICATION OF CHANGE IN USE OF LAND From the results shown by the ID3 classification and the reference of the original image data, it is obtained the area occupied by each class, for each analyzed year. These data are used to quantify the change of land use, using the equation proposed by FAO in 1996 (Eq.1). In which you get the exchange rate, i.e. the relation of change of use of the land between two analyzed dates.
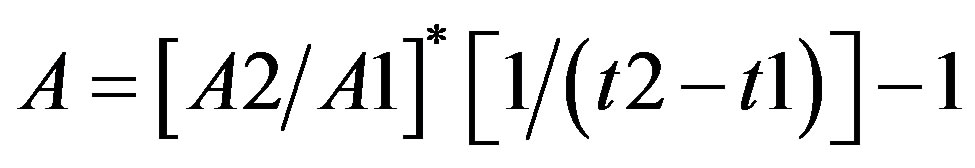 (1)
(1)
where:
T = Rate of change.
A1 = Initial time date area t1.
A2 = Area of start date of the time t2.
t2 − t1 = Number of years in the period considered.
6. RESULTS
6.1. Surveying
Field work focused primarily on the topographic surveys within the city of Celaya. The direction taken for the uprising was East-West that is almost perpendicular to the train of failure of orientation NNW-SSE of Taxco-San Miguel de Allende fault system. Part of the information collected during the uprising was the measurement of differential movement within the city and the vertical displacement. The stroke of the sections took place east of the city on faults that cross this part, South section was drawn on the Mercado de Abastos failures and La Corona, and North sections were on La Corona fault and the fault Universidad Pedagógica (Figure 8).
The topographical section (A - A’) has a length of 580.5 m. This section cuts two faults, La Corona fault which has the roof dropped Eastward and the Universidad Pedagógica fault with fallen roof to the West, this series of faults form a graben, (Figure 9). The measured dislocation of La Corona fault is of 2.26 m and the approach in the University fault is 2.06 m above the profile different failures can be appreciated which is the result of the formation of the graben.
6.2. Evolution of Elevation of the Static Level
For the elaboration of the evolution of the static level map were considered piezometry data of 1956 as home data, and piezometry data on 2000 as final data. The evolution map was generated using the difference between the 2000 data minus the data in 1956.
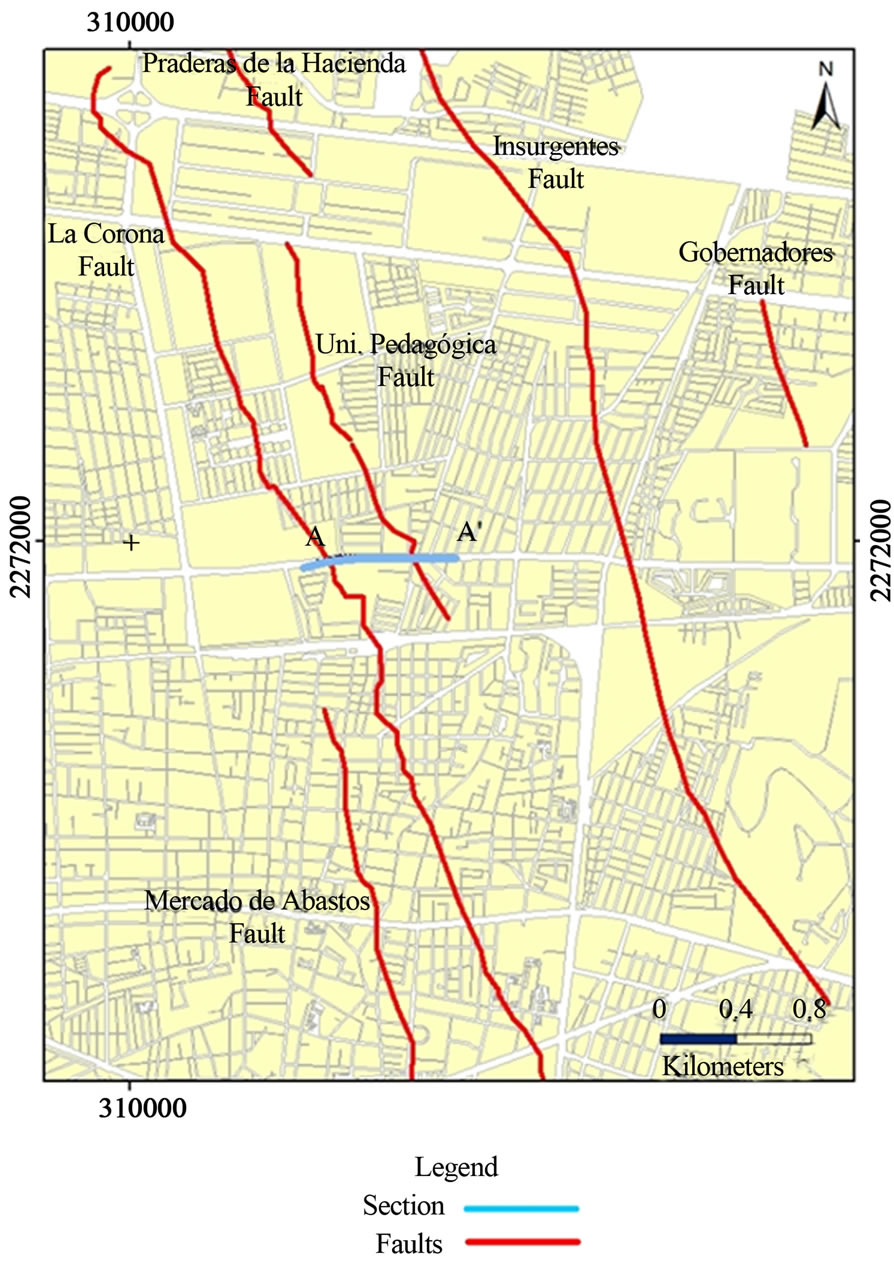
Figure 8. The image shows the location of the topographical sections (purple line) within the city.
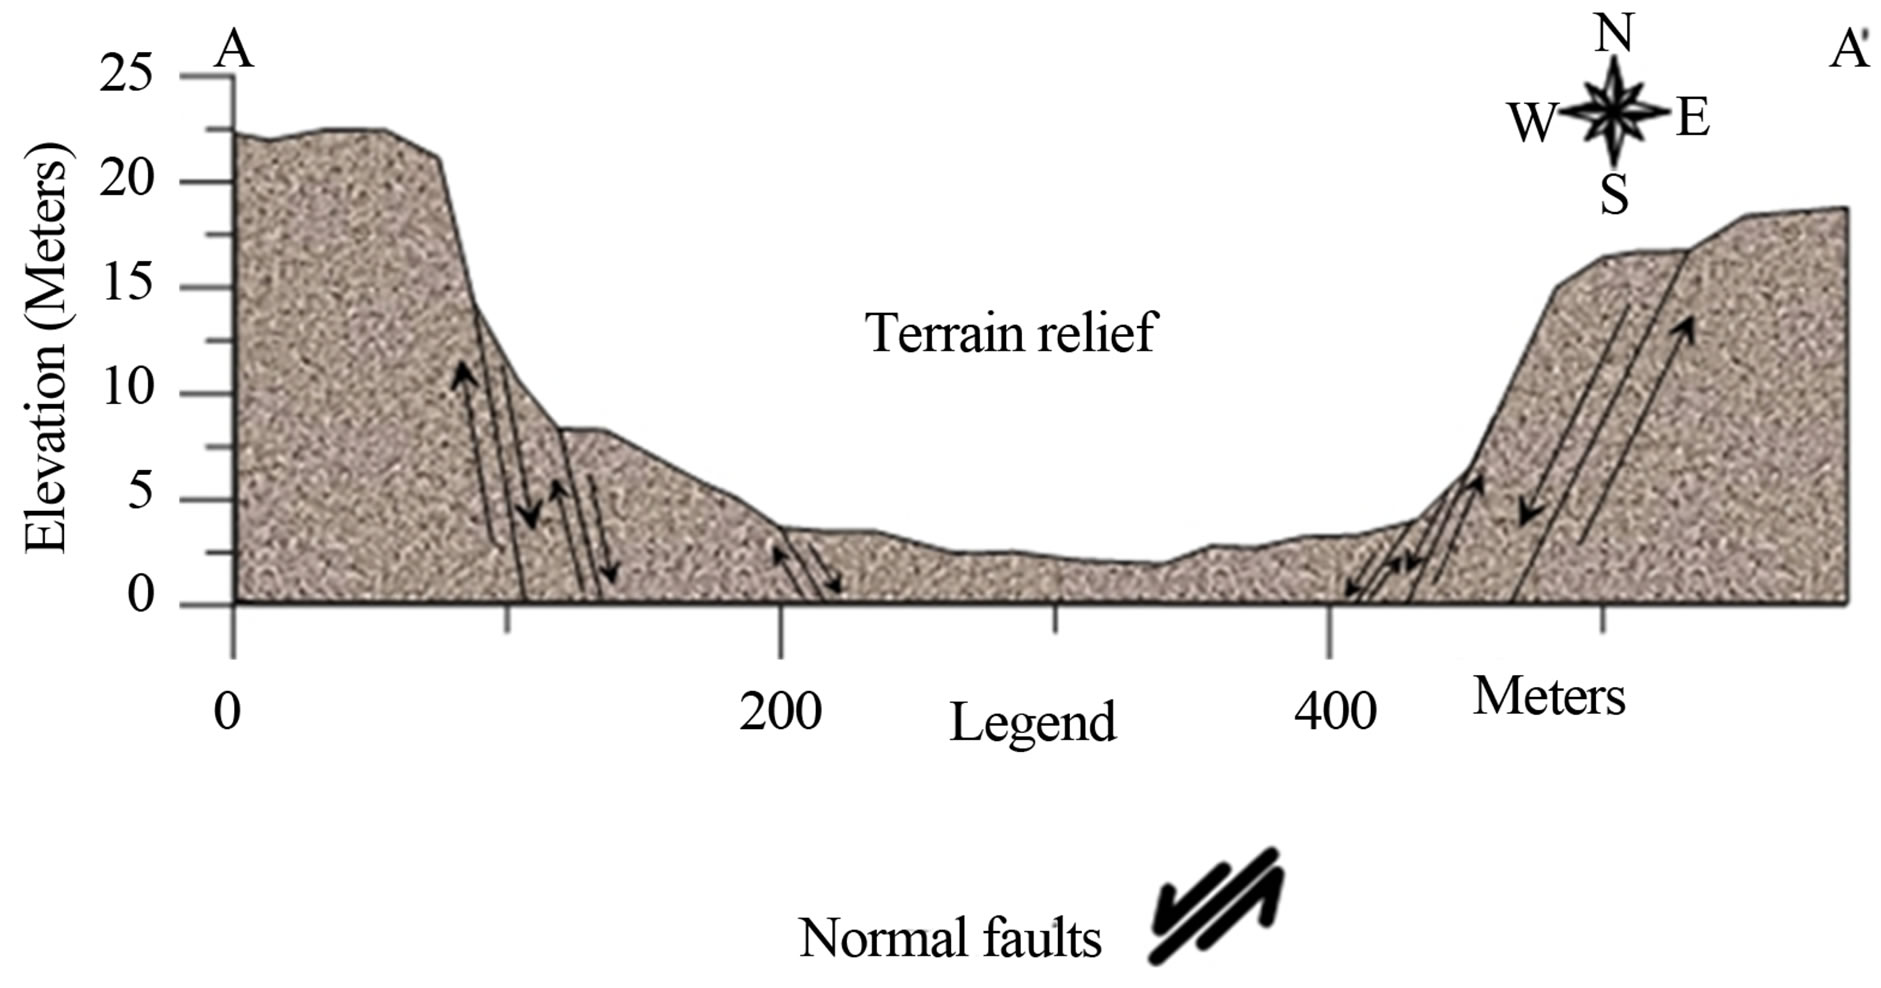
Figure 9. Topographic survey on Irrigation street, showing a graben.
Figure 10 shows the evolution of the static level for aquifer of Celaya. This figure shows in blue the shallowest parts. These areas have a depth that varies from 0 to −25 m and correspond to the mountains surrounding the Valley of Celaya. The color cyan to green light zone has a range of values of −35 to −55 mm. This zone corresponds to the margin close to the mountains. Yellow to orange area has a range of −65 to −75 m. This area is related to the Valley. The area ranging from orange to red is the deepest, and it has values from −85 to –115 m, and corresponds to the deepest part of the drawdown.
In the Western portion of the city of Celaya is where the most significant values of evolution are found, this area has values ranging from −75 to −85 m. The areas near the train of fault within the city of Celaya have a minor evolution with depth values that range from −65 to −75 m, compared to the Northern zone, where also passes the train’s fault but presents values of −75 - 95 mm.
The greatest evolution over the Valley occurs towards the municipality of Villagran where values are recorded ranging from −55 m - 65 m, while towards the municipalities of Juventino Rosas and Cortazar signify cant values of depth are not observed.
6.3. Dynamic Change of Land Use
Land use for 1976. This year it is the initial stage of the analysis of the evolution of change in land use in the study area. The resulting map of the classification of the Landsat MSS of 1976 image shows that the main activity was the seasonal agriculture. For this year the distribution of surface between classes is: S (41.14 km2), Rc (918.83 km2), Sc (991.27 km2), U (19.35 km2), Ic (35.89 km2) and W (0.32 km2). Therefore, for 1976, the 45.8% of the surface was occupied by rain fed crops and only 1.8% corresponded to irrigated crops (Figure 11(a)).
Land use for 1989. By 1986, the agricultural activity had a significant change (Figure 11(b)). Class S fell to
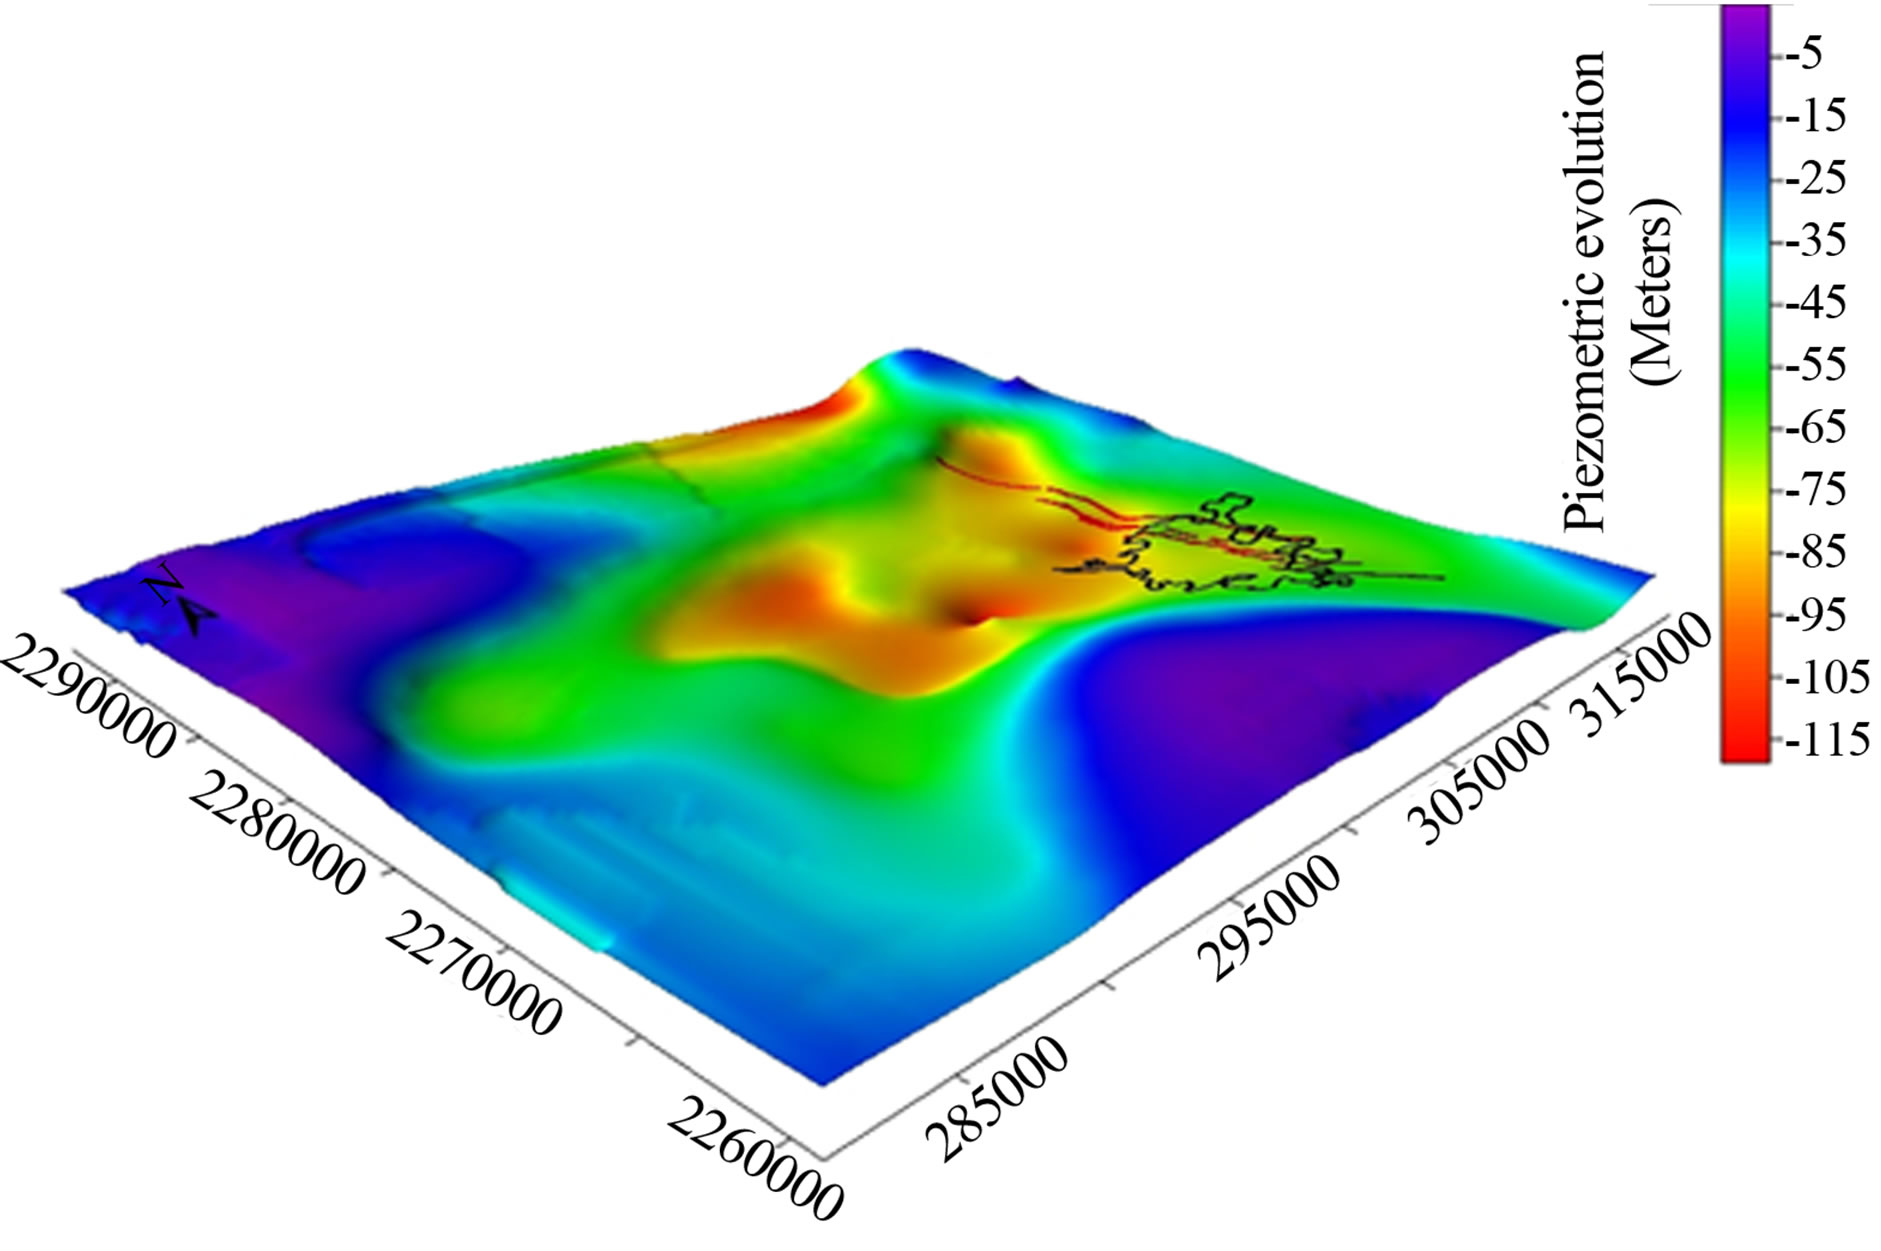
Figure 10. Image showing the evolution in the elevation of the static level within the study area.
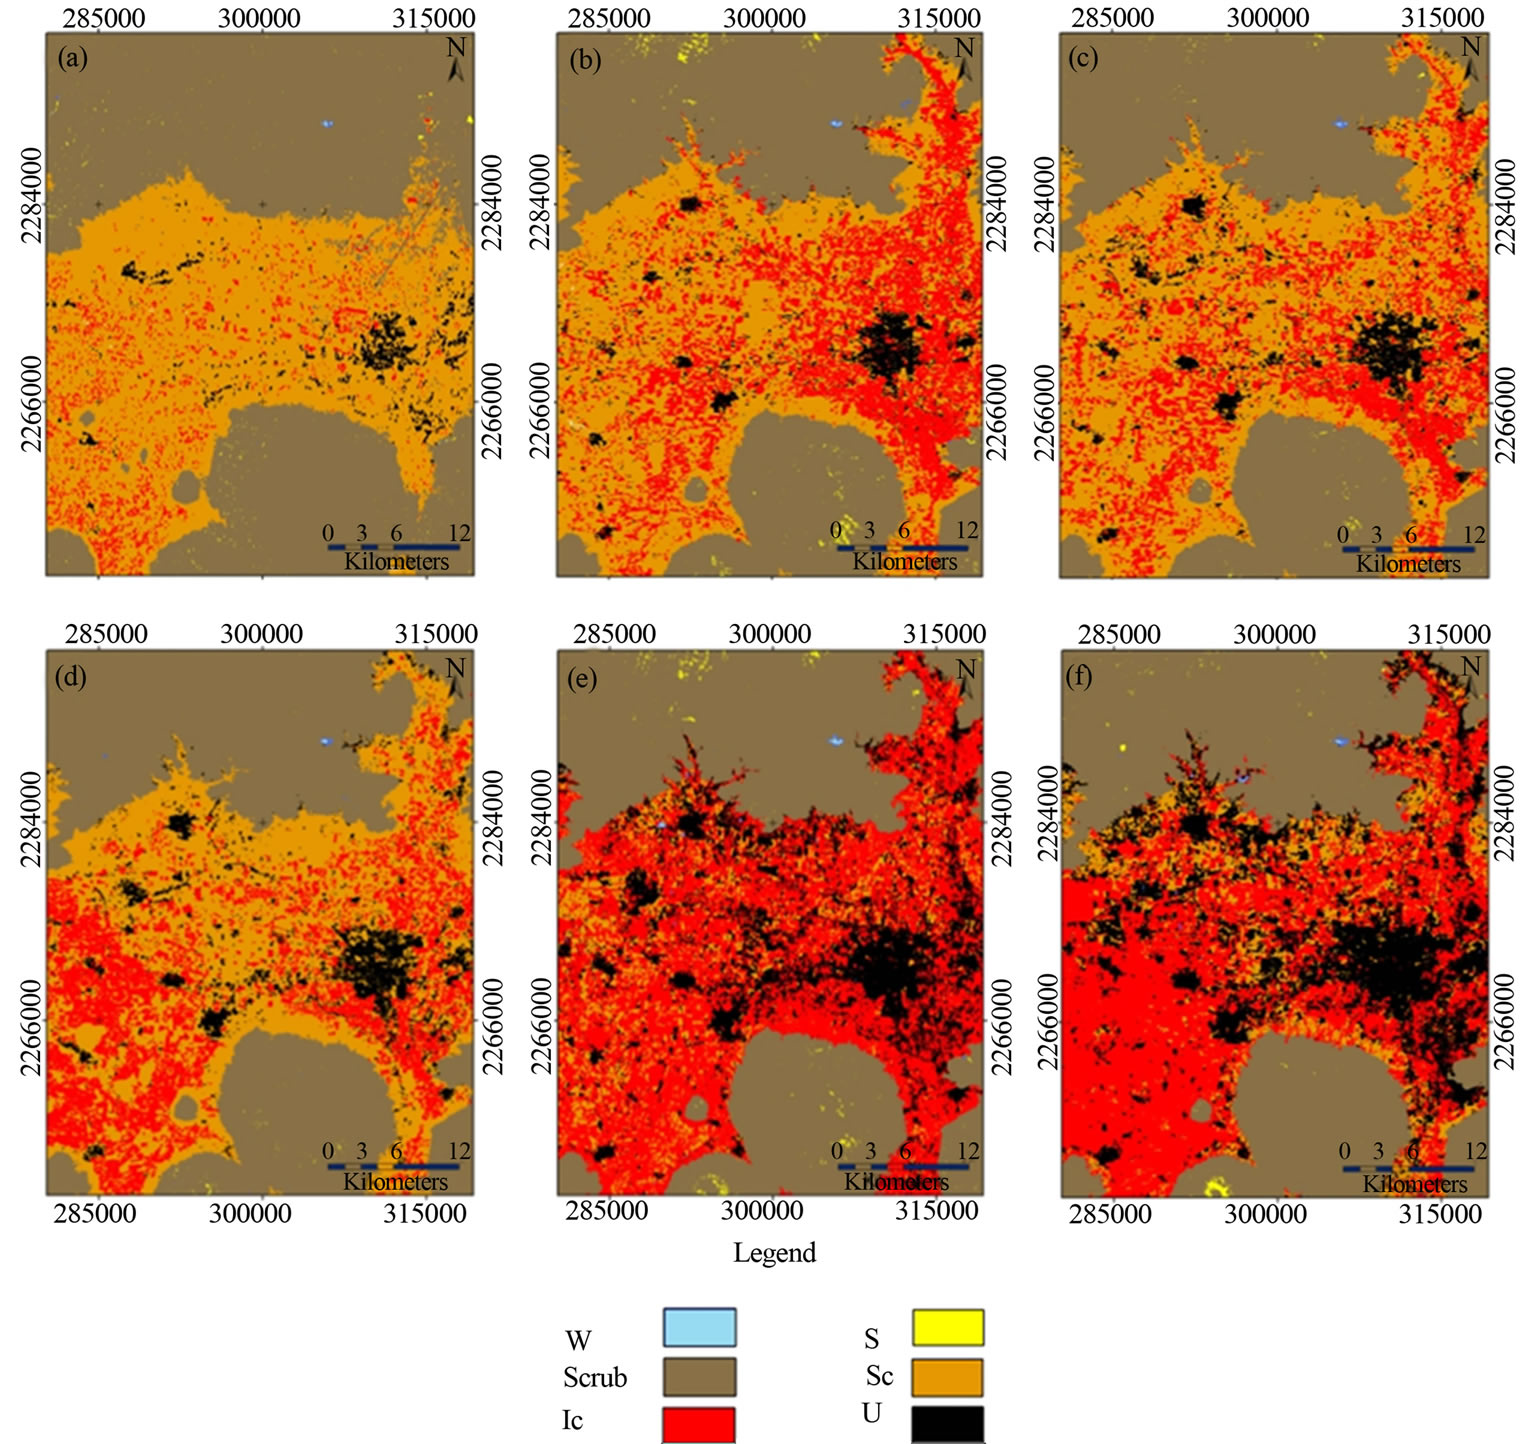
Figure 11. Land use maps for (a) 1976; (b) 1989; (c) 1999; (d) 2000; (e) 2009; and (f) 2011. The classes obtained are: water bodies (W), Scrub (Sc), Irrigated crops (Ic), rain fed crops (Rc), soil without vegetation (S) and urban (U). Orange color corresponds to Rc and red color shows Ic.
36.09 km2, class Ic increased to 103.94 km2, class Sc decreased its area to 746.66 km2, class U increased its surface at 35.72 km2, class Rc had a significant growth in the East of the study area, reaching a surface of 1083.94 km2 and the W class presented an increase on its surface to 0.45 km2. In this year, it is already possible to identify the municipalities of Juventino Rosas, Villagran and Cortazar due to its surface growth.
Land use for 1999. In 1999 the Ic class was which showed the greatest increase, occupying an area of 196.35 km2. By this period there is also a loss of area in the Rc class which its surface is of 986.96, km2. The class U increased to 40.01 km2 and class S had a notable loss being an area of 24.64 km2. The changes of area in other classes were not relevant to remain almost with the same surface (Figure 11(c)).
Land use for 2000. With just one year elapsed the classification of land use for the year 2000 (Figure 11(d)), showed variations in the S-class which was reduced to an area of 11.88 km2, class Rc presents a decrease of surface to 948.26 km2. On the other hand, there were classes which experienced an increase on their surfaces like U that reached an area of 47.67 km2, the agricultural activity by irrigation expanded to 227.38 km2. The Sc and W classes did not have significant changes.
Land use for 2009. The situation changed drastically in the classification of land use in 2009 (Figure 11(e)), the S class increased its area to 29.9 km2. Continuing with the same trend from past periods, the Rc class reduced its surface to 409.66 km2. The class U presents its greatest increase in surface reaching 179.85 km2. Class Ic also increased its surface at 633.27 km2. The W class increased its surface of 1.11 km2, this increase can be explained due to the appearance of some troughs near the municipality of Juventino Rosas. For the land use map of this year Ic occupied for the first time more area than the Rc class, which prevailed years ago.
Land use for 2011. Finally the classification for the year 2011 was conducted, (Figure 11(f)), in order to display the most recent status of the distribution of land use in the region. S class has an area of 23.3 km2. The Rc class presents an area of 413.34 km2. The Sc class displays a surface of 659.75 km2, class U occupies an area of 213.32 km2. Class Ic is the one which dominates the entire Valley occupying an area of 696.28 km2, class W had a loss for the last year reduced to an area of 0.81 km2. The comparison established between the extreme dates 1976 and 2001, shows significant losses of surface for classes S, Rc and Sc and important increases for CI classes, U and W.
Rate of change of land use.
The rate of change was made in order to quantify the losses or increases of different coverages of the region. In Table 2, negative values indicate loss of area and positive values indicate increase in the surface between the analyzed dates. These results, in turn, can be represented in a comparison chart (Figure 12) to display the change rate into a single image.
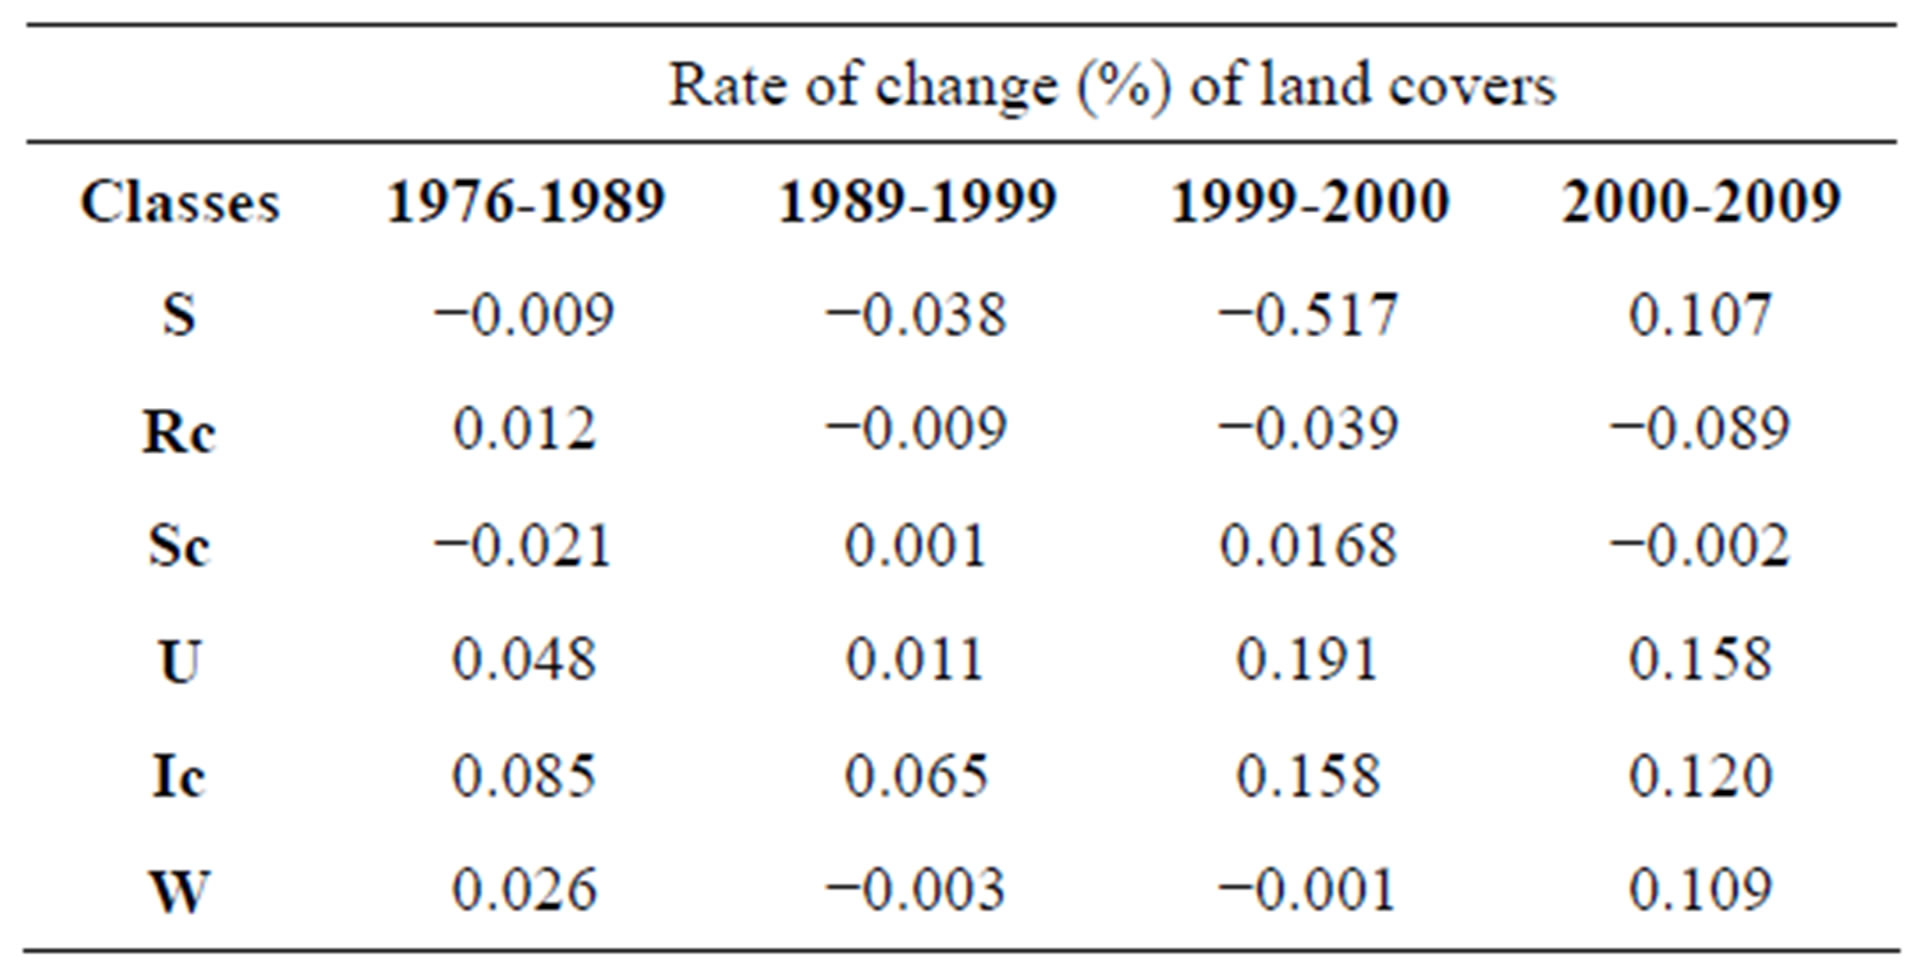
Table 2. Negative numbers indicate that the class had a loss of surface in the period. Positive numbers indicate an increase of surface in the period.
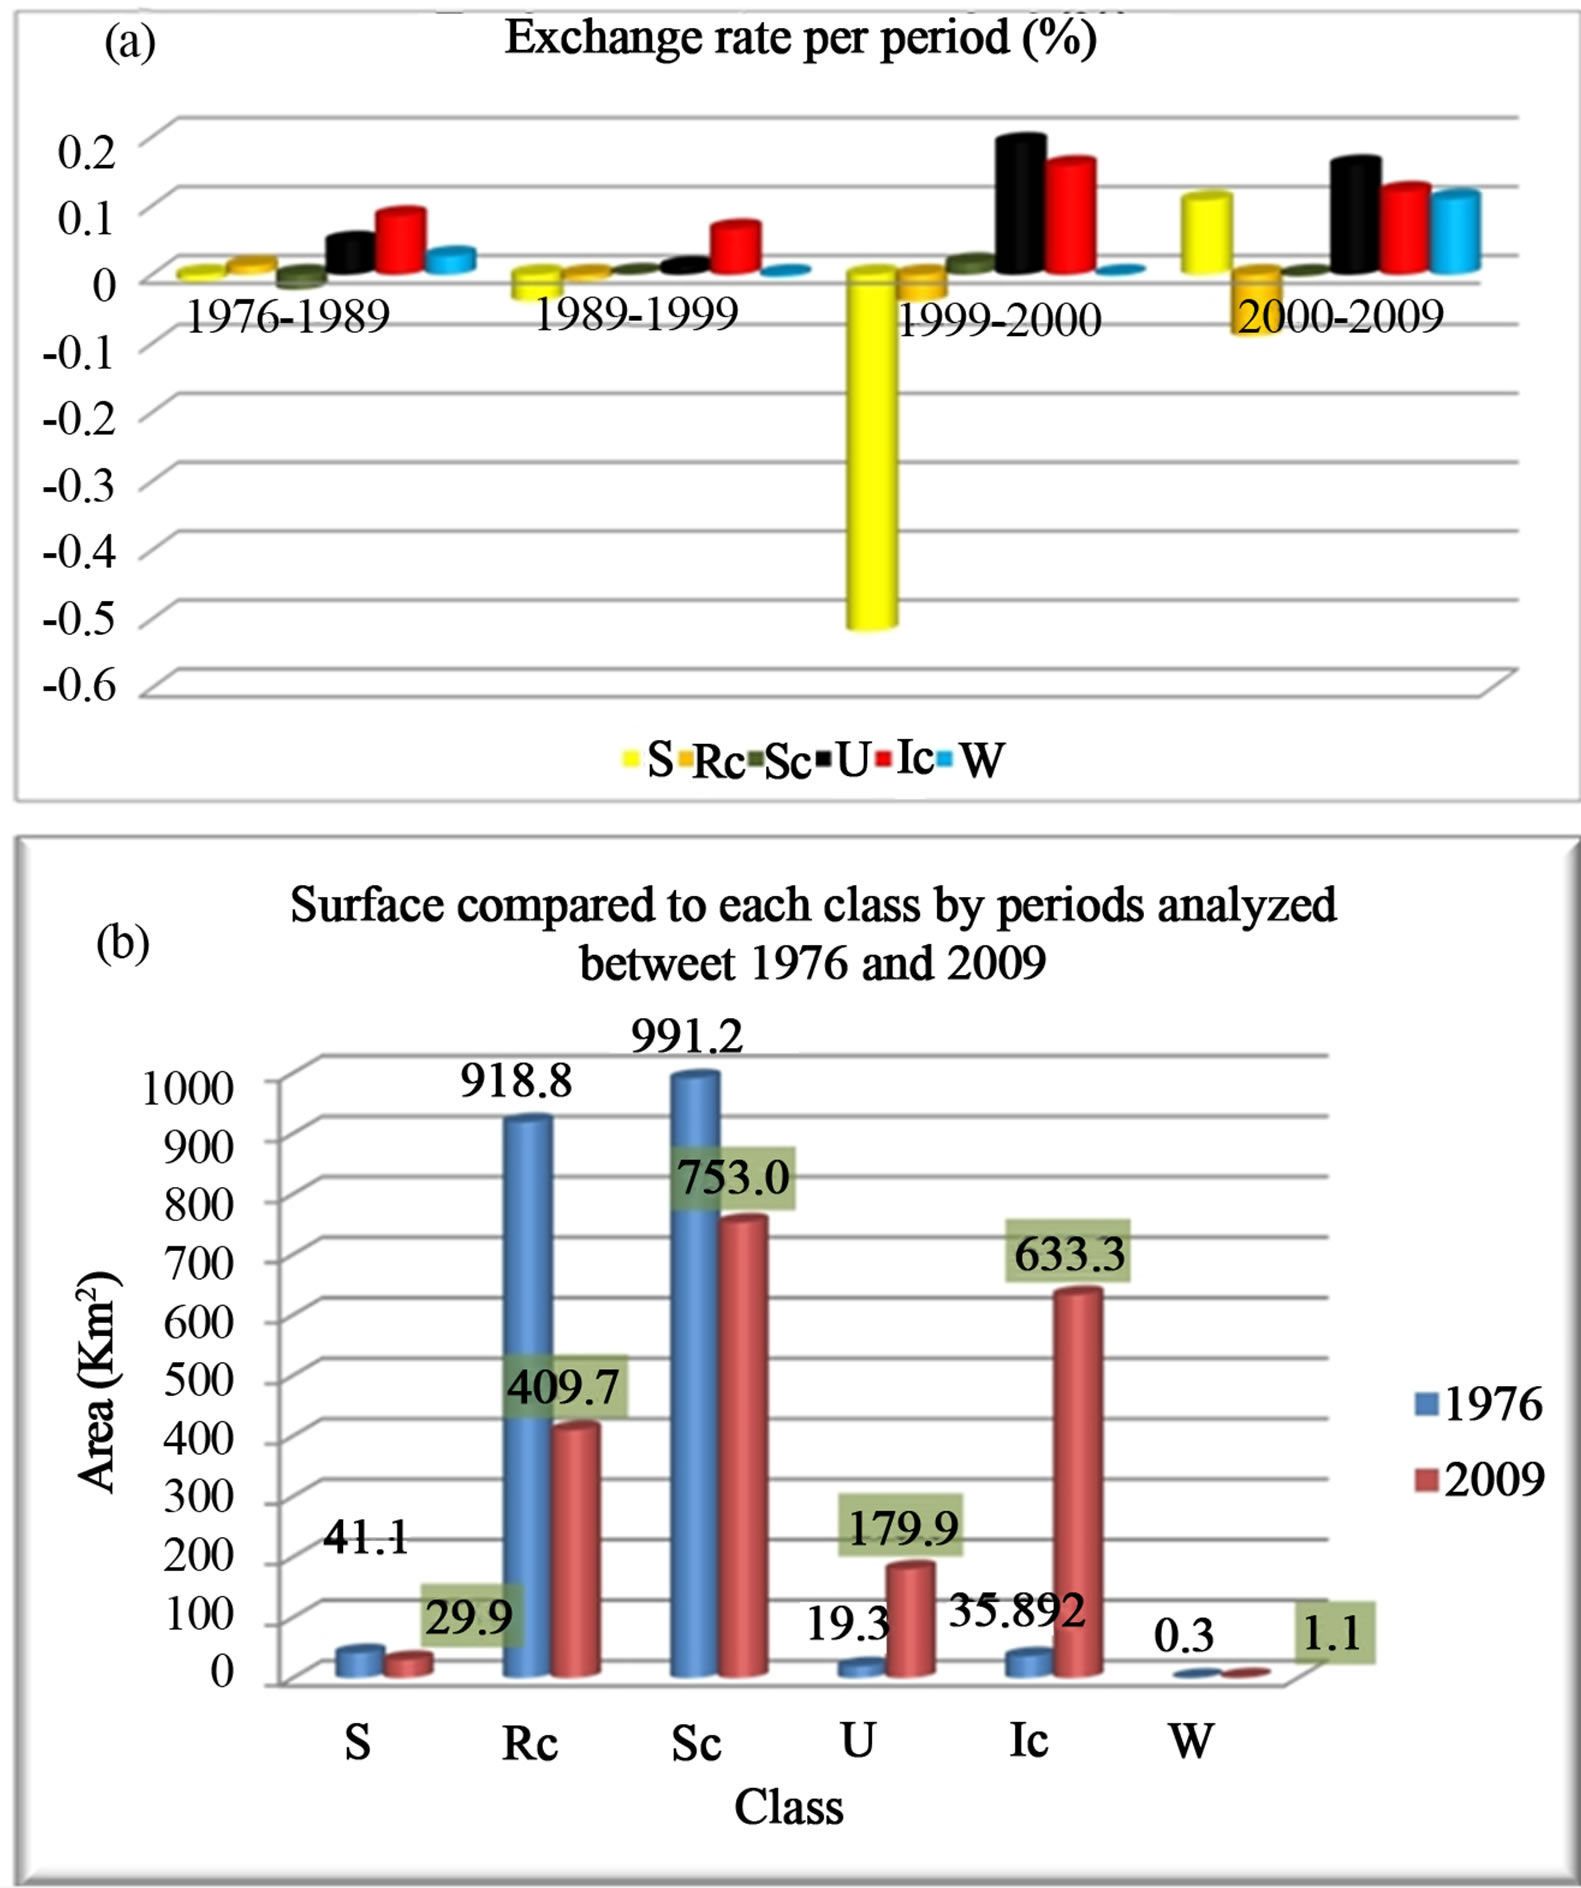
Figure 12. Graphic showing the rate of change of land covers for (a) all periods considered in this study, (b) for 1976-2019 period. Classes: Water bodies (W), Scrub (Sc), Irrigated crops (Ic), Rain fed crops (Rc), Soil without vegetation (S) and Urban (U).
The results of this work show that Celaya Valley presents problems of a different nature but have the underground water imbalance as a common factor. Much of the problem focuses on the Valley of which the main component is the alluvial and lacustrine material. This material is very favorable for growing areas, due to its high content of clays and silts, although these two elements do not contribute to the fertility of the soil, they help to provide moisture, for this reason this type of soils is preferred for agriculture. For a long time the agriculture of the region was watered with rain water. However, the need for greater agricultural production made rain irrigation insufficient and urged farmers to use groundwater to irrigate their crops. In this way, the groundwater was extracted by wells of which their density increased significantly year to year affecting the elevation of the static level of the aquifer. The mining of the aquifer caused an imbalance in the layer composed of material silt-clayish causing the appearance of cracks. The results demonstrate that this phenomenon is a combined product of the evolution of the static level induced by changes in the use of soil and the tectonics of the region.
7. CONCLUSIONS
The system of faults in Celaya has a tectonic origin, which could be associated with fault system Taxco-San Miguel de Allende.
The study area has been presented very significant changes in soil use, being the most striking change from seasonal to agriculture irrigation agriculture. In the years 70’s temporary agricultural land use occupied the 94.3% of the area of the Valley and the irrigation used 3.6%, currently the former uses the 33.8% and the latter occupies a 48.7%.
From 1956 to 2000, the drawdown presents a growth rate of 3.5 mm/year and it has deepened until −115 m. In recent years, the drawdown evolved with a Z elongated shape ranging from Juventino Rosas to Celaya. In this drawdown, major depressions are located at the center of the study area.
When the drawdown intersects at this fault system, lateral displacements are imperceptible and vertical displacements (normal faulting) are magnified, reaching breakups of up to 3.5 m.
The effects of normal faulting in Celaya were accelerated with intensive extraction in the aquifer due to change of seasonal irrigation agriculture land use.
The biggest breakups occur when adding the factors of tectonic faulting and the drawdown caused by the change of land use.
8. ACKNOWLEDGEMENTS
We want to thank the project “Hundimiento activo del fondo de un lago-cráter recientemente desecado y sus posibles implicaciones ambientales, Rincón de Parangueo, Guanajuato” PAPIIT IN109410 funded, in its 2010 edition.
REFERENCES
- Joyce, K.E., Belliss, S.E., Samsonov, S.V., McNeill, S.J. and Glassey, P.J. (2009) A review of the status of satellite remote sensing and image processing techniques for mapping natural hazards and disasters. Progress in Physical Geography, 33, 183-207.
- Hernandéz, Ch.A. and Miño, G.M., (1975) Fifty years of history in Mexico, rural environment and hacienda-mill complex in New Spain. El Colegio de México, 1, 371-385.
- Carranco, L.S.E. (2012). Effects of land use change on an aquifer in a tectonically active region. Master’s Thesis, Potosin Institute of Scientific and Technological Research. San Luis Potosí.
- Trujillo, J. (2009) Faulting of land by overexploitation of aquifers in Celaya Guanajuato. Aquaforun Bulletin, 52, 25-28.
- Valero, A. (2002) Geological risk associated with faulting in the city of Celaya, Guanajuato: Using detection of Radon-222. National Polytechnic Institute.
- Demant, A. (1982) Geochemical interpretation of the Transmexican Neovolcanic Axis volcanism. Magazine, 5, 217-222.
- CEASG, (1990) Study of planning of the use of the aquifer of the Valley of Celaya, carried out by the engineer Jesús Manuel Chi Ham. The Water of Guanajuato State Commission, Guanajuato.
- CEAS of Guanajuato (1999) Hydrogeological study and mathematical model of the aquifer of the Valley of Celaya. Computerized Geological Engineering, Guanajuato.
- Campbell, J.B. (2007) Introduction to remote sensing. 4th Edition, The Guilford Press. NewYork.
- Lillesand, K., Thomas, R. and Chimman, W. (2007) Remote sensing and image interpretation. 6th Edition, Wiley Publishing, Hoboken.
- Chuvieco, E. (1996) Fundamentals of remote sensing. 3rd Edition, Ediciones Rialp, Madrid.