Natural Science
Vol.4 No.8A(2012), Article ID:21662,9 pages DOI:10.4236/ns.2012.428083
Questioning the applicability of soil amplification factors as defined by NEHRP (USA) in the Israel building standards
![]()
1Seismology Division, Geophysical Institute of Israel, Lod, Israel; *Corresponding Author: yuli@seis.mni.gov.il
2National Steering Committee for Earthquake Preparedness, Lod, Israel
Received 21 June 2012; revised 23 July 2012; accepted 9 August 2012
Keywords: Site Effect; VS,30; Site Classification; Site Coefficient Fa and Fv
ABSTRACT
In this study, we examined the applicability of the NEHRP soil classification which is based on the VS,30 parameter and the corresponding Fa and Fv factors to correct acceleration response spectra for local site classification. We calculated acceleration response spectra (10% in 50 years) for more than 1900 sites across Israel. Computations were made for hard rock conditions and for the actual site conditions, while considering nonlinear response of the soils. Based on synthetic acceleration response spectra of real sites (using stochastic procedures), it is concluded that generalizing site classification and consequently, amplification, by means of a single parameter VS,30 is not recommended. The geology of Israel is complex and may vary significantly over short distances. Sites of similar class, show different soil effects both in shape, amplitude and in frequency. In many cases, there is no correlation between amplification and VS,30 and in other cases, the scatter is unacceptably high.
1. INTRODUCTION
The National Earthquake Hazard Reduction Program (NEHRP) recommended provisions for seismic regulations for new buildings and other structures [1] have provided a scheme for classifying sites according to the average shear wave velocity through the top 30 m of a soil profile, VS,30, (see Eq.1 and Table 1) and associated the soil classes with site amplification factors Fa for short period (0.2 sec) and Fv for long period (1.0 sec) accelerations (see Tables 2 and 3). This classification scheme is applied in many National Building Codes including Israel Standard (SI 413). Tables 1-3 are copied from the draft Israeli code 413 (version 5) and are actually a copy from the NEHRP (1997) document.
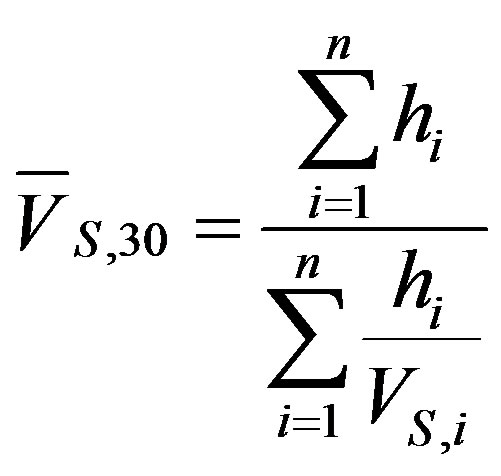 (1)
(1)
where hi is the thickness of the ith layer between 0 and 30 m and VS is the shear-wave velocity layer in the ith layer.
Many researches and among them [2-5] have already claimed that soil classifications that account only for VS,30 might lack accurate enough definition of site classes, lead to erroneous evaluation of the ground amplification levels and consequently to wrong seismic hazard assessments. Problems were observed mainly in cases of
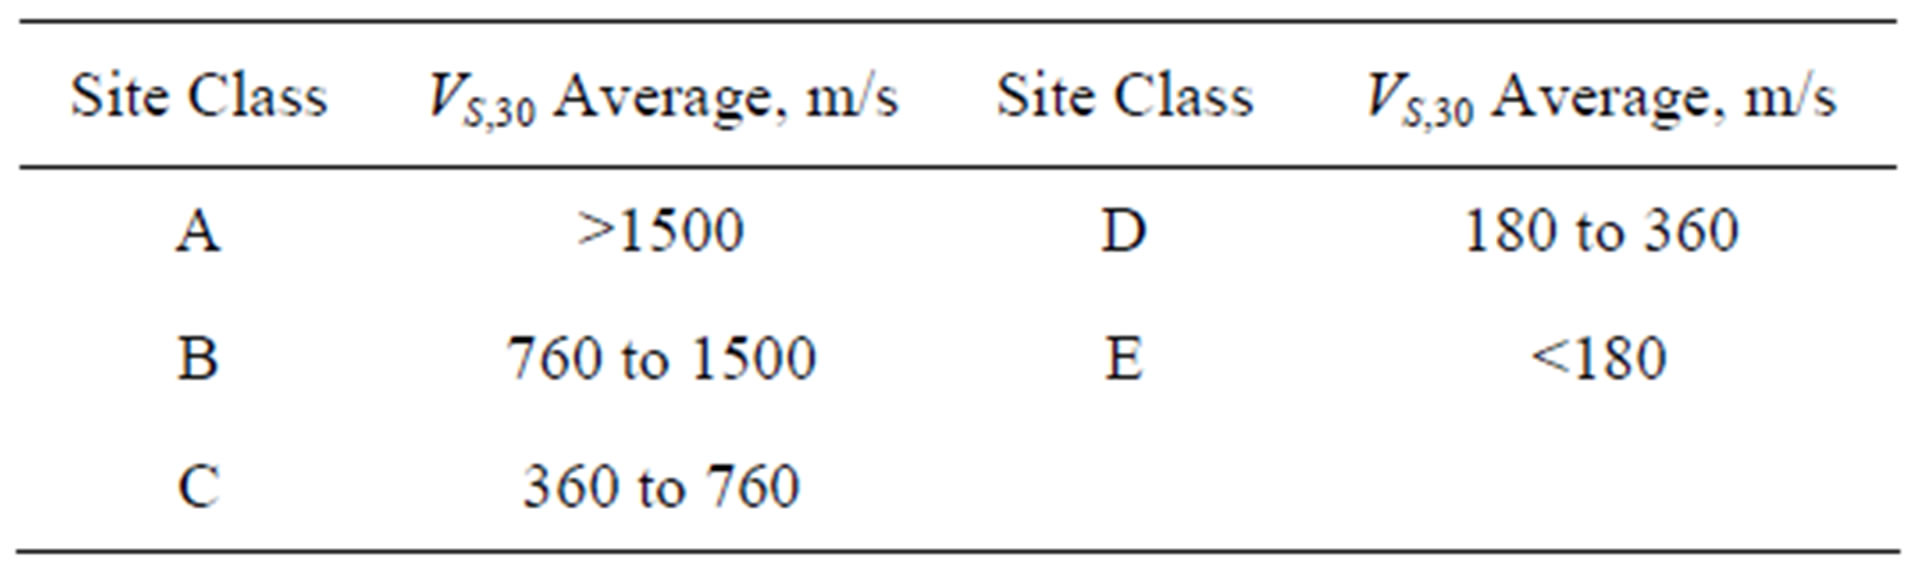
Table 1. Site classification.
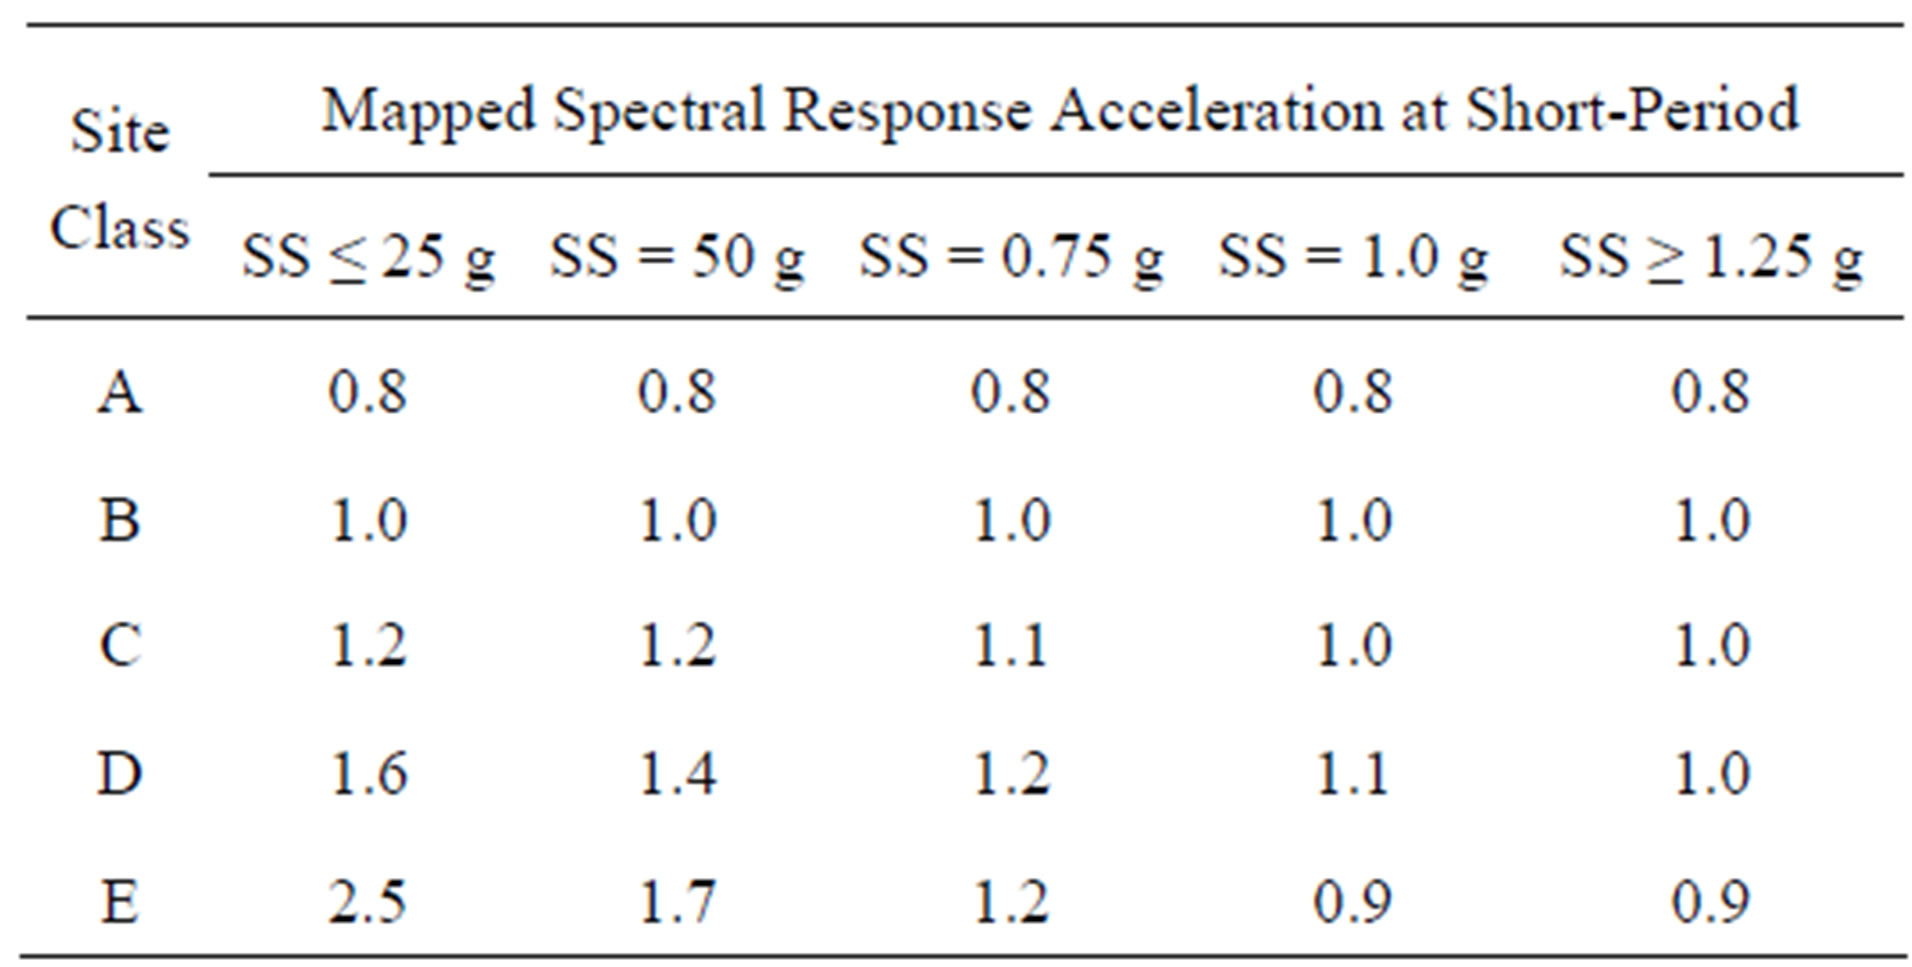
Table 2. Values of Fa as a function of Site Class and mapped short-period spectral acceleration.
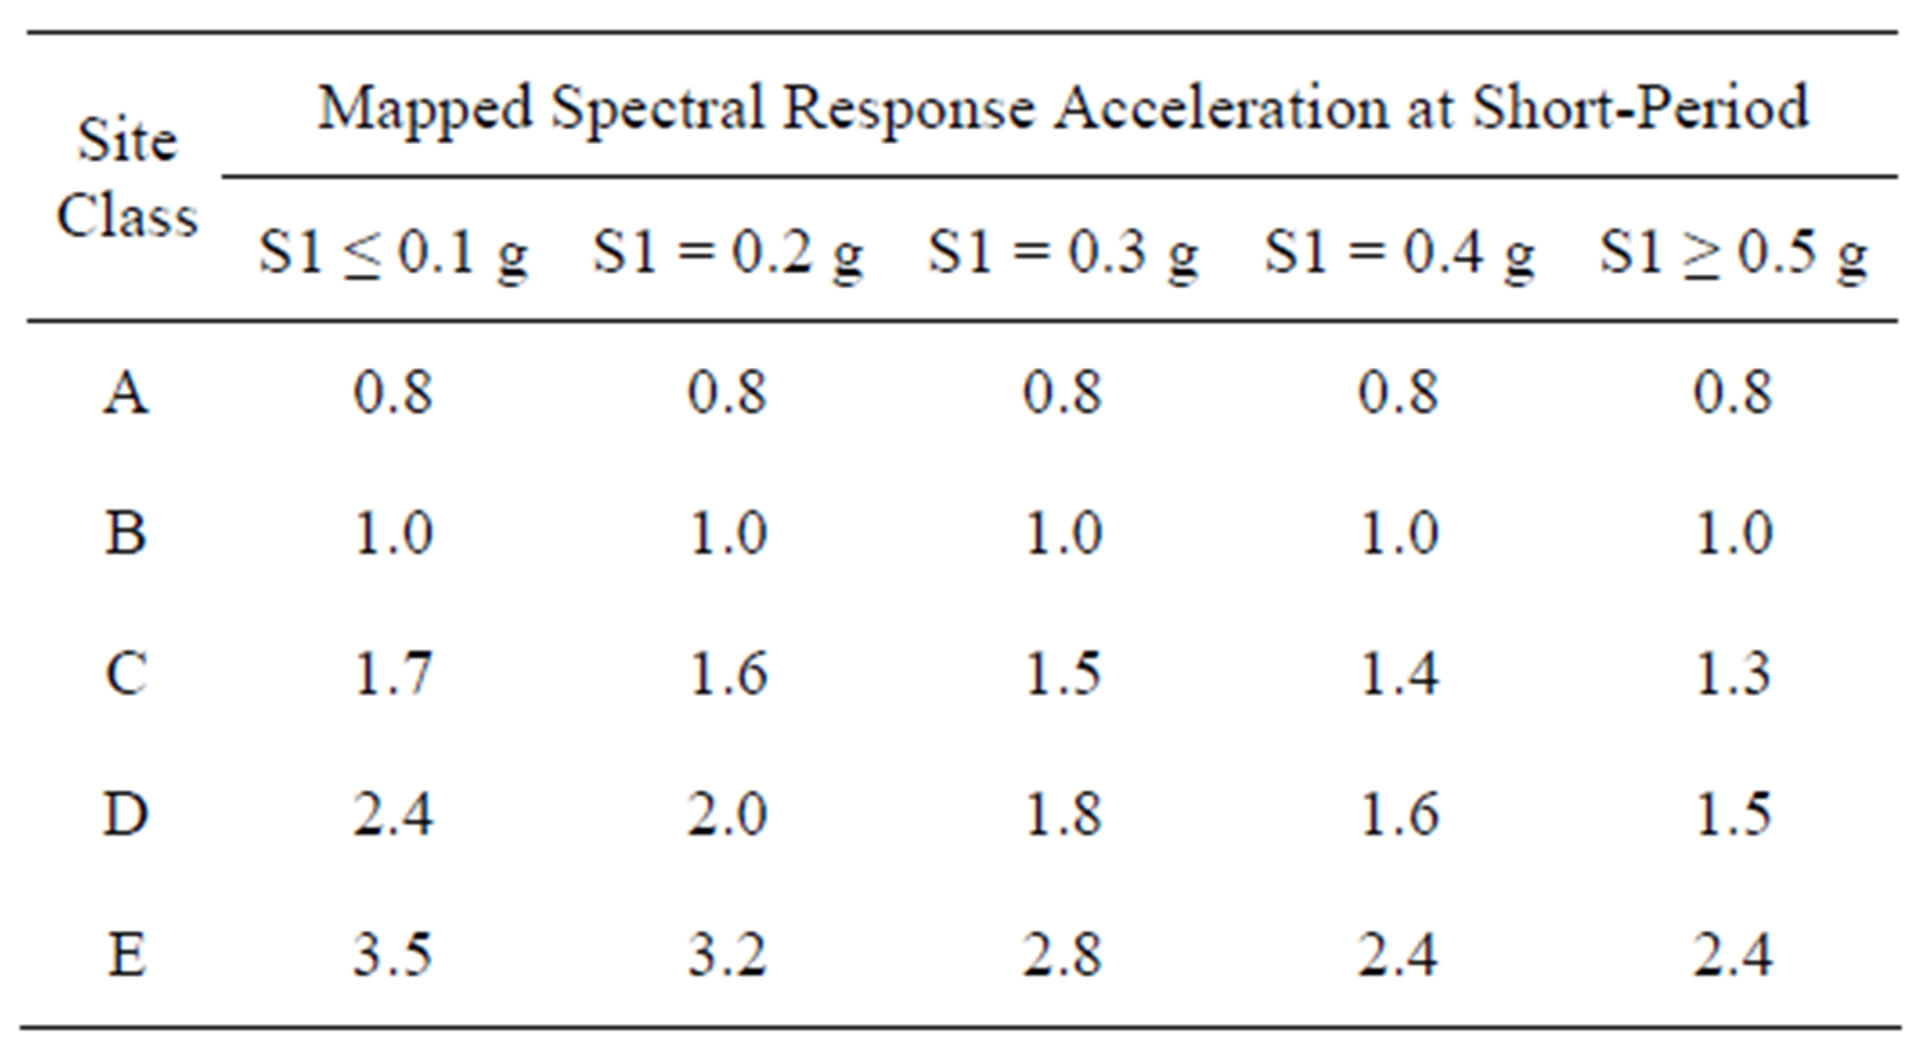
Table 3. Values of Fv as a function of Site Class and mapped 1 second period spectral acceleration.
deep soil deposits (deeper than 30 m) and abrupt stiffness changes (high seismic impedance contrast) between the bedrock and the overlying soil formations. Among the important seismic site response factors are the impedance ratio between surface and underlying soils, the surface topography of the underlying soil layers, the geo-technical properties of the material and their variation with the intensity of the shaking. Hence, the site classification system should include adequate dynamic parameters of the soil during earthquakes.
Over the years, the Seismology Division of the Geophysical Institute of Israel conducted site investigations in several thousands of sites across Israel in more than 30 towns and many surrounding villages [6-9]. Our studies cover areas of more than 900 km2. These investigations demonstrate the usefulness of using horizontal-to-vertical (H/V) spectral ratios from ambient noise measurements [10] to identify sites with high potential for being vulnerable to amplification effects. The seismological survey helped characterizing the sites with respect to their expected response functions under low strains. The investigated soil sites exhibited H/V peak amplitudes ranging from 2 to 10 in the frequency range 0.3 - 14 Hz. These results suggest that there is significant variability of shear wave velocity and considerable variation of sediment thickness even over short distances. H/V spectral ratio analysis, together with information about the surface geology, seismic refraction and reflection surveys, bore-hole data, geotechnical information and more, helped building reliable 1-D multi-layers soil column models of the subsurface for each point of measurement. Our site investigations led us to suspect that the VS,30 parameter may fail to serve as a leading parameter for soil classification, especially with respect to quantifying soil amplification effects and seismic hazard assessments in Israel.
Site investigation, conducted by the Seismology Division enabled the determination of the thicknesses and S wave velocities of the soil layers that constitute the geology of the subsurface of the investigated site, as well as the S-wave velocity of the hard rock acting as a seismic reflector. Densities and specific attenuation in different lithological units were selected from the literature [11, 12]. Recently, [13] used spectral decay in the shear-wave spectral ratio with respect to reference site amplification curves and estimated Q (quality) values for shallow sedimentary deposits. They concluded that the range of Q values is 10 - 40. These values agree well with those used in our studies. The geological-geotechnical parameters that characterize the lithological units in the investigated areas are summarized in Table 4.
The definition of “bedrock”, i.e., the infinite half space at the bottom of a soil profile, deserves special attention. Wrong definitions of the bedrock may affect the results, leading to unreliable estimations of resonance frequency of the site and its amplification. For example, when conducting site investigations in the town of Qiryat Shemona in the north of Israel, we revealed three different reflectors: Basalt (VS = 2000 m/sec), Limestone (VS = 1800 m/sec) and conglomerate (VS = 800 m/sec). In another part of the country, along the Carmel Coast, the “bedrocks” are: Sandy limestone (VS = 1200 m/sec), Gypsum and Limestone (VS = 1500 m/sec) and Limestone-Dolomite (VS = 1900 m/sec). In such situations, and probably elsewhere, it might be incorrect to classify sites without giving much attention to the underlying bedrock.
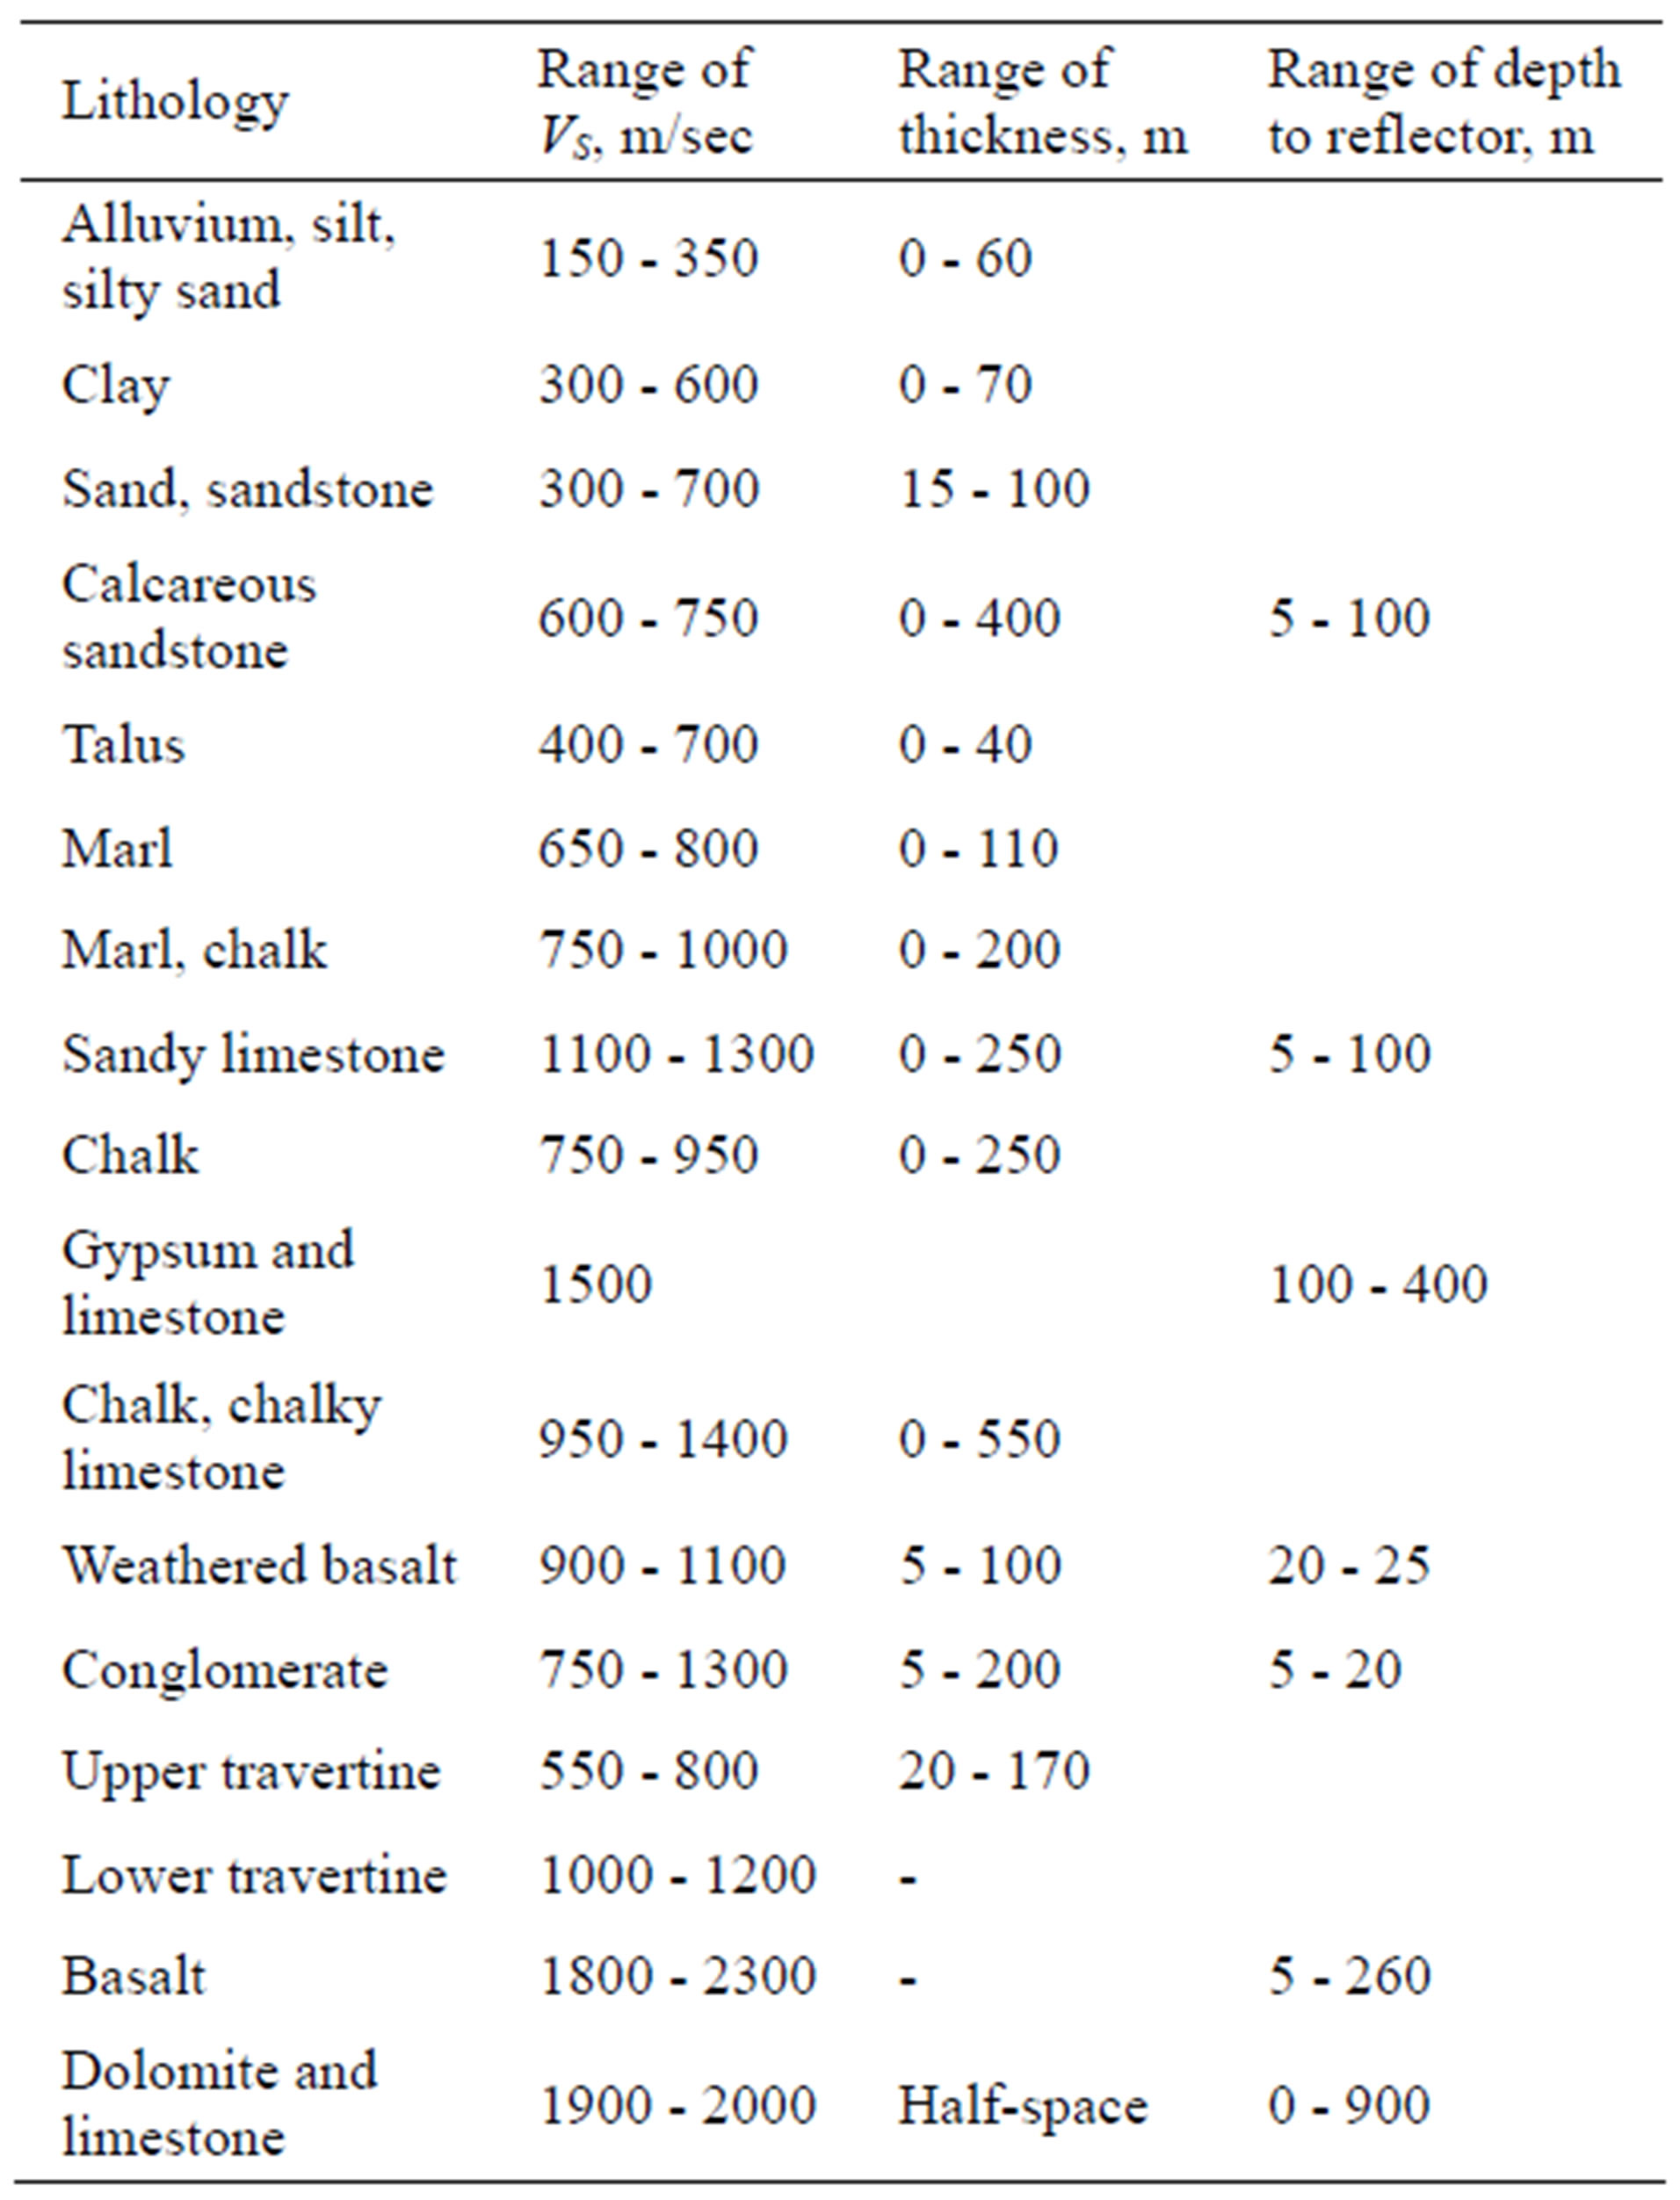
Table 4. S-velocities and thicknesses of lithological units represented in the study areas.
VS,30 determinations seem to be sensitive to the soil layering. For example, seismic refraction surveys carried out in the towns of Dimona, Arad and Bet Shean identify three soil layers: Alluvium of 7 - 10 m thick (VS = 300 - 350 m/sec), Travertine or conglomerate of 30 - 40 m thick (VS = 1000 - 1200 m/sec) overlying the bedrock (Basalt or Dolomite with VS = 2000 m/sec). Consequently (see Eq.1), VS,30 of the soil column is more than 800 m/sec which classifies the site to be of class B (VS,30 = 760 - 1500 m/sec) rather than class D (VS,30 = 160 - 360 m/sec) and with no amplification to be expected (i.e., Fa and Fv are equal to 1). A detailed analysis would yield amplification of the order of more than a factor of 3. Obviously, in such cases, that are very common across Israel, the generalization made by using VS,30 to characterize the seismic site response is wrong and misleading.
In the following analysis, for relatively shallow (depth to reflector 40 - 60 m) soil column models with upper soft layer of 7 - 15 m thick overlying high velocity intermediate layer, we define VS,30 by referring to VS of the first soft layer.
Figure 1 presents the distribution of main characteristic parameters of the soil-column models in different areas. These parameters are depth to bedrock or the thickness of the soil deposits (h), the average S-wave velocity of the upper 30 meters (VS,30), the observed resonance frequency (f0) of the site and its associated H/V amplitude. The areas are: 1) Northern Shefela of about 250 km2 that constitutes the towns Ramla, Lod, Petah Tikva, and Kefar Sava (530 models); 2) The town of Qiryat Shemona (10 km2) with 60 models; 3) The Northeastern Negev (25 km2) constituting the towns Arad and Dimona (106 locations).
The variability in amplitude and shape of these histograms clearly indicates that the geology in Israel is too complex to be represented by a single parameter VS,30 as a basis for estimating site effect parameters.
Based on the observed above, we found it advisable to investigate the applicability of the concepts provided in the NEHRP provisions. More specific, examine the validity of the assumption that VS,30 is a useful parameter for the classification of site in Israel, to be associated with site response and seismic hazard evaluations. Furthermore, in this study we try to address the question whether or not can we use in the building code for Israel the site depended values of Fa and Fv, suggested in the NEHRP provisions.
2. THE METHOD
From the vast database of investigated sites, in this study we selected about 1900 sites for which we are
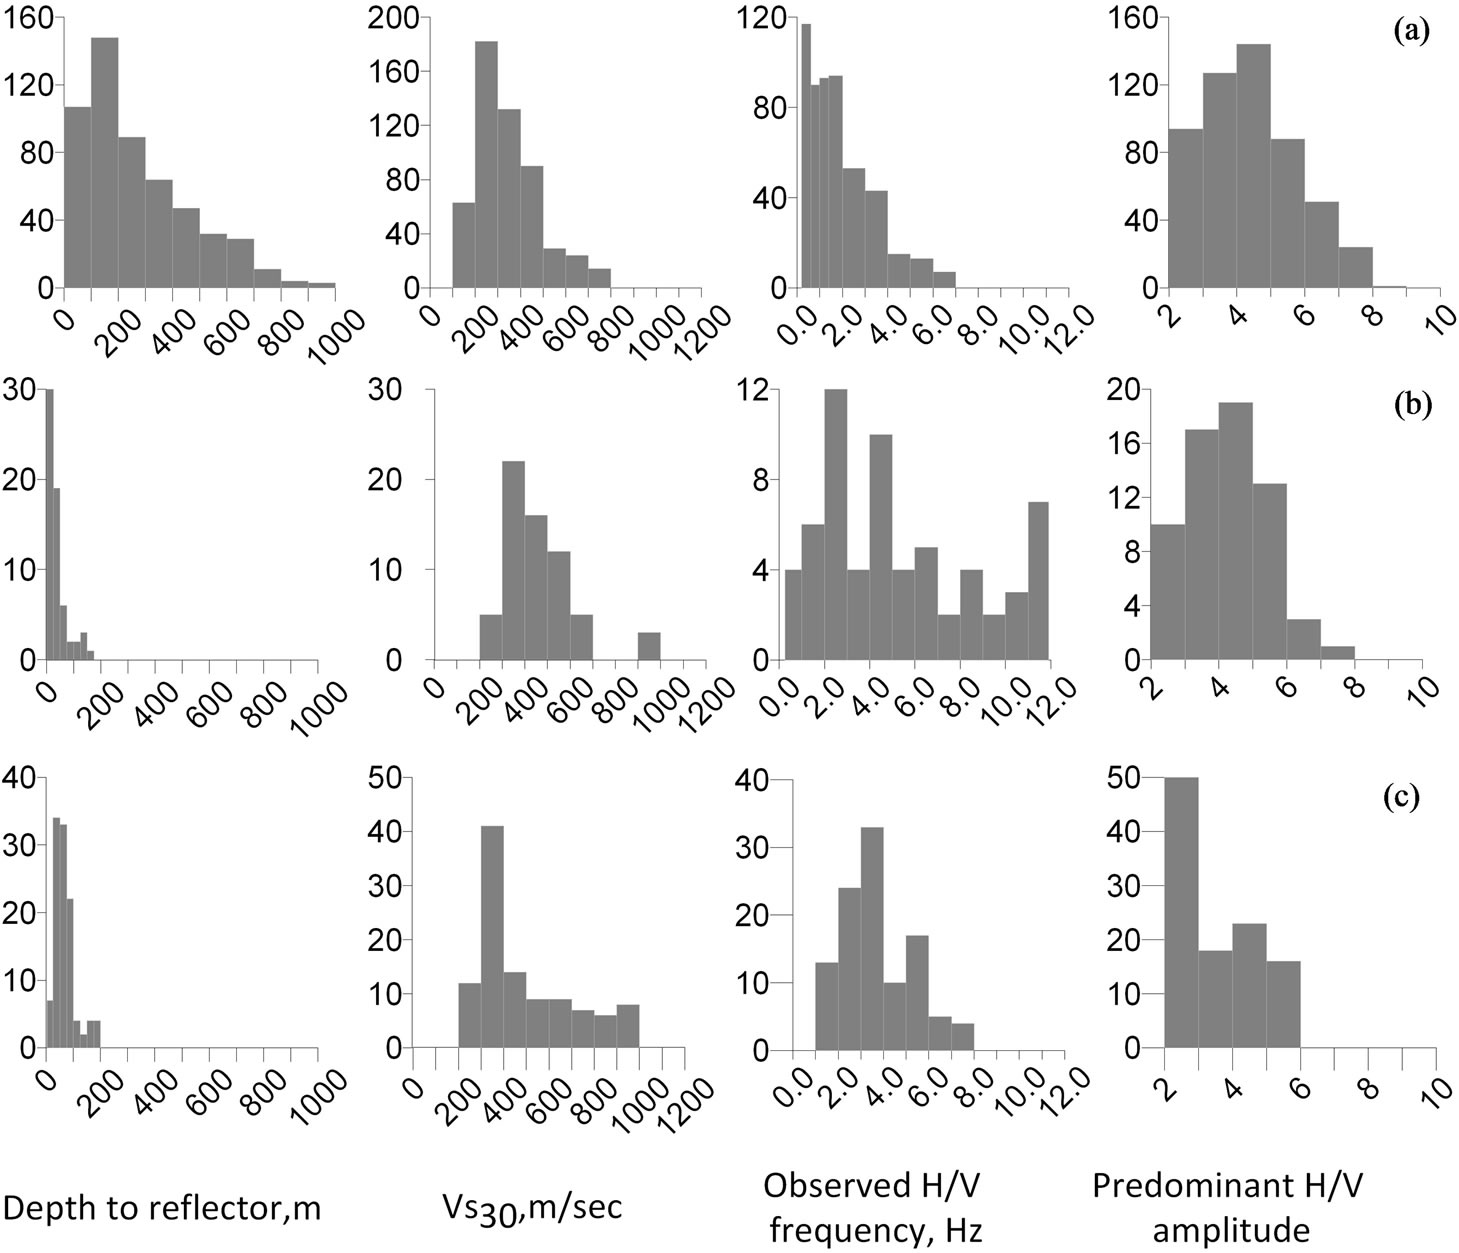
Figure 1. Distribution of site characteristic parameters of the soil-column models in: (a) The northern Shefela; (b) The town of Qiryat Shemona; (c) The towns of Dimona and Arad.
more confident of knowing their soil column models. Modeling of the subsurface at each of the selected sites is based on compiling data from surface geology, seismic refraction and reflection surveys and borehole data. Each model is validated by empirical H/V spectra from ambient noise measurements over dense grid of measuring points. Confidence is gained by the fact that the analytical site response functions for very low strains, obtained by using the well-known computer code SHAKE [14] or the non-linear site response computer code [15] are very similar to the empirical H/V spectra, i.e., identical resonance frequencies (f0) and similar amplification at those frequencies.
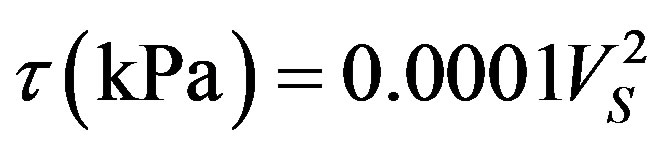
The key parameters for nonlinear computations [15] are specified in terms of density, S-wave velocity, thickness of each layer and maximum shear stress on a horizontal plan (τv). In order to consider nonlinear response of the soil layers to the propagating S-waves, we applied the following assumptions: for sand
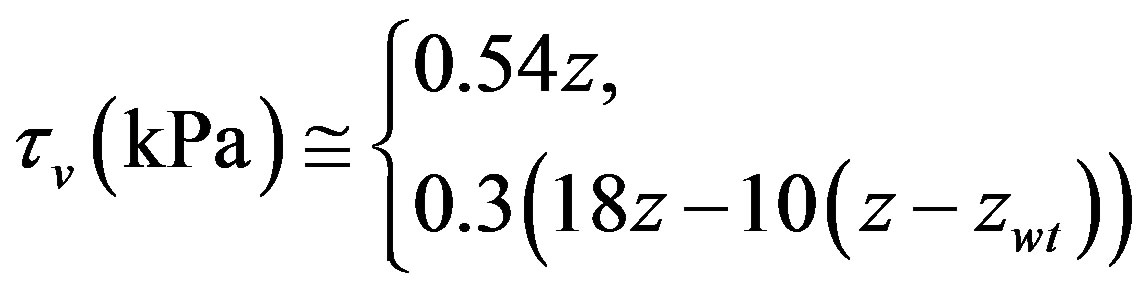 (2)
(2)
where z is the depth of the point for which τv is calculated and τwt is the depth of the water table (both in meters).
For clay, Eq.2 is
 (3)
(3)
For each of the selected sites we evaluated the uniform hazard acceleration response spectrum.
The spectral accelerations are associated with 10% probability of exceedance in an exposure time of 50 years and for single degree oscillators with 5% damping.
Computations are made using the SEEH procedure (SEEH—Stochastic Estimation of the Earthquake Hazard) developed by [16]. Computations were made under the assumption that the response of the soil layers is independent of the shaking intensity (linear conditions) and repeated while following the assumption that response of the soils is not linear (nonlinear conditions).
The SEEH procedure is a useful tool for evaluating the uniform hazard site specific acceleration response spectrum. This procedure, in brief, is based on the stochastic method of [17,18] and others to synthesize ground motion (and corresponding acceleration spectrum) at a site from a given earthquake. The stochastic approach is used to generate seismic waves at the surface of the bedrock layer. Generating S waveforms has required the adoption of certain empirically obtained parameters such as the regional attenuation of the low frequency spectral displacement as function of the seismic moment and the source-site distance, the variation of the corner frequency with the distance and magnitude (moment) and estimation of the regional stress drop (for more details see [19]). The synthesized seismic waves were let to propagate from the bedrock through the stratified soil layers to the surface of the site (computations can be made assuming linear or nonlinear behavior of the soils).
Computations have been repeated for each earthquake that is included in a synthetic earthquake catalogue. The synthetic catalog represents the locations and magnitudes of earthquakes that may occur during several thousands of years and affect the site. The seismicity simulations involve defining the seismogenic zones in and around Israel and attribution of the frequency-magnitude relationship to be associated with each seismogenic zone (see also [20]).
It should be emphasized that every estimated parameter has been added errors that are consistent with known or assumed uncertainties of the various parameters involved in the computations. These simulations yield a huge data base of synthetic accelerograms that the site may experience over a long period and from which we determine the uniform hazard acceleration response spectrum for the particular site.
The applicability of the SEEH approach can be demonstrated when comparing acceleration response spectra obtained from actual recording with the predicted response using the SEEH approach.
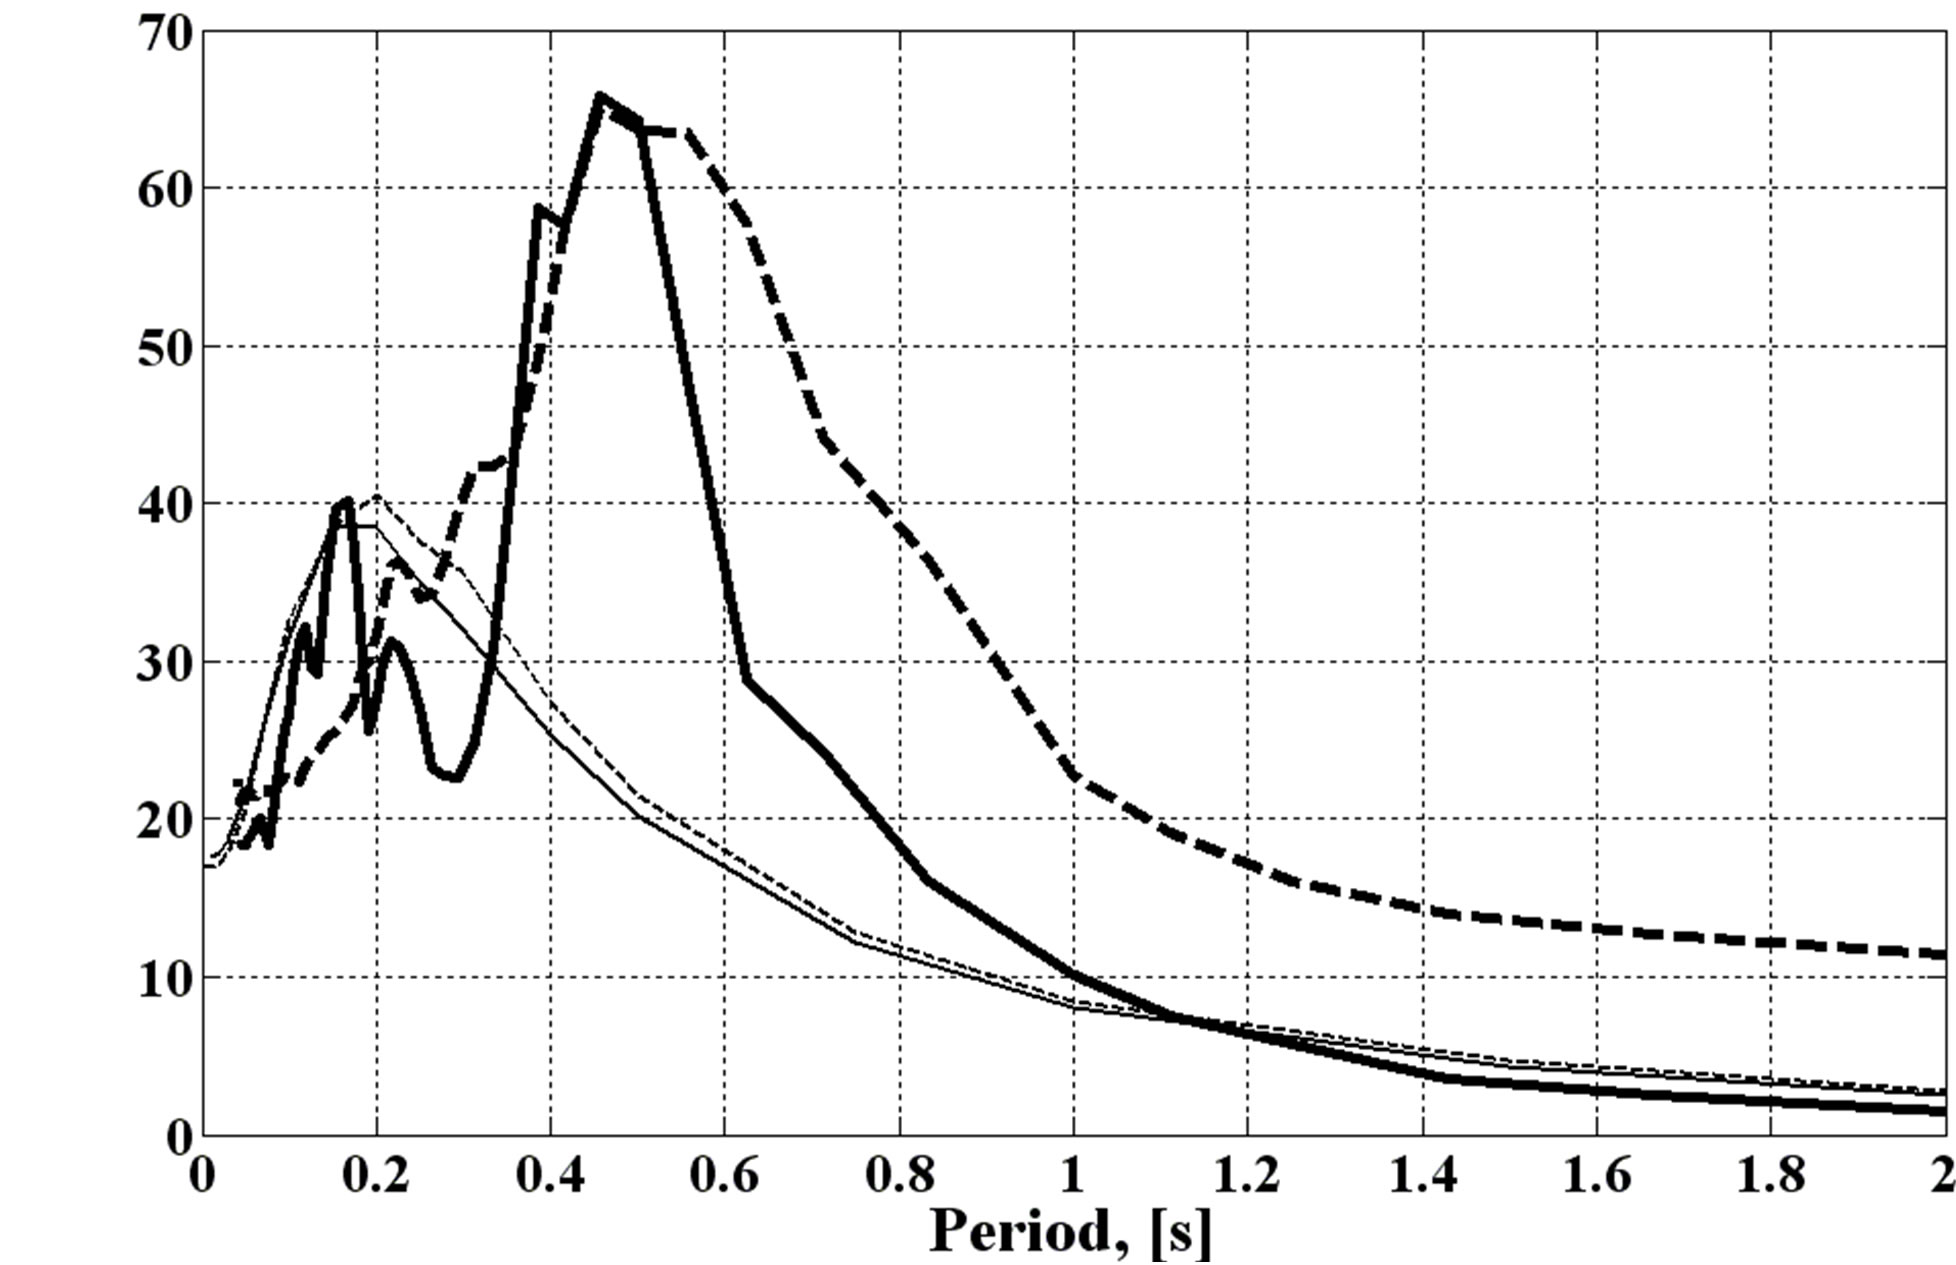
In this case, the SEEH approach is used to predict the ground shaking from a given earthquake (average the spectral accelerations of 10 simulations). The highest accelerations measured in Israel were recorded in Elat and in Lod from the Gulf of Aqaba earthquake (22 November 1995, MW = 7.2) and the Dead Sea earthquake (11 February 2004, Mw = 5.2), respectively. Both stations are at a distance of 70 km from the source. The acceleration response spectra are shown in Figure 2. Also shown in Figure 2 are the spectral accelerations that are estimated using the SEEH approach and those obtained by using the attenuation functions [19] and [20], based on the local VS,30.
Figure 2 shows good agreement between the empirical acceleration response spectra and those estimated by SEEH while there is a significant discrepancy between the spectra from actual accelerograms of the earthquakes and spectra predicted by different spectral acceleration attenuation equations. The later failed delineating both the frequency and amplification.
The NEHRP provision provides for every site class, the parameters Fa and Fv, which are correcting factors that quantify the site amplification at 0.2 s and 1 s, respectively. One of the objectives of this study is to assess whether it is advised to copy into the Israeli building code the Fa and Fv values, which are probably valid for USA sites In analogy to Fa and Fv, we calculated the site correction coefficients Qa and Qv. The coefficients Qa and Qv
 (a)
(a)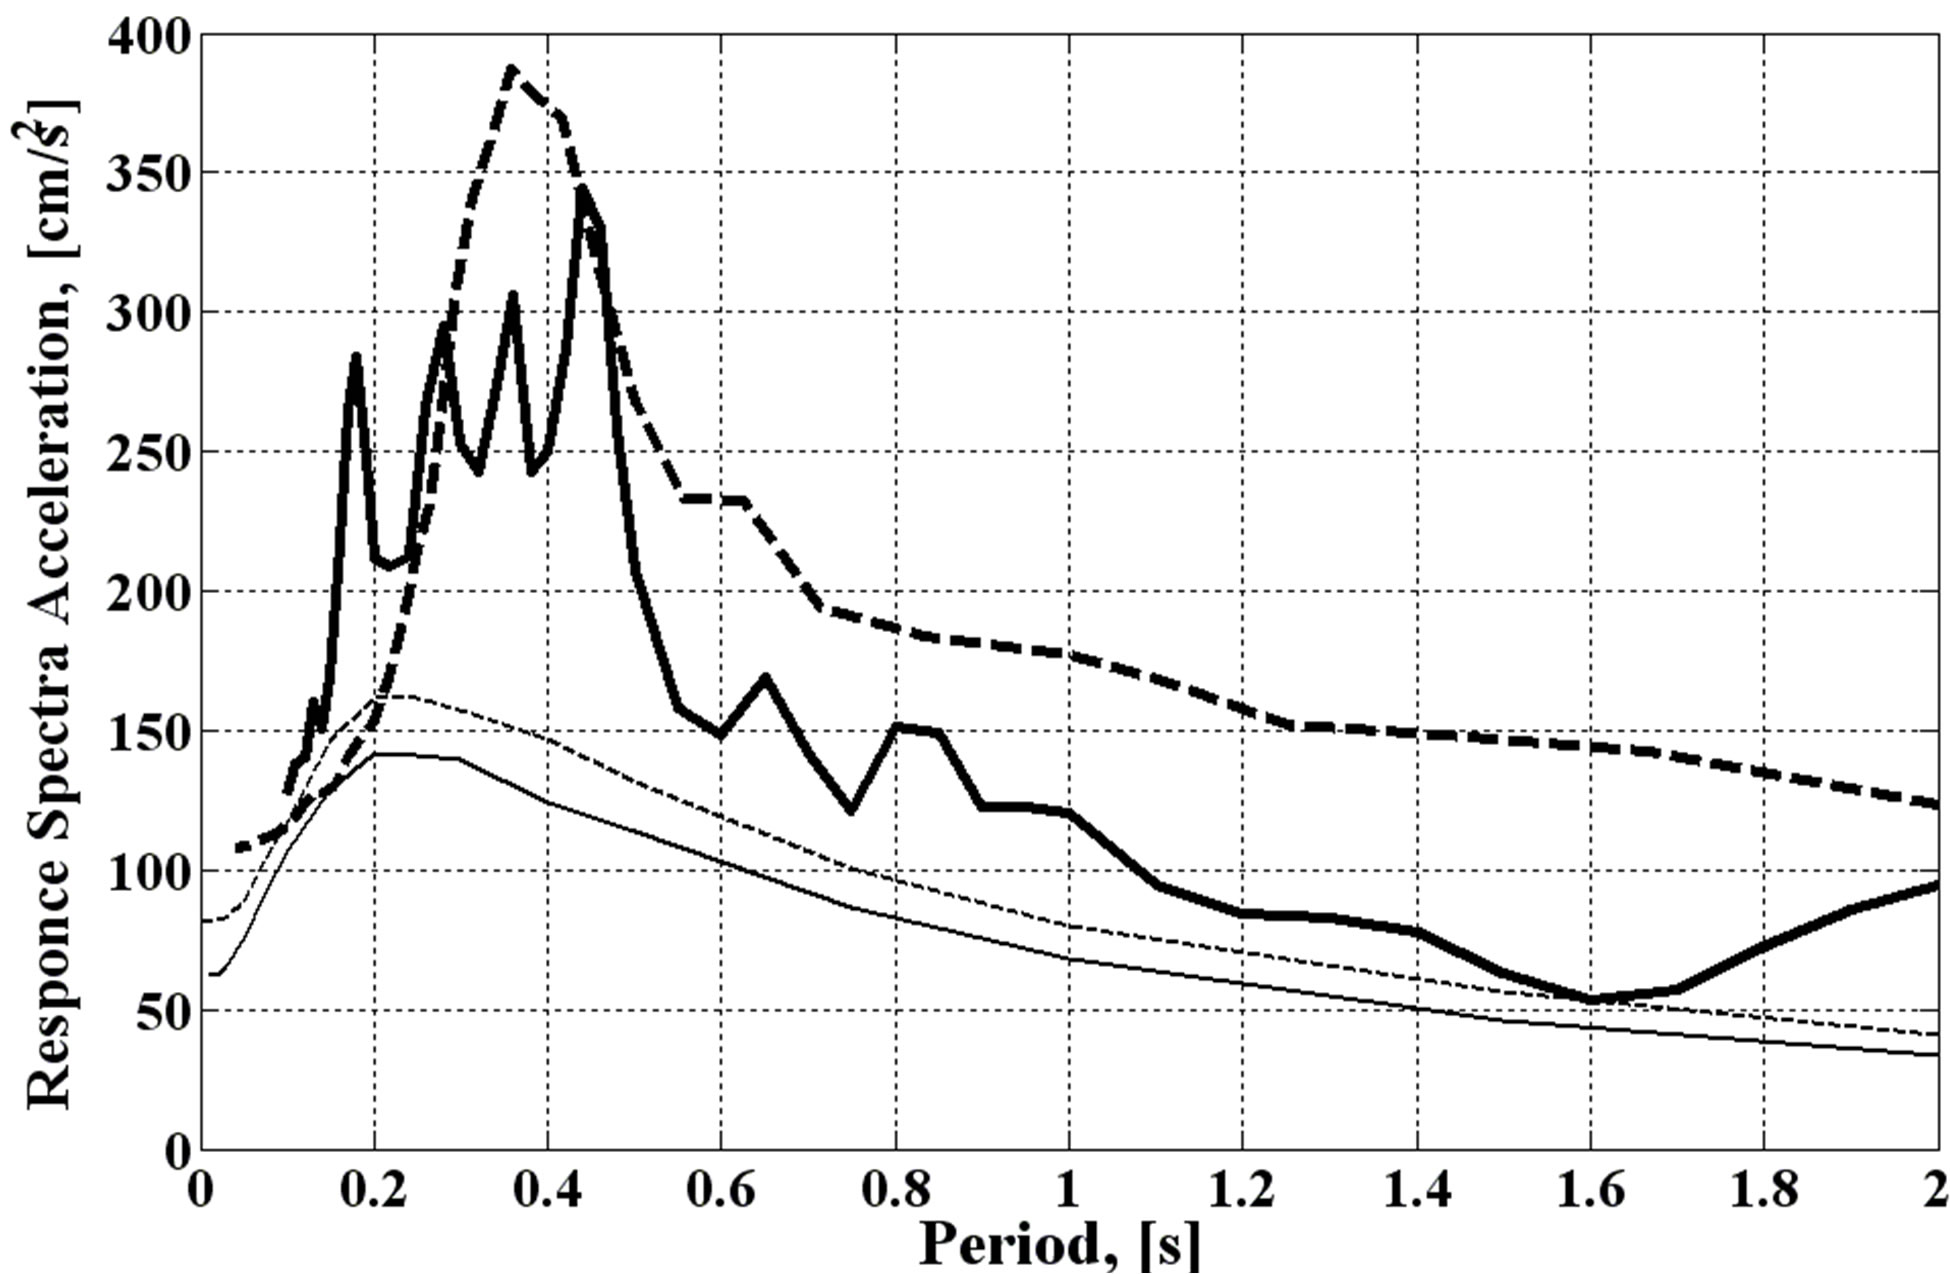 (b)
(b)
Figure 2. Comparison between acceleration response spectra obtained from earthquakes and those predicted by different methods in two cases: (a) The earthquake of Nov. 22, 1995, recorded in Elat (Mw = 7.2, distances 70 km); and (b) The earthquake of Feb. 11, 2004, recorded in Lod (Mw = 5.2, distances 70 km). Bold solid line denotes the spectra calculated from accelerograms; thin dashed line indicates response spectra calculated by using the equation [21]; thin solid line indicates response spectra calculated by using the equations [22] and the bold dashed line is the acceleration response spectrum following the SEEH approach.
are defined here as the ratio between the acceleration spectrum at the surface of real site (allowing for nonlinear behavior of the soils) to the acceleration spectrum of a rock site at the same location. Maximum spectral acceleration in the period range the 0.1 - 0.7 sec were used to determine Qa (corresponds to the period 0.2 sec) and maximum spectral acceleration in the period range 0.8 - 1.2 sec were used to determine Qv (corresponds to the period 1.0 sec).
At this point it should be emphasized that although Qa and Qv follow the same concept led to define Fa and Fv, they are not the same and their values may differ considerably. However, the scatter in Qa (or Qv) for similar soil types may tell us about the expected uncertainty in Fa and Fv when copying from the USA standards. Furthermore, when comparing Qa and Qv against VS,30 we can examine the inherent assumption that Fa and Fv are correlated with VS,30 which is used to define the site class.
3. ANALYSIS AND RESULTS
The SEEH procedure yield the uniform hazard site specific acceleration response spectra of the northern Shefela area, constituting the towns Ramla, Lod, Petah Tikva, Kefar Sava and their surrounding settlements. Based on VS,30 determinations (see Eq.1), the sites in this area are classified as sites of class D (300 sites) and class E (30 sites), as shown in Figure 3 The class D sites in these areas show peak spectral levels in a wide period range (0.1 - 1.5 sec) while sites of class E are characterized by having the highest spectral accelerations in a narrow period range (0.2 - 0.6 sec). Figure 3 also demonstrates that in these sites there seem to be a rather weak influence of the non-linear properties of the soils on site specific acceleration response spectra, probably, due to remoteness of the investigated area from seismic active zones.
Acceleration response spectra under linear and nonlinear conditions for sites in Qiryat Shemona data for classes C (44 sites) and D 16 sites) are displayed in Figure 4. The comparison suggest that in this town, the maximum of the non-linear response spectra for sites of classes C and D is about 40% lower than the spectral accelerations obtained under linear behaviour of the soils. In the town of Arad (Figure 5), levels of linear and nonlinear acceleration response spectra for site classes B and C are almost the same. Arad presents 16 models with VS,30 = 760 - 900 m/s (class B) and 19 models with VS,30 = 550 - 730 m/s (class C).
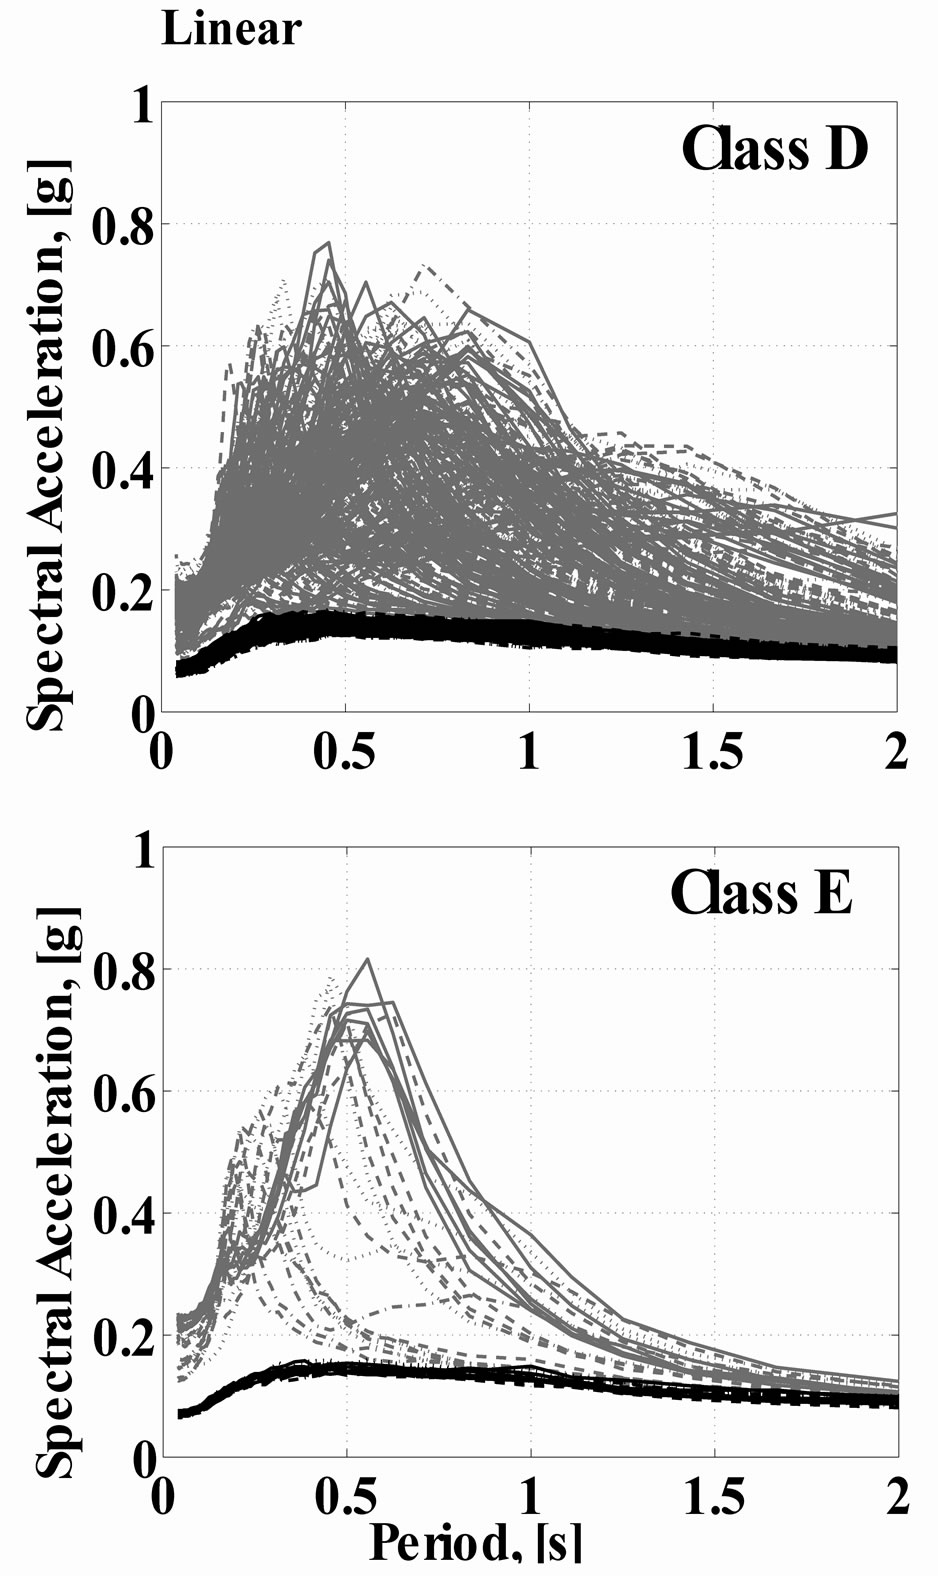
Figure 3. Uniform hazard site specific acceleration response spectra (gray lines) for different soil classes across the northern Shefela area and assessments for rock site conditions (black lines) at the same locations.
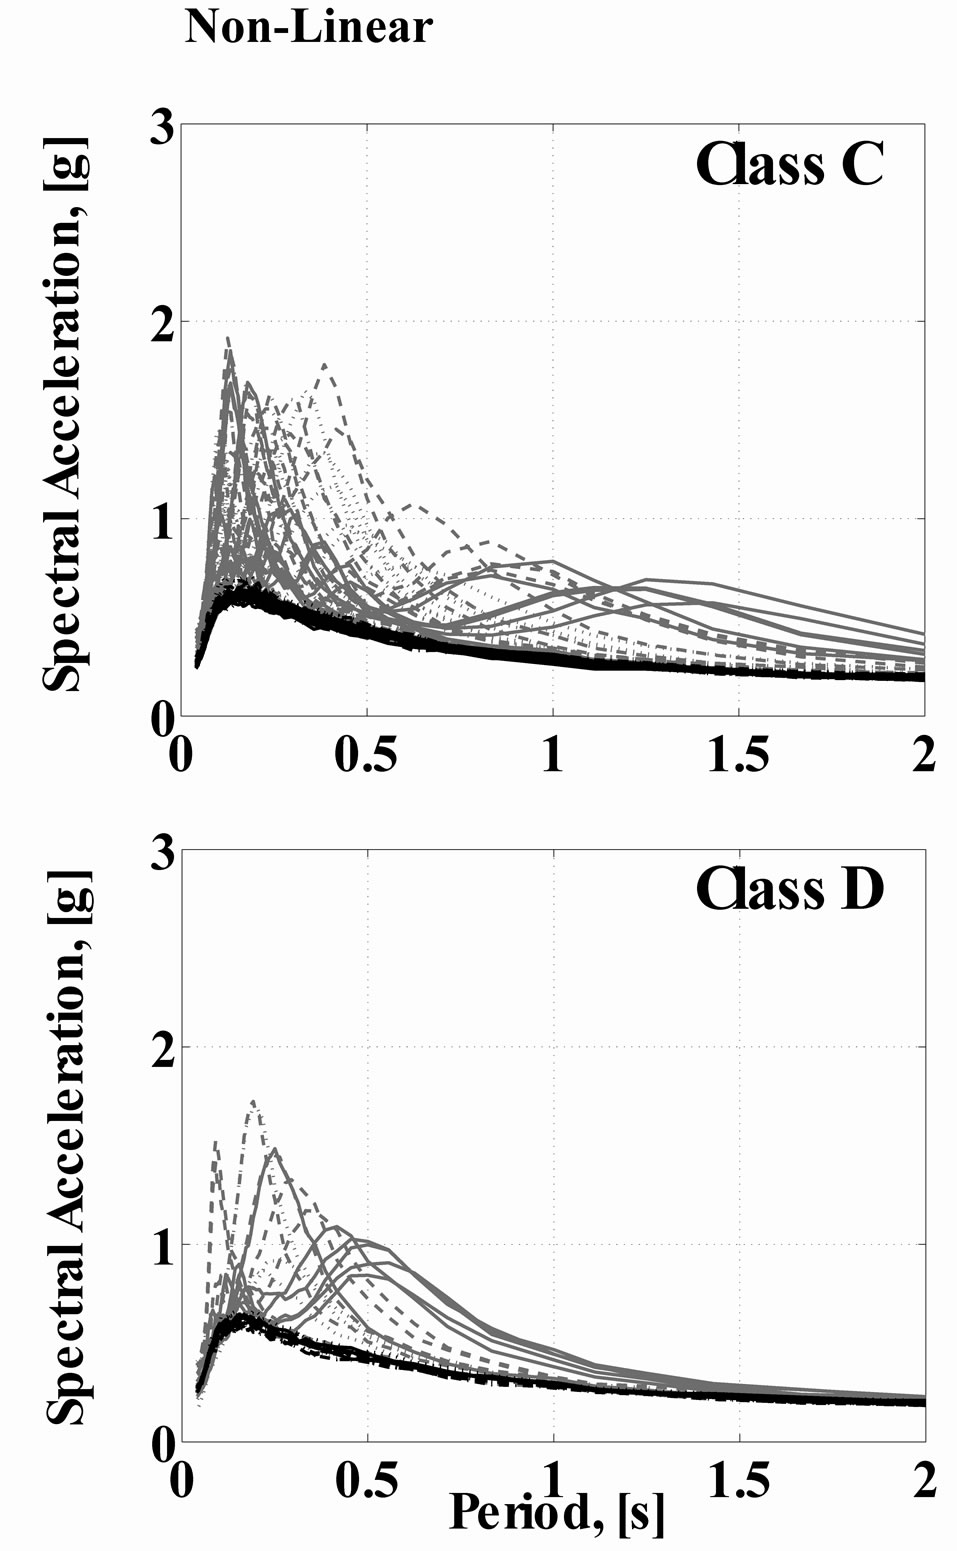
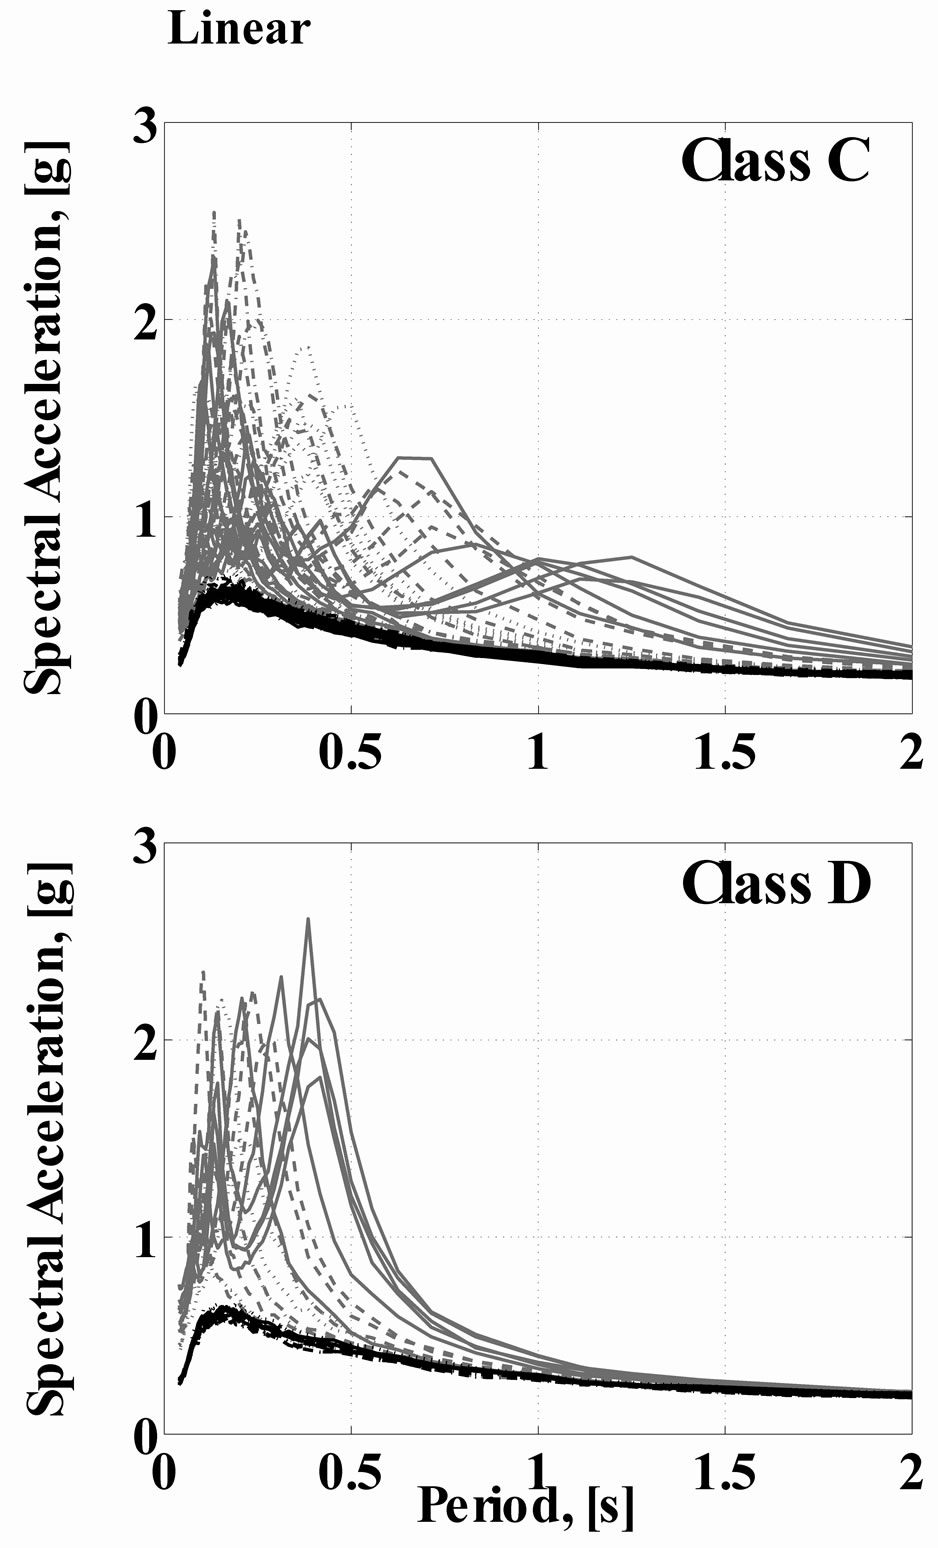
Figure 4. Uniform hazard site specific acceleration response spectra (gray lines) for different soil classes across the town of Qiryat Shemona and assessments for rock site conditions (black lines) at the same locations.
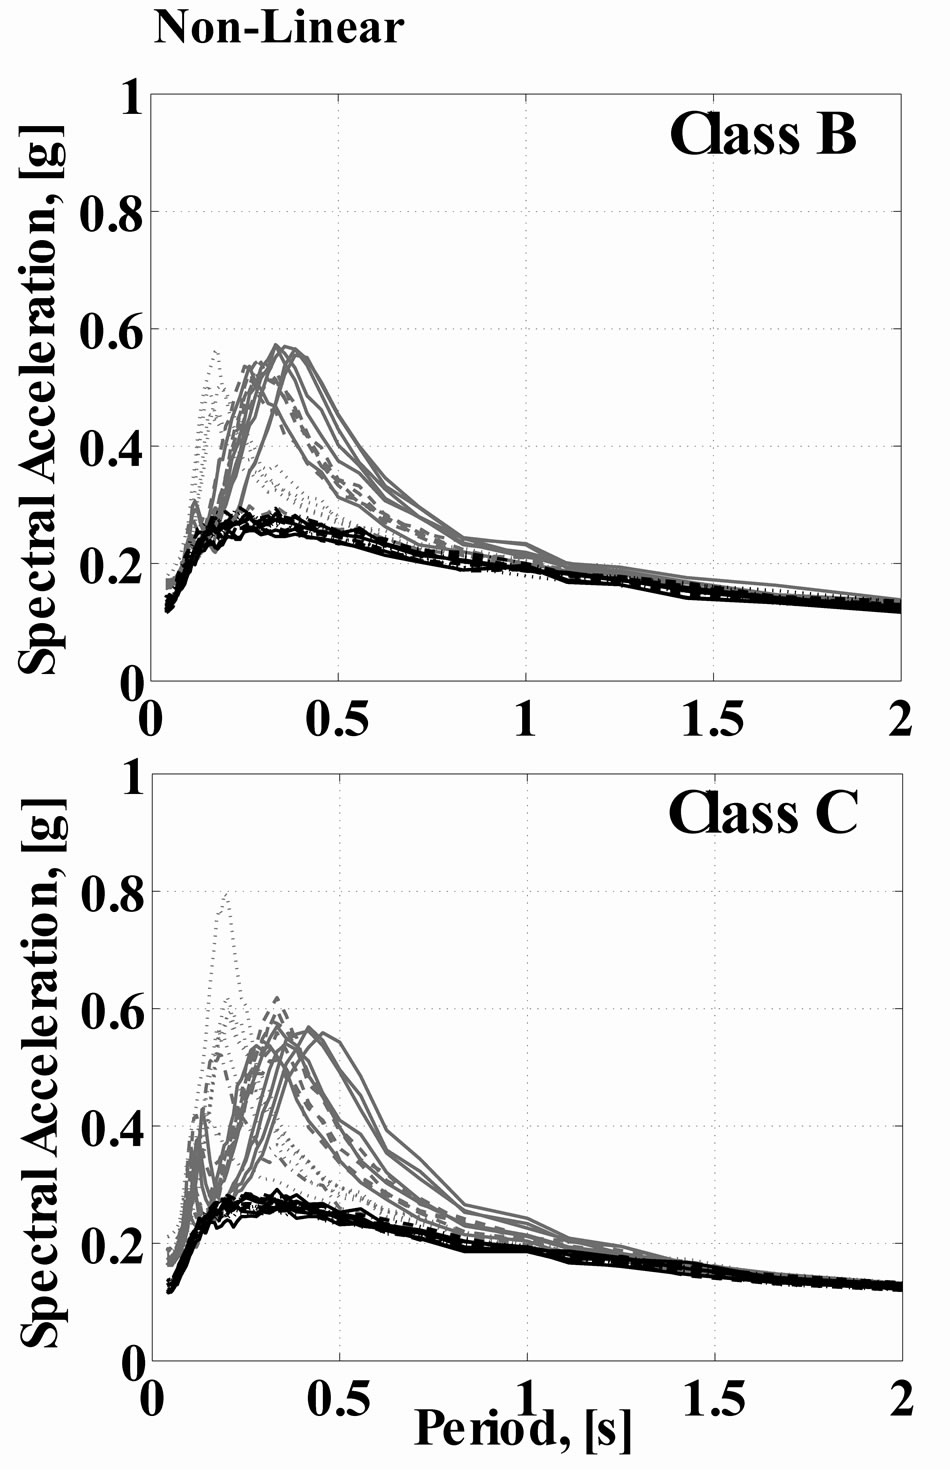
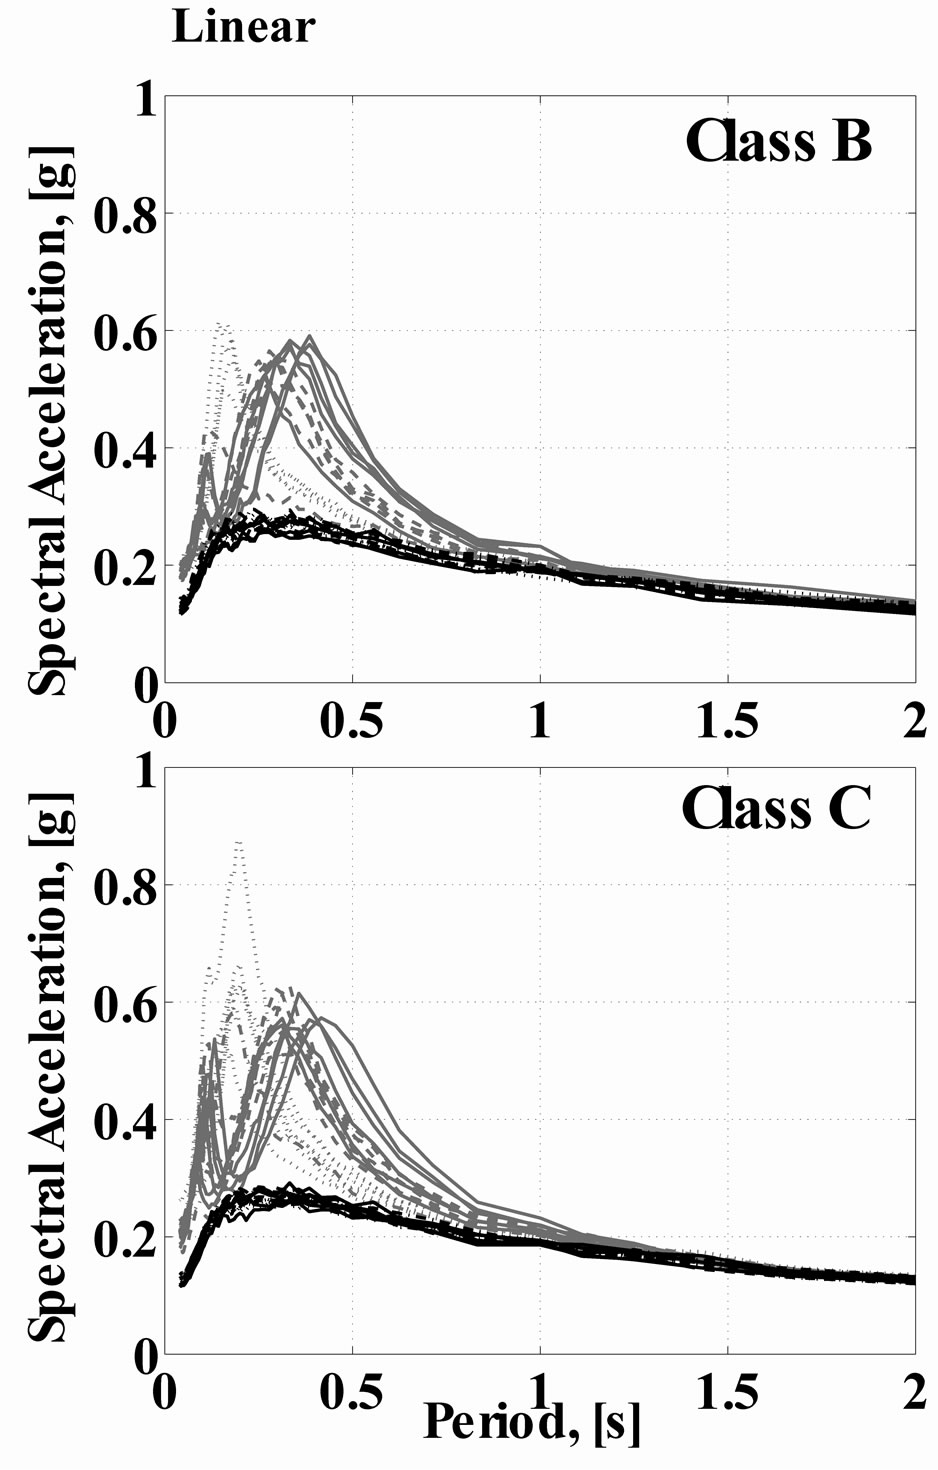
Figure 5. Uniform hazard site specific acceleration response spectra (gray lines) for different soil classes across Arad and assessments for rock site conditions (black lines) at the same locations.
Figures 3-5 demonstrate the known fact that wave propagation under non-linear conditions is associated with reduction in the amplification level. However, they also show the great variety in shape and amplitude of the acceleration spectra at sites of the same site classification and close locations (i.e., similar distance from the seismic energy source) except, of course for rock sites. These results imply expected high uncertainty of the average Fa and Fv values given in Tables 2 and 3 to be used in the Israeli building code. Table 5 presents Qa and Qv values (average and range) for different areas in Israel and different soil classes. Average values present a systematic observation that at sites of class E we should consider amplifications higher than at sites of class D.
Sites of class D are expected to amplify more than those of class C etc. However, the scatter is high even for areas of limited geographical size, let alone when trying to present average values for the whole of the territory of Israel.
A closer look on the correlation between Qa or Qv and empirical site parameters: VS,30, depth to the bedrock (h), resonance frequency of the soil column (f0) and its observed H/V amplitude (A) reveal again high scatter ad questionable correlation. As an example we present Figures 6 and 7 that show the relations obtained from 510 sites in the northern area of the Shefela region. The only clear correlation is obtained (in the Shefela region) between Qa and VS,30 i.e.,
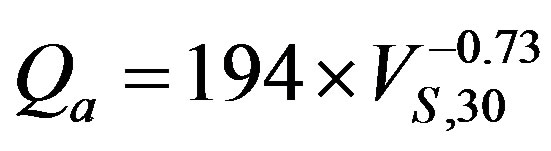 (4)
(4)
The regression coefficient is relatively high (0.9). It clearly indicates that in the Shefela, VS,30 may serve as a fair parameter to classify the site but even then, we observe a significant uncertainty (about factor 2). Such an uncertainty is expected when using a relatively wide range to VS,30 values to define the soil type (see Table 1). We note that in most areas, Qa demonstrates very poor, practically no correlation with either VS,30 or any other site depended parameters.
Qv values obtained in Shefela show a too high scatter to justify a regression analysis between Qv and VS,30. The non-correlation with other empirical site parameters is an expression of the geological complexity of the study area.
Figure 8 provides example of H/V spectral ratios of ambient noise obtained at two representative sites located at a distance of 220 m from each other. The upper layer in the lithological section for both sites is represented by alluvium of 55 m thick and VS,30 of about 400 m/s (Class C). Spectra ratios obtained at the site 1 (thick line) and the site 2 (thin line) yield two clear resonance peaks. Frequency of the second resonance peak (about 1.8 Hz) is correlated with thickness of the alluvial sediments. A sharp change in the fundamental frequency from 0.5 Hz to 1.3 Hz suggests the existence of a fault between sites 1 and 2. We note that there is significant difference in both lithological structure and depth to reflector. Between site 1 and 2 the reflector rises from 400 m up to 250 m.
4. CONCLUSIONS
From a pure seismological point of view, the shape and the intensity of a site response to seismic motions cannot be predicted by a single physical parameter (unless all other parameters are constant). The USA practice is based on a wealth of strong motion data together with engineering experience with accepting the assumption that VS,30 can be used to properly classify sites in
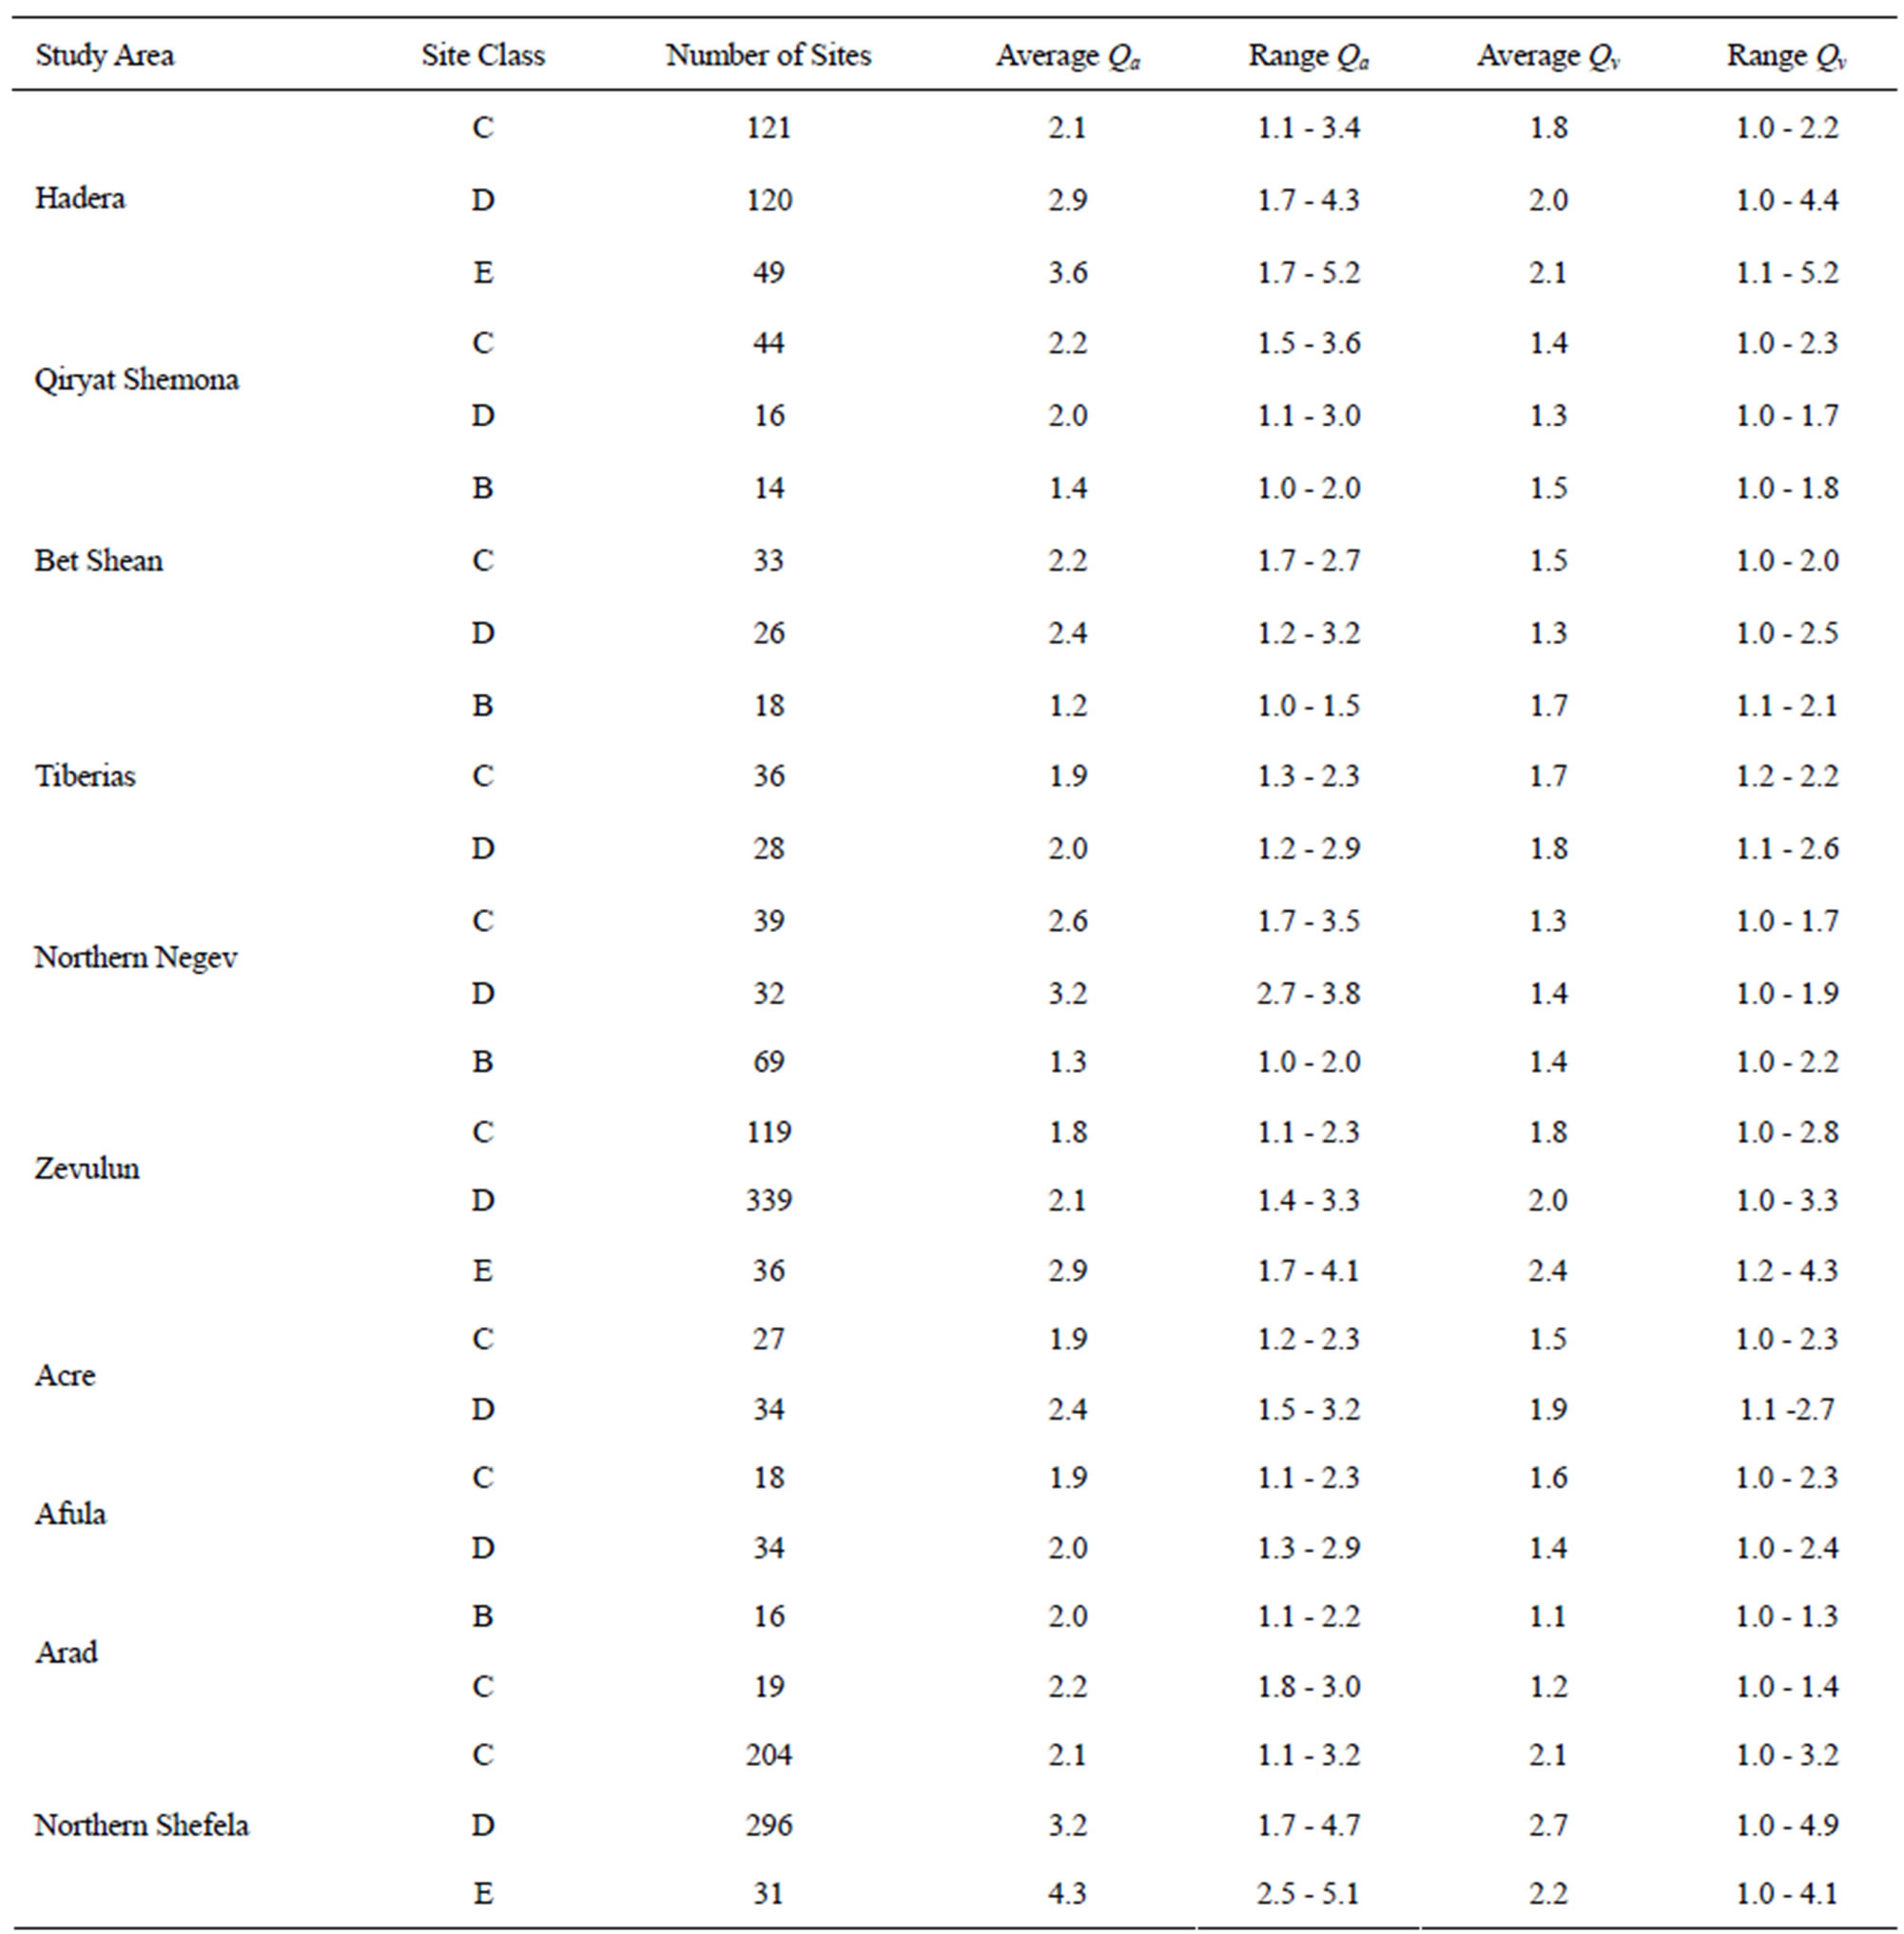
Table 5. Qa and Qv values (average and range) for different areas in Israel and different soil classes.
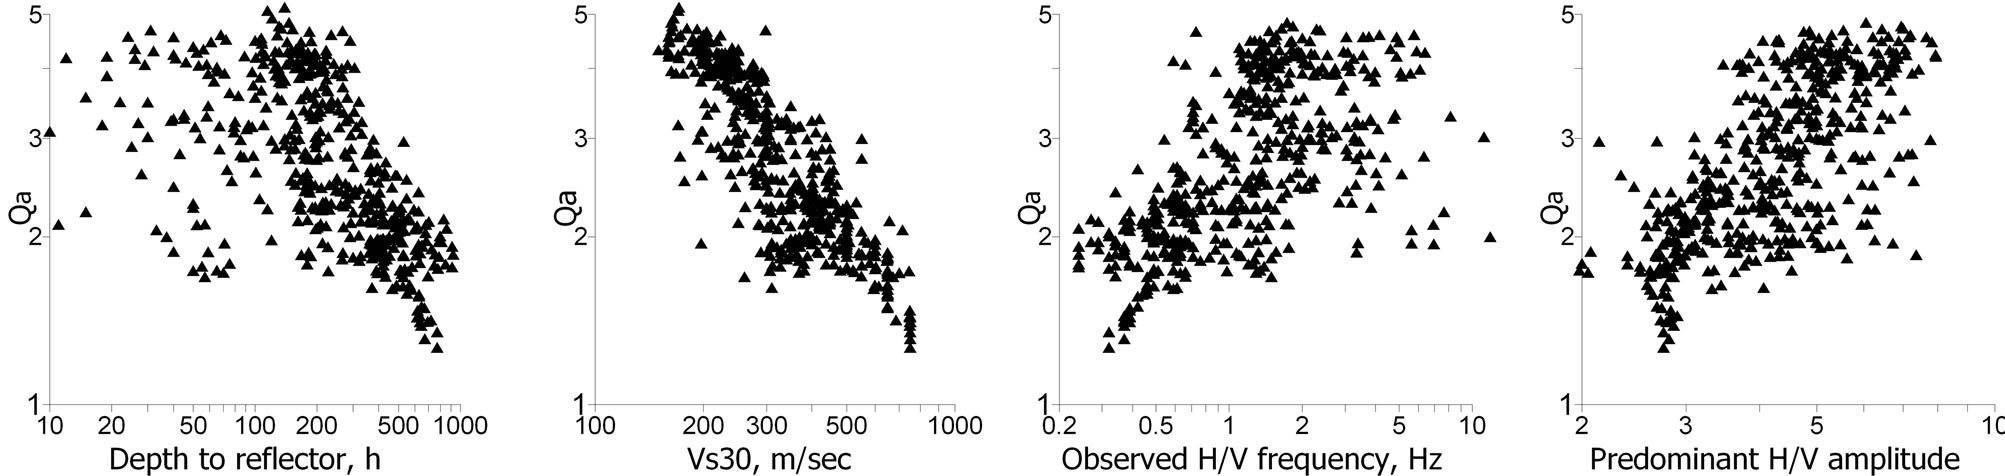
Figure 6. Relationship between Qa and site specific parameters for the Northern Shefela area.
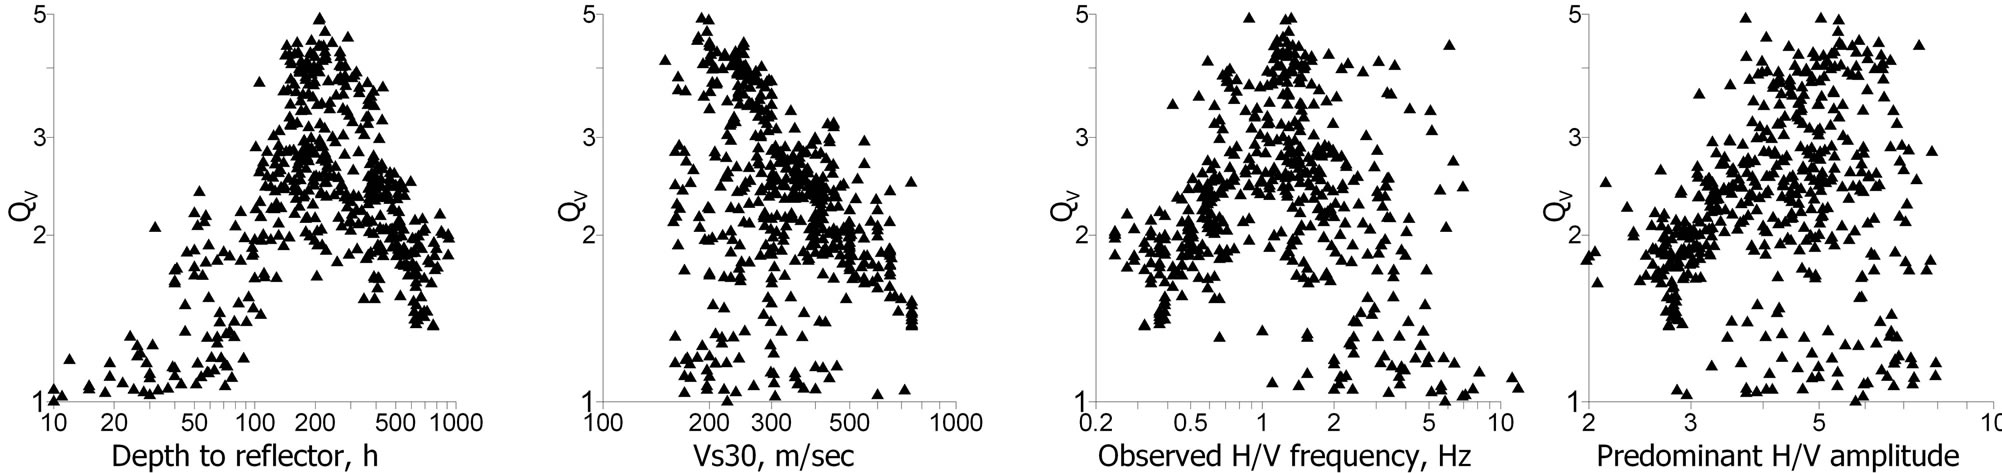
Figure 7. Relationship between Qv and site specific parameters for the Northern Shefela area.
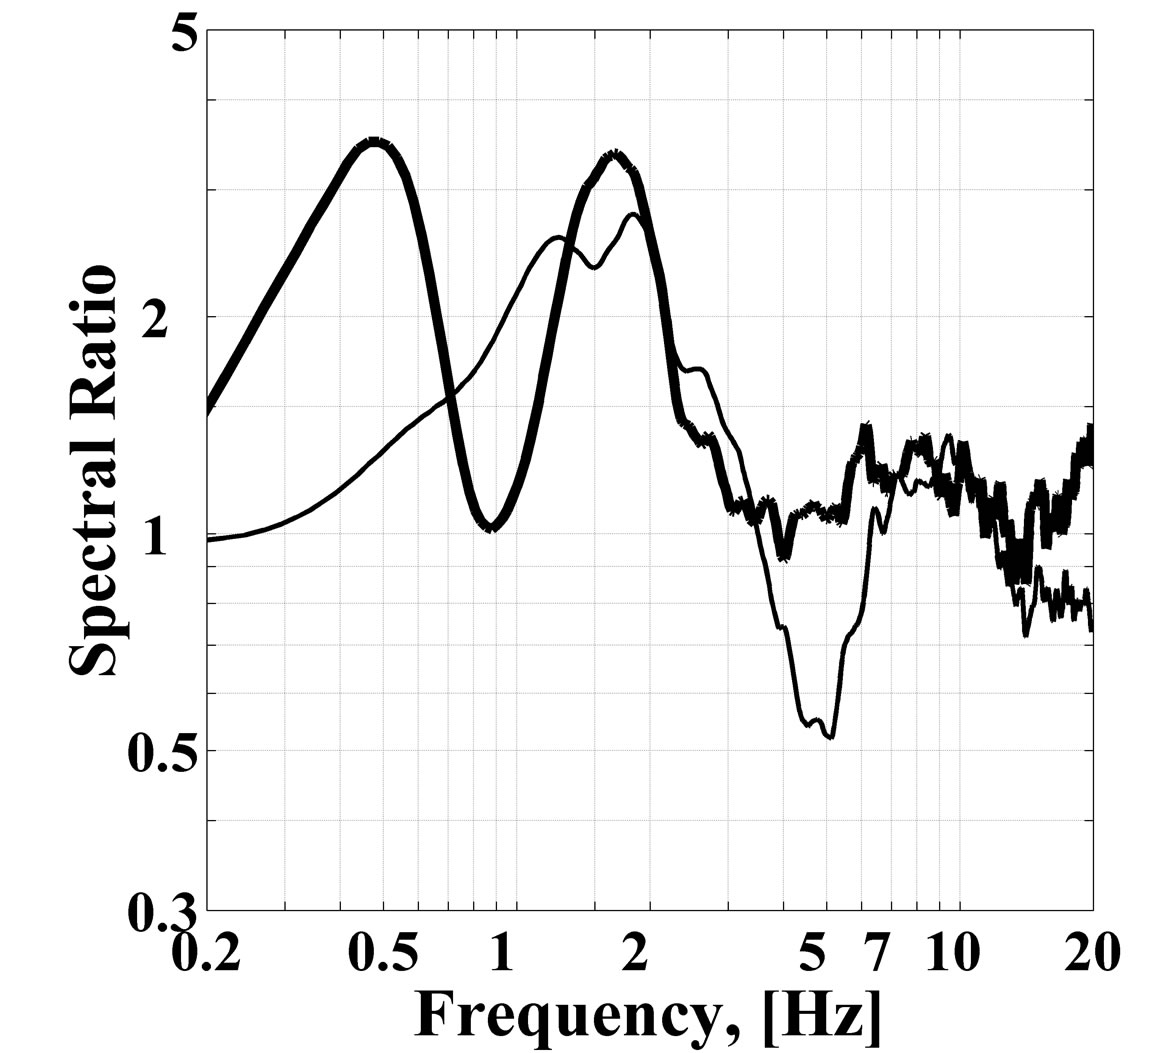
Figure 8. H/V spectral ratios of ambient noise obtained in two different locations in the town of Petah Tikva at a distance of 220 m from each other.
Israel and whether or not it can be recommended to use Fa and Fv values obtained in other countries. The applicability of NEHRP provisions to the USA is beyond the scope of this study. We also do not argue that the response of soils in the USA is different than similar soils elsewhere. The objectives of this study were associated with accepting the assumption that VS,30 can be used to properly classify sites in Israel and whether or not it can be recommended to use Fa and Fv values obtained in other countries.
Lacking local measurements of high magnitude earthquakes, we adhere to semi-empirical simulations, i.e., we used empirical data about the seismicity of our region and empirically confirmed models about the stratigraphy and S-wave velocities at Israeli sites to compute, uniform hazard acceleration response spectra for actual site conditions and for rock conditions. Consequently, we were able to compute the parameters Qa and Qv which are analog (not necessarily similar in value) to Fa and Fv, respectively.
The main conclusions of this simulation process are as follows:
The geological conditions in many areas in Israel may vary dramatically over distance as small as 200 m or less and consequently will yield great differences in site amplification effects. Rapid changes in the geological set-up can easily be detected by analysing measurements of ambient seismic noise. The differences in the local geology down to the base-rock will be responsible for significant differences in ground motions between sites of the same soil cover and similar distance from an earthquake source.
The simulations demonstrated that great complexity of site geology, sites of the same soil class (more specifically, classes D and E) even in the same town show unacceptable scatter in values of Qa and Qv. A similar scatter should be expected to be present for locally derived Fa and Fv values. Consequently, it will not be recommended to adopt Fa and Fv values derived elsewhere.
If we would like to adopt the concept of using correction values to design the site specific acceleration response spectrum, than we have to look for a more complex way to classify the site. The use of a single parameter VS,30 is a simplification that cannot be justified in the complex geological conditions as in Israel.
5. ACKNOWLEDGEMENTS
We wish to express our thanks to V. Giller, A. Shvartsburg and M. Kalmanovich who made the ambient noise measurements. The authors are grateful to D. Giller and I. Dan for help with the data processing. Finally, we thank anonymous reviewers who improved the quality of the paper.
REFERENCES
- Building Seismic Safety Council (1997) National earthquake hazard reduction program (NEHRP) recommended provisions for seismic regulations for new buildings and other structures. Part 1: Provisions (FEMA 302). Building Seismic Safety Council, Washington, DC.
- Klimis, N.S., Margaris, B.N. and Koliopoulos, P.K. (1999) Site-dependent amplification functions and response spectra in Greece. Journal of Earthquake Engineering, 3, 237- 270. doi:10.1080/13632469909350346
- Dobry, R., Borcherdt, R., Crouse, C.B., Idriss, I.M., Joyner, W.B., Martin, G.R., Power, M.S., Rinne, E.E. and Seed, R.B. (2000) New site coefficients and site classification system used in recent building seismic code provisions. Earthquake Engineering, 16, 41-67.
- Barani, A., De Ferrari, R., Ferretti, G. and Eva, C. (2008) Assessing the effectiveness of soil parameters for ground response characterization and soil classification. Earthquake Spectra, 24, 565-597. doi:10.1193/1.2946440
- Gallipoli, M. and Mucciarelli, M. (2009) Comparison of site classification from VS,30, VS,30 and HVSR in Italy. Bulletin of the Seismological Society of America, 99, 340- 351. doi:10.1785/0120080083
- Zaslavsky, Y., Shapira, A., Gorstein, M., Kalmanovich, M., Giller, V., Perelman, N., Livshits, I., Giller, D. and Dan, I. (2005) Site response from ambient vibrations in the towns Lod and Ramle (Israel) and earthquake hazard assessment. Bulletin of Earthquake Engineering, 3, 355-381. doi:10.1007/s10518-005-1243-1
- Zaslavsky, Y., Ataev, G., Gorstein, M., Kalmanovich, M., Perelman, N. and Shapira, A. (2008a) Assessment of site specific earthquake hazard in urban areas—Case study: The town of Afula, Israel, and neighboring settlements. Bollettino di Geofisica, teorica and applicata, 49, 93-108.
- Zaslavsky, Y., Ataev, G., Gorstein, M., Kalmanovich, M., Hofstetter, A., Perelman, N., Aksinenko, T., Giller, V., Dan, H., Giller, D., Livshits, I., Shvartsburg, A. and Shapira, A. (2008b) Microzoning of site response parameters in the towns of Dimona and Bet Shean (Israel). Bollettino di Geofisica, teorica and applicata, 49, 109-130.
- Zaslavsky, Y., Shapira, A., Ataev, G., Gorstein, M., Aksinenko, T., Kalmanovich, M., Perelman, N. and Hofstetter, R. (2009) Using ambient noise measurements in the process of assessing earthquake hazards in urban areas: examples from Israel. In: Miura, T. and Ikeda, Y., Eds., Earthquake engineering: New research, Nova Science Publisher, Inc., New York, 155-218.
- Nakamura, Y. (1989) A method for dynamic characteristics estimation of subsurface using microtremor on the ground surface. Quarterly Report of Railway Technical Research, 30, 25-33.
- Theodulidis, N., Bard, P.Y., Archuleta, R. and Bouchon, M. (1996) Horizontal-to-vertical spectral ratio and geological conditions: the case of Garner valley downhole in Southern California. Bulletin of the Seismological Society of America, 86, 306-319.
- Reinoso, E. and Ordaz, M. (1999) Spectral amplification for Mexico City from free-field recordings. Earthquake Spectra, 15, 273-295. doi:10.1193/1.1586041
- Pratt, T. and Brocher, T. (2006) Site response and attenuation in the Puget Lowland, Washington state. Bulletin of the Seismological Society of America, 96, 536-552. doi:10.1785/0120040200
- Schnabel, P.B., Lysmer, J. and Seed, H.B. (1972) SHAKE —a computer program for earthquake response analysis of horizontal layered sites. Report. No. EERC 71-12, Earthquake Engineering Research Center, Berkeley.
- Joyner, W.B. (1977) A Fortran program for calculating nonlinear seismic response. Open File Report 77-671, US Geological Survey, Rolla.
- Shapira, A. and van Eck, T. (1993) Synthetic uniform hazard site specific response spectrum. Natural Hazard, 8, 201-215. doi:10.1007/BF00690908
- Boore, D.M. (1983) Stochastic simulation of high-frequency ground motions. Bulletin of the Seismological Society of America, 73, 1865-1894.
- Boore, D. and Atkinson, G. (1987) Stochastic prediction of ground motion and spectral response parameters at hard-rock site in eastern North America. Bulletin of the Seismological Society of America, 77, 440-467.
- Shapira, A. and Hofstetter, A. (1993) Source parameters and scaling relationships of earthquakes in Israel. Tectonophysics, 217, 217-226. doi:10.1016/0040-1951(93)90005-5
- Shapira, A. and Hofstetter, A. (2002) Seismicity parameters of seismogenic zones. http://www.seis.mni.gov.il/heb/Teken/seismicity-rprt.htm
- Boore, D. and Atkinson, G. (2008) Ground-motion prediction equations for the average horizontal component of PGA, PGV, and 5%-damped PSA at spectral periods between 0.01 s and 10.0 s. Earthquake Spectra, 24, 99-138. doi:10.1193/1.2830434
- Campbell, K.W. and Bozorgnia Y. (2008) NGA ground motion for the mean horizontal component of PGA, PGV, PGD and 5% damped linear elastic response spectra for periods ranging from 0.01 to 10 s. Earthquake spectra, 24, 139-171. doi:10.1193/1.2857546