Natural Science
Vol.4 No.6(2012), Article ID:19970,14 pages DOI:10.4236/ns.2012.46052
Stability and flocculation of nanosilica by conventional organic polymer
![]()
BRGM Environment & Processes Division 3, Orléan, France; m.bizi@brgm.fr
Received 25 April 2012; revised 22 May 2012; accepted 11 June 2012
Keywords: Bridging Flocculation; Coagulation; Nanoparticles; Nanotechnologies; Silica; Zeta Potential
ABSTRACT
More than 2,000,000 tons of silica nanoparticles (NPs) are produced annually in the world to cover the needs of nanotechnologies. Inevitably, a quantity of NPs, will be in industrial discharges and domestic, or even in water resources. Share their high surface reactivity, these NPs may also carry with them through a specific adsorption of other toxic chemical pollutants inherent to the industrial sectors. To preserve public health and the environment from this pollution, it is necessary to remedy the potential pollution. In this context, the main motivation of this work is to answer this environmental issue by proposing a scheme of remediation based on the use of a conventional treatment process. The process of elimination nanoparticles by coagulation/flocculation was selected for its simplicity and also for its universal use. The NPs of industrial silica S30R50 were used as support to develop the process. The optimization of coagulation/flocculation, was greatly facilitated by the use of laser diffraction online. This technique allowed to follow the dynamic character of the treatment and to determine the size and the most relevant textural parameters (density, porosity and fractal dimension) of the flocs depending on the nature of the used reagents. The critical concentrations of different coagulants and flocculants used were determined by electrophoresis and turbidity. The ratio of their charge density/molecular weight has conditioned the quality of separation, the floc size and their texture. Excellent coagulation/flocculation performances are reached using organic reagents authorized by the Directorate General for Health of several countries. After optimization of the process, the size distributions are between 10 µm and 1 mm, with fractal dimensions (compactness) ranging from 2.3 to 2.5. The performances obtained show that the use of cationic polymers is a promising potential route to treat other types of NPs. The treatment proposed to reach a ratio of average diameters dFloc/dNP of 3500, and therefore it facilitates the elimination of these NPs agglomerated by filtration
1. INTRODUCTION
The current surge in nanotechnologies has been made possible by recent technological progress. They are already widely used in industry to synthesize new products with new properties, making it possible to satisfy the expectations of the consumer society. The nanomaterials on the market are therefore used in many fields, from electronics to medicine, including textiles and surface coatings. It is expected that NPs will soon be omnipresence in products used in every-day life, and this will entail a remarkable socio-economic revolution.
The factors that confer these materials with new properties and might present a risk are size, particle shape, form factor (ratio between extreme dimensions), size distribution, specific surface, chemical composition, surface charge, surface reactivity, stability, dispersion behaviour and crystallinity [1,2]. Particles are considered to be nanometric when one of their dimensions is between 1 and 100 nm.
The most common nanoparticles used for consumer products are metallic nano-oxides (SiO2, TiO2, ZnO, CeO2, Al2O3, etc.), gold, nano-silver and nano-clays. Silica, for example is used in tyres, paints, solar panels, sports equipment, cleaning products and dietary supplements. It is by far the most vastly produced. In France, it represents around 500,000 tonnes, or 2 times more than TiO2, the second type of NP manufactured.
Nevertheless, this enthusiasm for nanotechnological progress goes hand in hand with a growing awareness of the inherent environmental and toxic impacts. The nanometric size of nanoparticles makes them relatively mobile in the environment, bioavailable to living organisms, and therefore potentially toxic. Furthermore, their large specific surfaces and surface reactivity facilitates their bio-physico-chemical interaction with environmental components. Special attention must therefore be paid to the fate of nanomaterials when they are discharged into the environment, either accidentally or in the course of their normal use. They will inevitably end up in industrial waste, then solid municipal waste, or even water resources. In the environment, NPs can disperse, aggregate, adsorb other soil pollutants or be absorbed by organisms depending on the media’s physicochemical properties.
At the present time, no monitoring is being done to take into account risks that might be caused by gaseous, solid or liquid waste containing NPs. However, in all industrialized countries, governments recommend the treatment of this waste at the source. For example, Article 191 concerning the environment in the consolidated version of the Treaty on European Union states, “Union policy on the environment shall aim at a high level of protection taking into account the diversity of situations in the various regions of the Union. It shall be based on the precautionary principle and on the principles that preventive action should be taken, that environmental damage should as a priority be rectified at source and that the polluter should pay.”
In this context, and considering the quantities of silica produced and its various uses and methods of manufacturing, it is crucial that industrial waste rich in silica NPs be treated. Treatment processes must also be developed and implemented at the source of effluents.
Silica NPs can also transport, by specific adsorption, other chemical pollutants inherent in the original Industrial sectors. Their reactivity with pollutants is much greater than that of larger silica particles [3]. The hydrated silanol groups at the surface of silica induce strong polarity and high surface free energy. Our aim is to reduce the risk of pollution by eliminating silica nanoparticles in water. We suggest using flocculation— the least-expensive solid/liquid separation method.
The basic material chosen for this study is a nanometric amorphous silica used by industry in catalysis, coating/paint, polishing and textiles [4,5]. Nanosilica is marketed as a pulp and meets the specifications of these industries. It is pure (>99%), its particles are spherical, and they have an almost uniform size distribution.
In terms of pollution, the example most often cited is that of post-polishing effluents. The major contamination is metallic. During chemical mechanical polishing (CMP), around 1012 at./cm² of metallic atoms are liberated [5]. In effluents, depending on mechanical, electric and physico-chemical properties, the silica NPs can be single or complexed with any pollutants present.
This paper is an introduction to all initiatives to treat effluents of industries using NPs, with and without contamination. Its aim is to evaluate the behaviour of NPs when subjected to solid/liquid separation by coagulation and flocculation. It addresses the key points of a future global environmental study:
Ÿ The basic characterization of this product;
Ÿ The stability of this silica as a function of pH;
Ÿ The methodology of treatment at the source of an effluent rich in silica NPs, which requires that suitable materials be identified.
The originality of this work resides in the treatment of a nanometric product widely used in industry, smaller than 100 nm, as a highly diluted suspension (0.1 g/L). The use of reagents that are currently certified and authorized by the Directorate General of Health is one of the strengths of this procedure.
2. MATERIALS AND METHODS
2.1. Material
The silica nanoparticle suspension used was supplied by the Clariant Corporation. It is marketed under the name “Klebosol 30R50”. It is made up of spherical amorphous silica nanoparticles with an average diameter of 50 nm, according to Clariant, and is 30% in solid concentration. The suspension is stabilized in an alkaline environment where total Na2O is less than 0.2%. It has a pH of 8.7 ± 0.1. “R” indicates antibacterial protection [4].
2.2. Methods Used to Characterize Silica NPs
The NPs were diluted to 10 mg/L and observed directly with a Philips C200 Transmission Electron Microscope (TEM). Density and specific surface were determined on a sample that was freeze-dried and degassed at 110˚C to a residual vacuum of 2 Pa.
The density was determined by helium pycnometry using a MicroMeritics AccuPyc 1330. The specific surface was measured by nitrogen adsorption using the BET method [6] with a MicroMeritics ASAP 2010 adsorptometer for relative pressures between 0.02 and 0.2. The size of the nitrogen molecule at 77 K is set at 0.162 nm².
The particle size distribution, zeta potential and treatment were done on a secondary suspension prepared from the stock solution with Milli-Q water (resistivity 18 MW/cm) at a concentration of 0.1 g/L and an equilibrium pH of 6.1 ± 0.1 at 20˚C. The turbidity of this diluted suspension is 18 ± 1 NTU (the suspension is almost transparent). It was measured with turbidity meter Turb 555 IR (l = 860 nm).
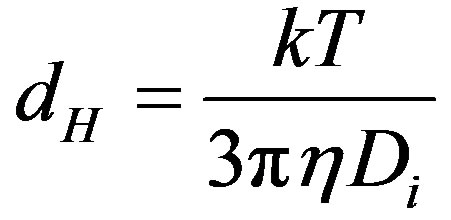
Size distribution as a function of pH was determined with a Zetasizer Nano ZS (Malvern Instruments Ltd., UK). This apparatus determines the size by first measureing the Brownian motion of the particles in a sample using Dynamic Light Scattering (also know as Photon Correlation Spectroscopy or PCS). It does this by illuminating the particles with a laser and analysing the intensity fluctuations in the scattered light. The rate of the intensity fluctuation is used to calculate the size of particles. The relationship between the size of a particle and its speed due to Brownian motion is defined in the Stokes-Einstein equation (Eq.1). The particle size measured is the hydrodynamic diameter of the sphere that diffuses at the same speed as the particles being measured. The basic distribution obtained from a DLS measurement is intensity. All other distribution is generated from this.
 (1)
(1)
where dH is the average hydrodynamic diameter, Di is the average diffusion coefficient, k is the Boltzmann constant, T is the absolute temperature and h is the dynamic viscosity of the solvent.
For consistency when analysing data obtained before and after flocculation, size distributions are all given in volume.
The refractive index used for the determination of particle size is 1.467 (~1.47). This value was obtained from the linear relationship (Eq.2) between the refractive index and the density of silica (silica polymorphs) with no chemical impurities [7]. Measuring the refractive index at a wavelength of 632.8 nm by m-line spectroscopy on an amorphous silica substrate having a density of 2.203 g/cm3 gives an index of 1.4702 [8], which is almost identical to the calculated value.
 (2)
(2)
where n is the refractive index, rS is the average density of the solid and R2 is the coefficient of determination.
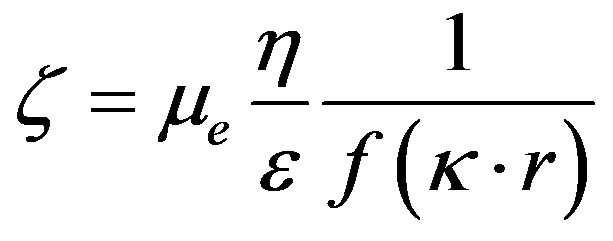
Electrokinetic potential (zeta potential) was measured with a Zetasizer IV (Malvern Instruments Ltd.). The Zetasizer IV uses electrophoresis to determine this potential. The electrophoretic mobility is related to the zeta potential of the particles by the Henry Equation [9].
 (3)
(3)
 (4)
(4)
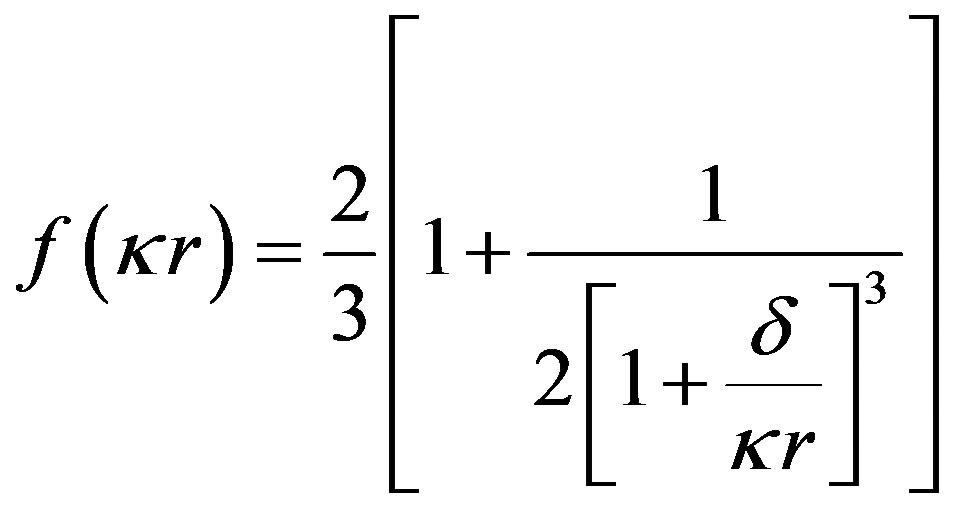
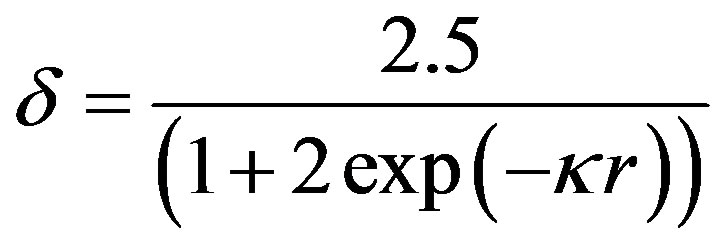
Ohshima’s approximation [10]
 (5)
(5)
 (6)
(6)
Smoluchwski’s formula
 (7)
(7)
Hückel’s formula
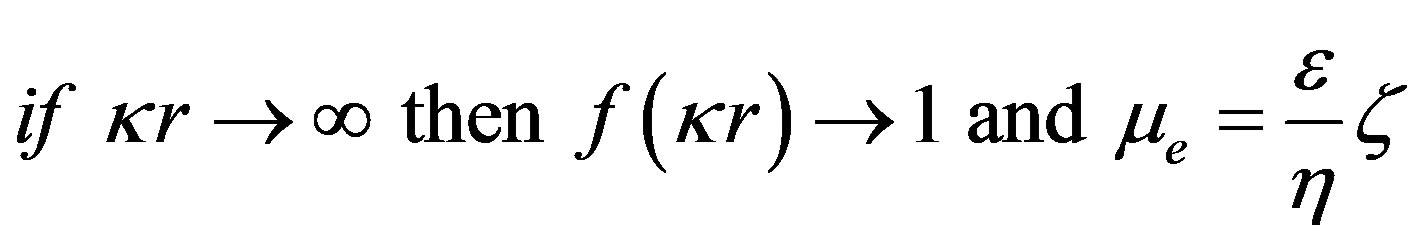
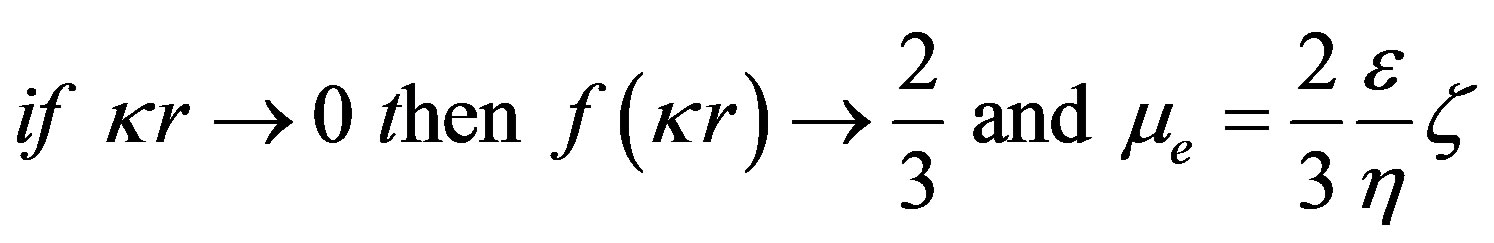
¦(kr) is the Henry correction factor. It depends on the size of the particles, their form factor and the ionic strength of the environment by taking into account the thickness of the diffuse layer (1/k).
Knowledge of the sign and value of the zeta potential is important since the surface charge governs the stability or state of dispersion, the choice of the type of coagulant and/or flocculant to be used to obtain a good agglomeration and the reagent concentration. This parameter must, therefore, be determined as a function of pH.
Silica immersed in water acquires a pH-dependant surface charge. The extent and the sign of this surface charge depend on the H+ and OH– concentrations in the solution. The surface charge appears during immersion as silanol surface sites become hydrated [11,12]. They can then be ionized, depending on pH, as described by the following reactions:
Si—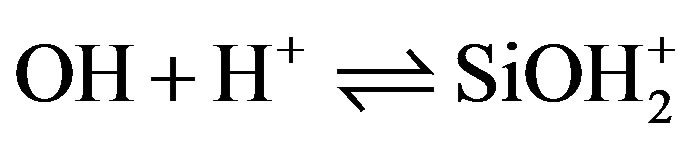 (8)
(8)
Si—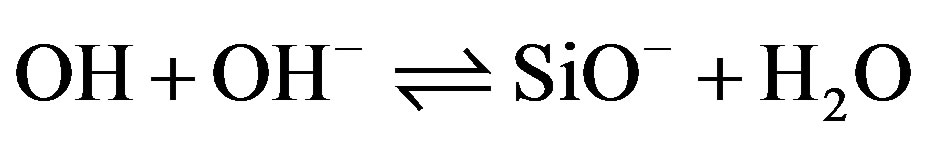 (9)
(9)
The solid can therefore be considered to be an ion exchanger whose exchange capacity is pH-dependent. To these acid-base equilibria associated with the Si—OH surface sites, we must introduce reactions of the charged sites (SiOH2+, SiO–) with counterions in solution (Cl– and Na+) introduced to control the pH [13].
Si—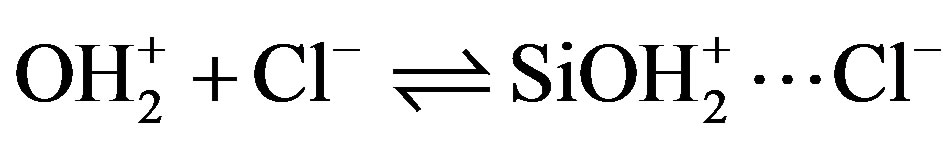 (10)
(10)
Si—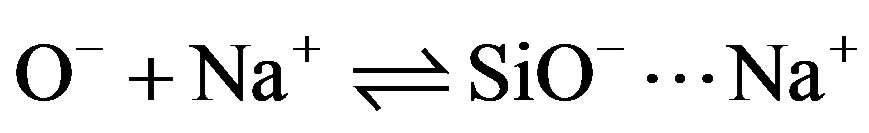 (11)
(11)
This suite of equilibrium reactions leads to a given surface charge as well as to a distribution of charge farther from the interface.
This potential was measured at 20˚C and the pH was adjusted with HCl or NaOH.
2.3. Nanoseparation
Solid/liquid separation by coagulation and flocculation is done to provide clean water containing no NPs. The basic principle is to agglomerate the NPs, turning them into visible entities that can settle rapidly and/or be removed by classical filtration, which is already part of water treatment processes. We must, therefore, use nontoxic reagents that respect the environment and develop dense flocs larger than 10 µm, with low permeability and a fractal dimension of around 3. To do this, a well-targeted set of reagents was selected. Combinations of 4 organic coagulants and 3 flocculants supplied by SNFFLOERGER were tested. The coagulants are in liquid form and the flocculants are powders. They were prepared at concentrations of 2 g/L and 0.5 g/L, respectively. Tables 1 and 2 give their main characteristics. The best combination was determined by jar test with 6 identical reactors. Each of these was equipped with 4 orthogonal baffles and a 5.1 × 5.1 mm square, single-blade, leaf-type, stainless steel agitator [14]. The volume of the suspendsion in each reactor was 0.8 L at a concentration of 0.1 g/L. Coagulation was done at 300 rpm (G = 583 s–1) for 10 min, followed by flocculation at 100 rpm (G =133 s–1) for 5 min. The average gradient values applied were calculated using the power curve of these reactors [14]. During conditioning, the contact between particles is caused by the differences in velocity gradients created in the suspensions by mechanical mixing. This is an orthokinetic mechanism. Under these conditions, perikinetic aggregation (particle collisions caused by Brownian motion) is insignificant.
In the nomenclature for coagulants and flocculants, the first two numbers indicate molecular mass, FL4520 having a lower mass than FL4820. The proportion of active matter is indicated by the 2 last numbers. The charge density is expressed as a percentage of ionogenic group relative to all groups. When the exact information about charge density and molecular weight is not accessible for the commercially available materials, the approximate categories of high, medium and low will be used, as defined in Table 2.
Polyamines and PolyDADMACs are organic coagulants that may completely or partially replace the inorganic coagulants (aluminium sulphate, aluminium perchloride, ferric chloride, etc.). These substances are approved for drinking water in many countries. For confidentiality reasons, SNF-FLOERGER does not provide the molecular weight of coagulants.
These flocculants are used to treat drinking water, waste process water, municipal sewage and ores.
The solid/liquid separation method used here is based on the neutralization of the negative charge of the silica with the coagulant, followed by bridging flocculation.
The concentration needed to neutralize the charge of the silica was determined by testing with solutions having increasing cationic coagulant concentrations, after which the zeta potential and turbidity were measured. The optimum coagulation concentration (OCC) is the quantity of coagulant that results in zero zeta potential and maximum turbidity.
This was determined by observing the evolution of the
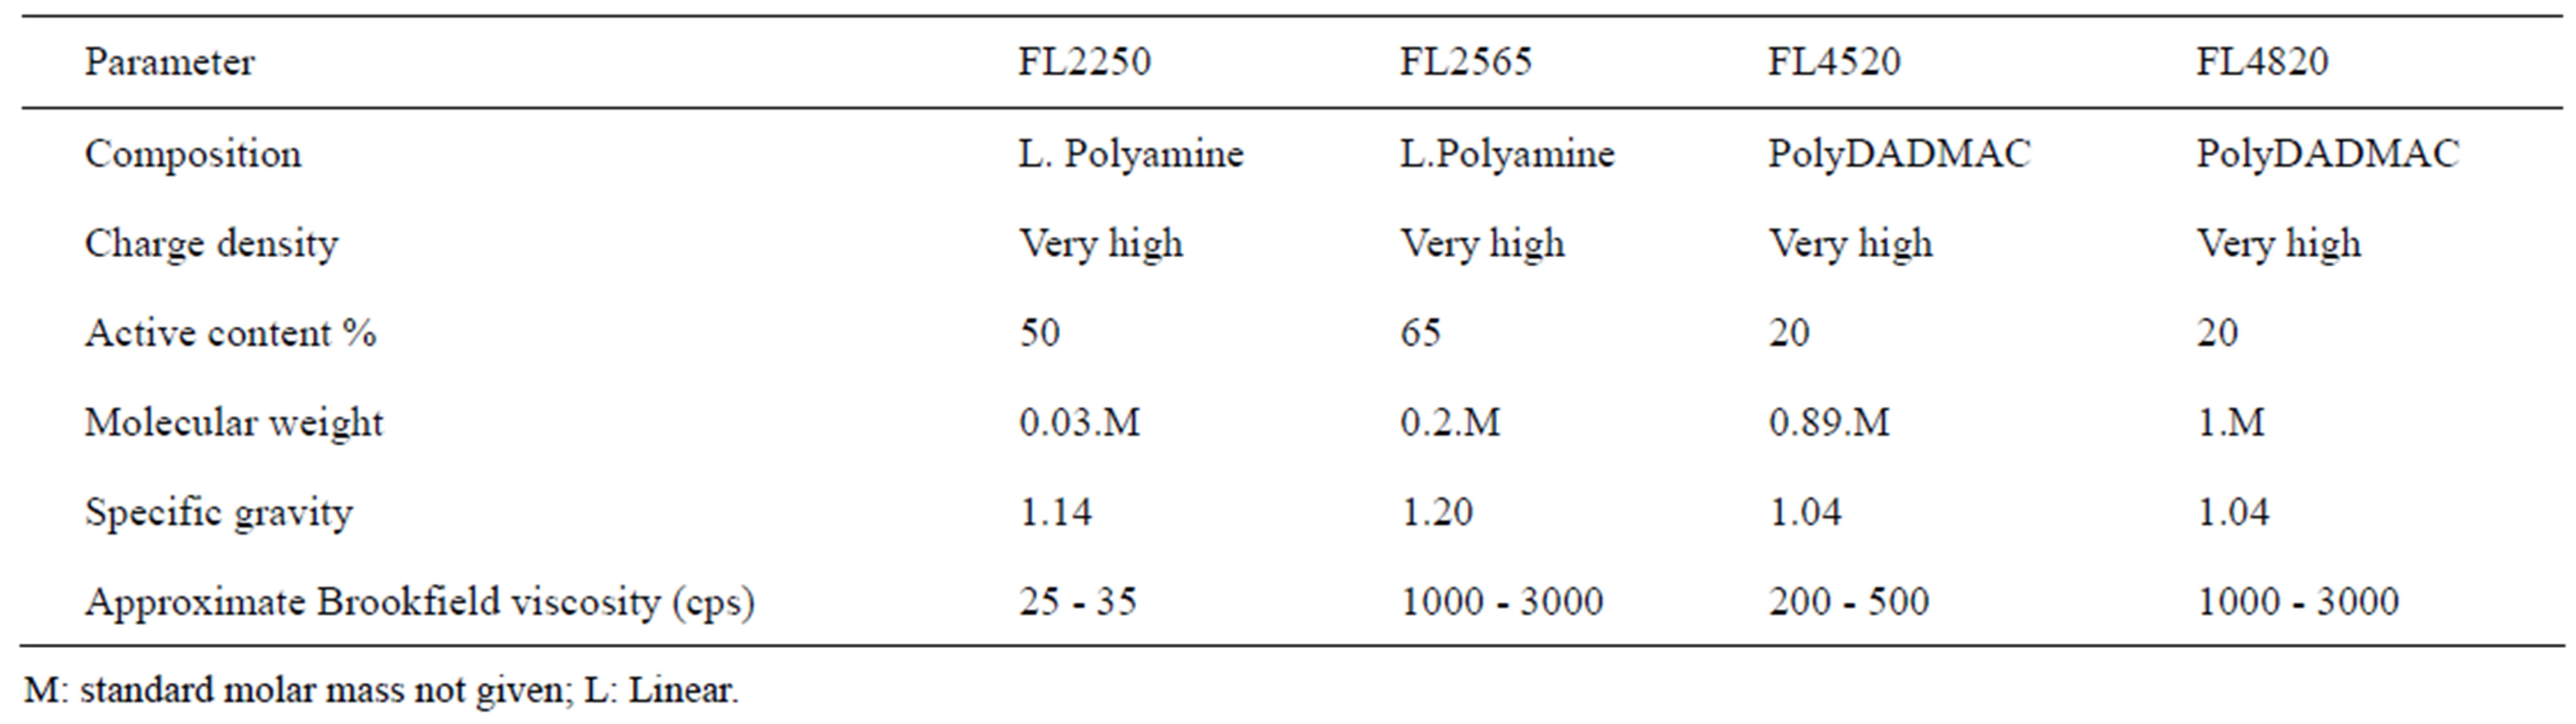
Table 1. Main characteristics of the cationic coagulants used.
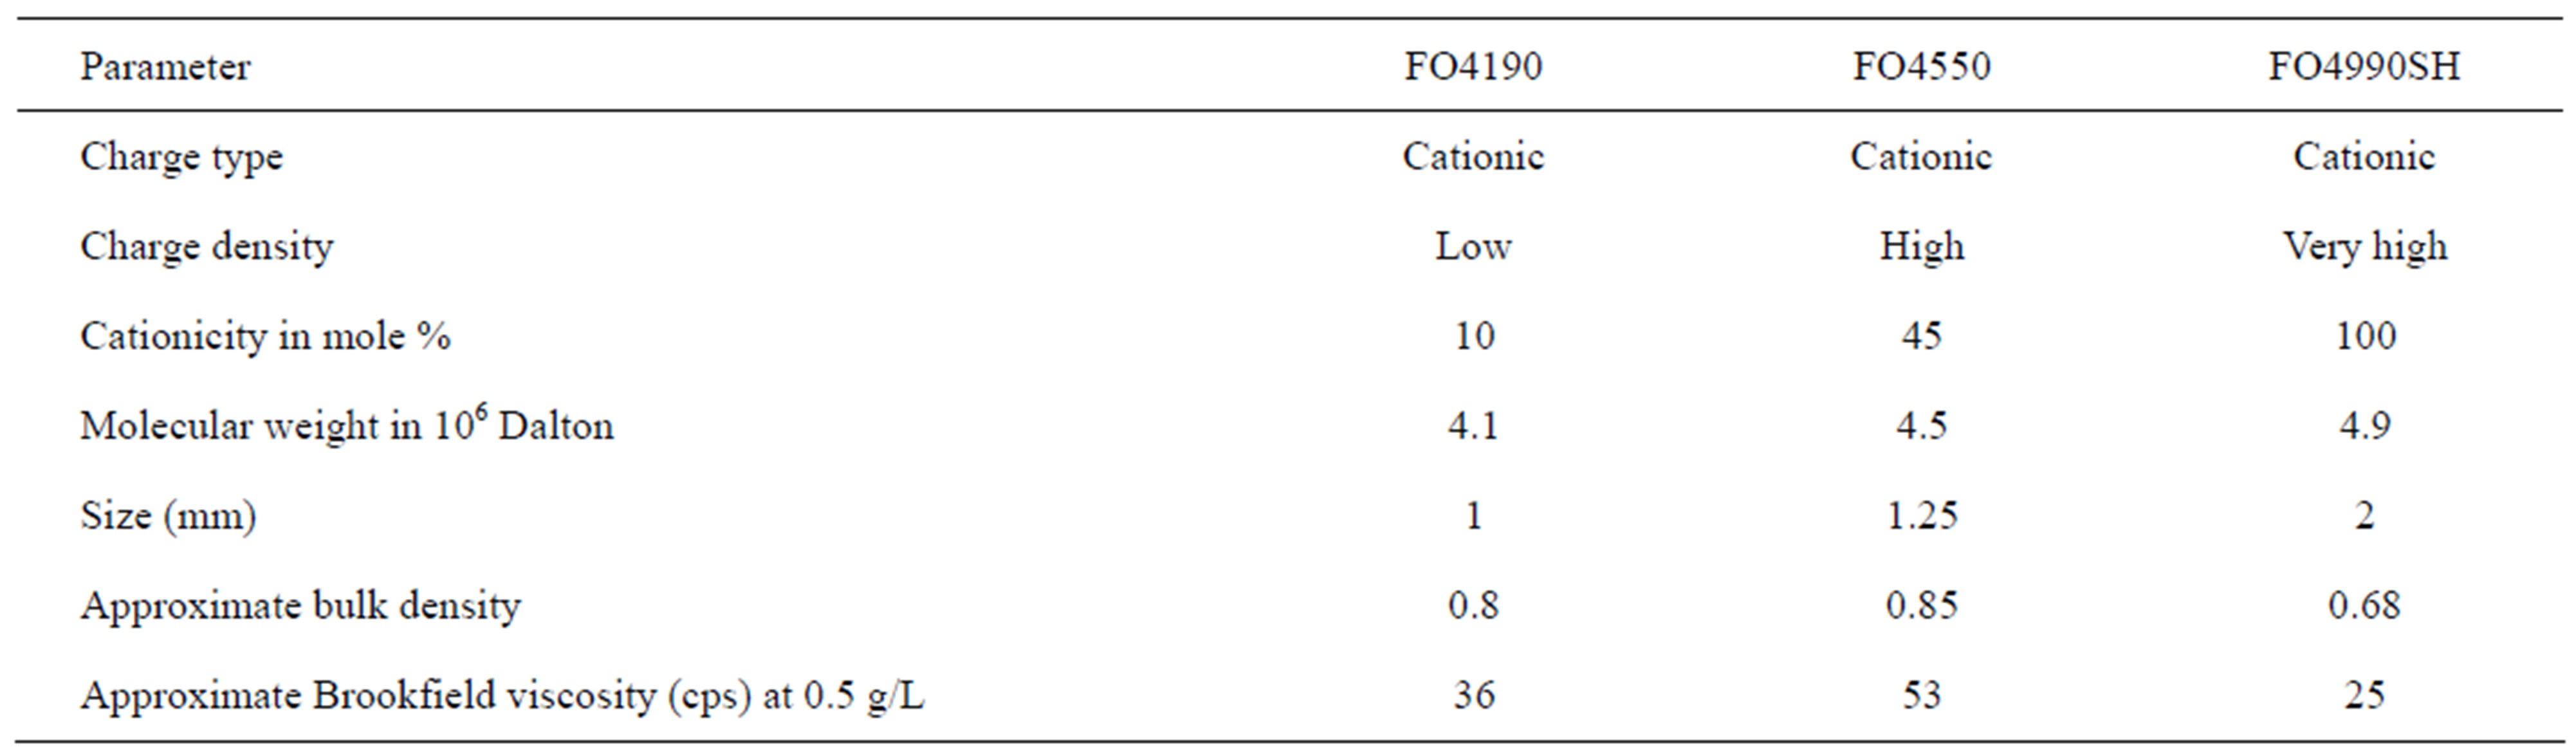
Table 2. Main characteristics of the flocculants used.
electrophoretic mobility and turbidity of the suspension of NPs in the presence of increasing concentrations of coagulant. On an industrial treatment site, a turbidimeter can be used instead of a zeta potential meter. These are easy to use and very inexpensive.
The test with each coagulant was done for each concentration on 100 mL of NP suspension at 0.1 g/L, mixed with a magnetic stirrer at 500 rpm for 15 min in a 125 mL beaker with an internal diameter of 5 cm. Turbidity and electrophoretic mobility measurements were done on samples collected during mechanical mixing.
The optimum flocculant concentration (OFC) is estimated by jar testing. The experimental matrix investigated is made up of 4 coagulants and 3 flocculants selected. The three flocculants were tested for or each previously determined OCC. For each combination, conditioning was done at a velocity gradient of 583 s–1 for 10 min for coagulation and then at 133 s–1 for 5 min for flocculation. The same stirring rate was used in the 6 beakers of the jar test. The OFC was determined after stirring had been stopped by measuring the turbidity in the supernatant in the suspensions after 15 min of settling. It is the quantity of flocculant that results in the lowest turbidity.
2.4. Method Used to Characterize Floc Size and Structure
After the optimum coagulant concentration for neutralization had been determined and the best flocculants had been selected by jar test, flocculation was optimized by measuring the particle size with a Malvern MasterSizer S laser granulometer. This apparatus was equipped for the study with a 1 L vessel with a tap in its bottom that enabled the drawing off of the suspension to the analysis cell. Circulation through this cell is done in a fully hydraulic open circuit with a flowrate controlled by the head and by the centrifugal pump at the outlet.
This reactor tank is also equipped with four orthogonal riffles and a single-blade sheet-type impeller (tangential-flow system). The impeller makes it possible to reach high velocity gradients for fairly low speeds while decreasing the turbulence heterogeneity in the stirred volume. This flocculation tank configuration reproduces quite well the hydrodynamic characteristics of an Industrial flocculation box. The mean gradient values during the conditioning are calculated on the basis of its power curve [14].
The granulometer’s short optical bench with an analysis cell having a 2.4 mm optical path was used for sizes between 0.1 and 878 µm. For sizes between 4.2 and 3473 µm, the long bench was used with a specially manufactured cell having a 10 mm optical path. Optical data was exploited using the Fraunhofer optical model for diameters greater than 3.2 µm (5 l0) and the Lorentz-Mie theory [15] for smaller particles. The refractive index for silica is 1.47 and the extinction index is 0.
The laser diffraction measurements also provide information on the average porosity, the average density and the average fractal dimension of the flocs according to the following equations [14]:
 (12)
(12)
 (13)
(13)
where εF is the average floc porosity, Cs is the solid concentration kg/m3, ρF is the average floc density kg/m3, ρs is the average solid density in kg/m3, ρL is the fluid density in kg/m3 and Cv is the volume concentration of the flocs measured by the granulometer in %.
For fractal aggregates, it can be shown that [16-18] the total scattered intensity will exhibit a power law dependency on the amplitude of the scattering vector q; i.e.
For
 (14)
(14)
 (15)
(15)
where q is the amplitude of the scattering vector, Rg is the radius gyration of the aggregate, r0 is the primary particle radius and DF the mass fractal dimension. q is a function of the wavelength of the incident beam (l0 = 0.632 µm), the refractive index of dispersion medium and the scattering angle.
It is therefore possible to determine the mean fractal dimension of the aggregates from the curve of log(I(q)) versus log(q). Over the interval , the curve then displays a linear segment with a slope equal to –DF.
3. RESULTS AND DISCUSSION
3.1. Morphological Characterization of Silica NPs
Various enlargements were made of the microscope images (Figure 1). The analytical approach entailed characterizing the material at different scales in order to see granulometric details. Minor magnification shows that the material is homogeneously distributed. Major magnification (×50,000 to ×88,000) reveals the presence of several particles in groups of, at most, 2 or 3 particles. There are relatively few of these in the images studied. The strings of beads observed in a magnification ×20,000 very probably formed when the grids were dried. On all of the images studied, particles appear to be almost circular and, for the most part, between 50 and 80 nm in diameter. The largest size observed is about 190
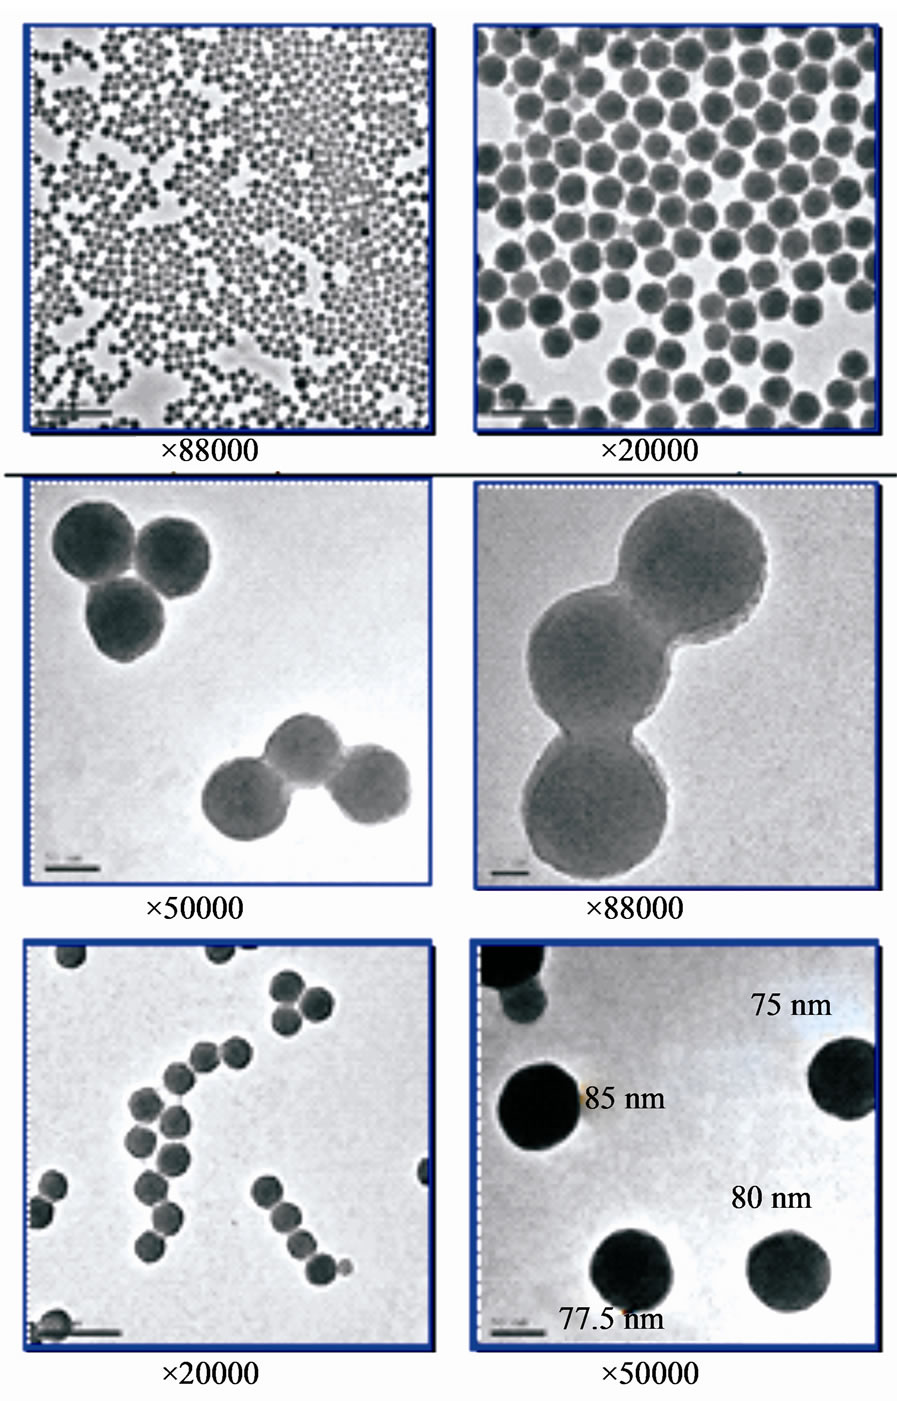
Figure 1. TEM image of S30R50.
nm. This corresponds to the Feret’s diameter of 3 connected particles.
The density of this material measured by helium pycnometrie is 2.222 ± 0.001 g/cm3 and its BET specific surface is 45 ± 2 m2/g.
3.2. Physico-Chemical Stability of Silica NPs
To monitor the mobility of NPs in the environment, it is necessary to determine NPs stability boundary conditions as a function of pH and ionic strength. We therefore investigated, as a reference study, the behaviour of these NPs in terms of size and zeta potential as a function of pH with no salt added. The NPs were dispersed in MilliQ water at a concentration of 0.1 g/L (SiO2 at 0.01 wt%). The appearance of the prepared suspension is between opalescent and transparent. Its turbidity is 18 ± 1 NTU and its natural pH is 6.1 ± 0.1. The pH was then modified with HCl or NaOH. Measurements were done at 20˚C after one day of stirring.
3.2.1. Size Distribution
The evolution of the hydrodynamic diameter (dH) determined with NANOZS as a function of the suspension pH is given in Figure 2. The particles: 1) Aggregate for pH below 3; 2) Are stable at ±1 nm for pH between 3 and 9; 3) Decrease in size from pH 9 to 11.
The increase in the mean diameter between pH 3 and 1.8 indicates an increasing agglomeration of particles fostered by the drop in pH. This monotonic increase also implies that the zero point of charge pHZPC is certainly below pH 1.8. The flocculation yield in this acid pH interval hardly exceeds 30%, a maximum value obtained for pH 1.8 (Figure 2). At pH 1.8, the size is between 44 and 340 nm.
The decrease in size beyond pH 9 is due, to some extent, to the compression of the diffuse double layer and, to a large extent, to a partial solubility of the particles. These NPs that have a very small diameter and a high surface tension are therefore particularly sensitive to dissolution phenomena. This point corresponds perfectly to the beginning of silica solubilization [19].
The size of these NPs is between 100 and 44 nm for pH between 3 and 9. They have a stability range much broader than those of magnetite, CeO2 or TiO2 NPs [20]. This great stability implies that the surface charge of this product is high within a rather broad pH range.
3.2.2. Zeta Potential
Figure 3 shows the evolution of nanosilica zeta potential in water as a function of suspension pH. For ¦(kr) Ohshima approximation is used (Eq.4). The potential becomes increasingly negative with increasing pH.
In the acidic pH range, the zeta potential is linear with pH. Consequently, there is almost no complexation of charged sites with the Cl– counterions. An increase in the HCl concentration only reduces the negative charge. The contribution of the complexation with Na+ is significant only beyond pH 9.
Since the silica surface charge is negative, the problem can be simplified by disregarding Eqs.8 and 10 concerning the formation of positive sites. For pH values greater than pHZPC, therefore, the contributions of [SiO–] and [SiO–···Na+] are largely predominant. The surface charge s0 is the sum of these two terms.
The result obtained is therefore largely attributed to:
Si¾OH + OH– SiO– + H2O (9)
Si¾O– + Na+  SiO–···Na+(10)
Many authors have reported that the surface charge of silica is negative for a very wide range of pH values [21]. It is also accepted that the structure of silica is open enough so that the coordination number of each surface atom can still increase [22,23].
For pH values between 1 and 6, the zeta potential can be represented by a straight linear regression line that intersects the x-axis at pH 1.47 ±0.03 (z = –14.68pH + 21.55, R2 = 0.997). This point is, by definition, the pH of
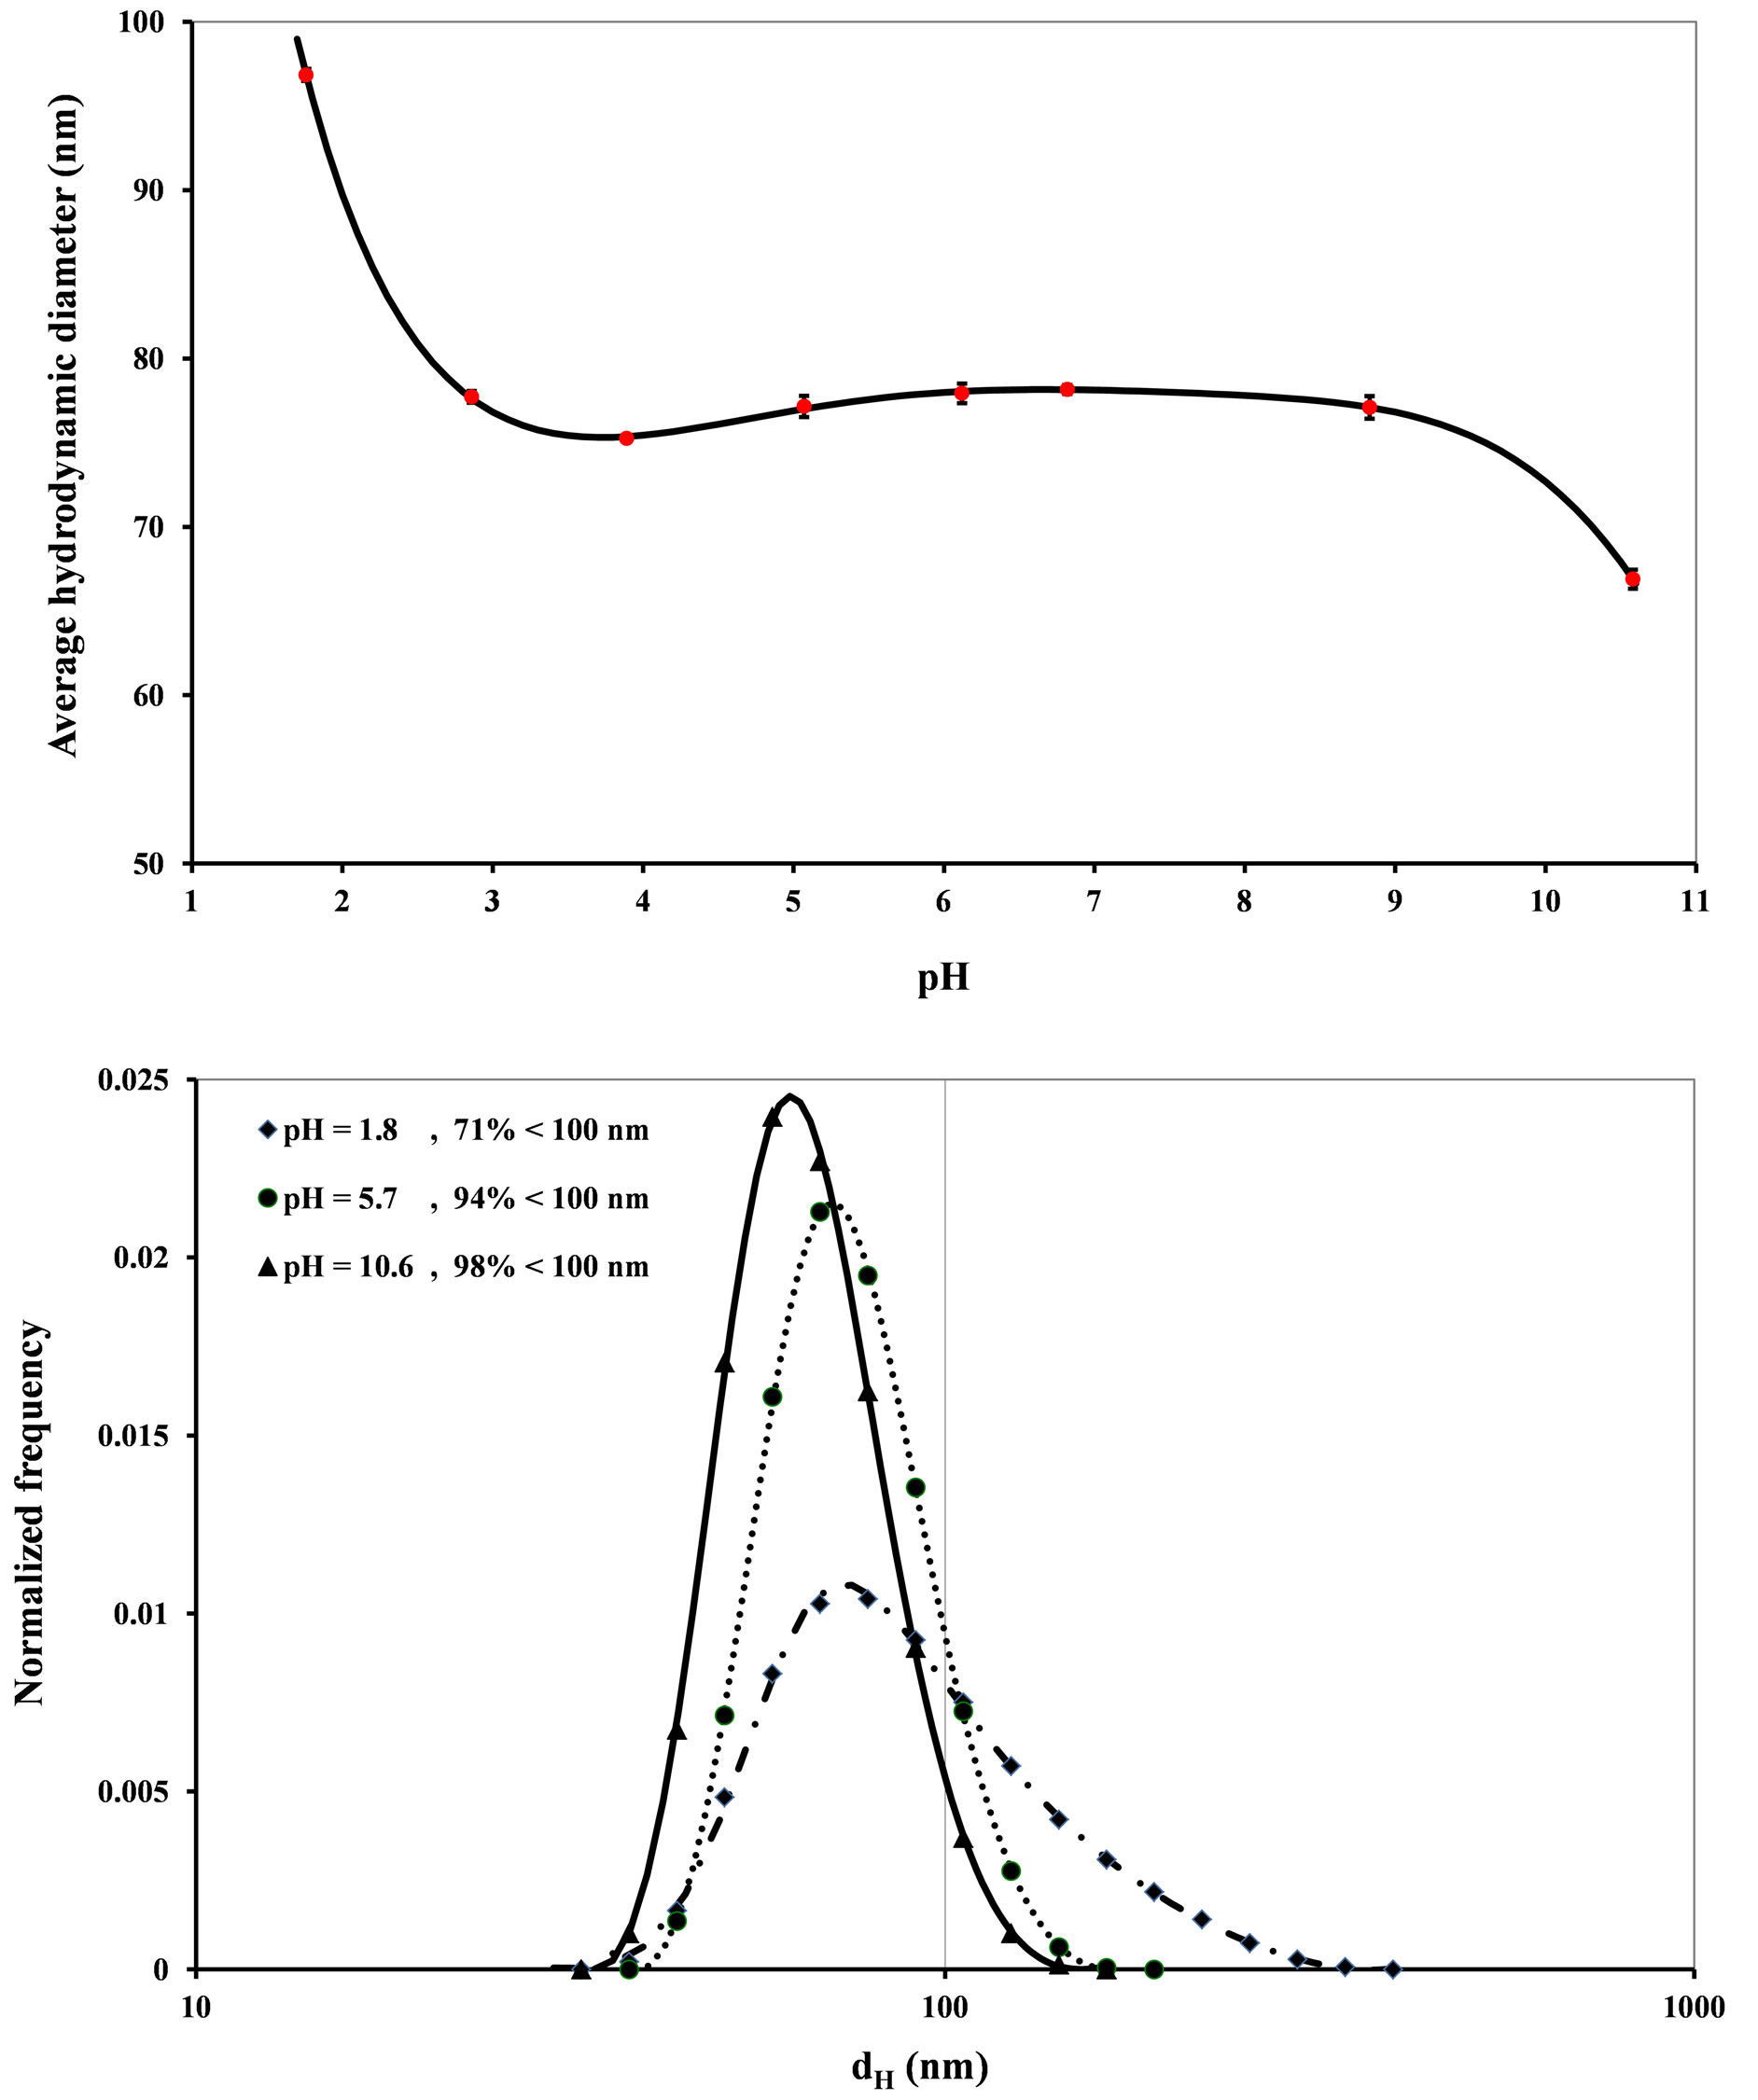
Figure 2. Evolution of the average diameter as a function of pH and the size distribution of S30R50 for the most significant pH values.
zero point of charge (pHZPC) of this silica sample. This value is in agreement with literature data. The pHZPC of quartz is 1.4 [24]. This point is defined as the pH value for which the surface of particles is globally neutral. In this case, the repulsive forces between the particles are too weak to oppose aggregation. The agglomeration threshold is set at pH 3 according to the particle size analyses (Figure 2).
When pH increases, the state of the suspension goes progressively from maximum flocculation (z = 0 mV) to good stability, which it reaches in a strongly basic environment. This state is well illustrated by the results of the
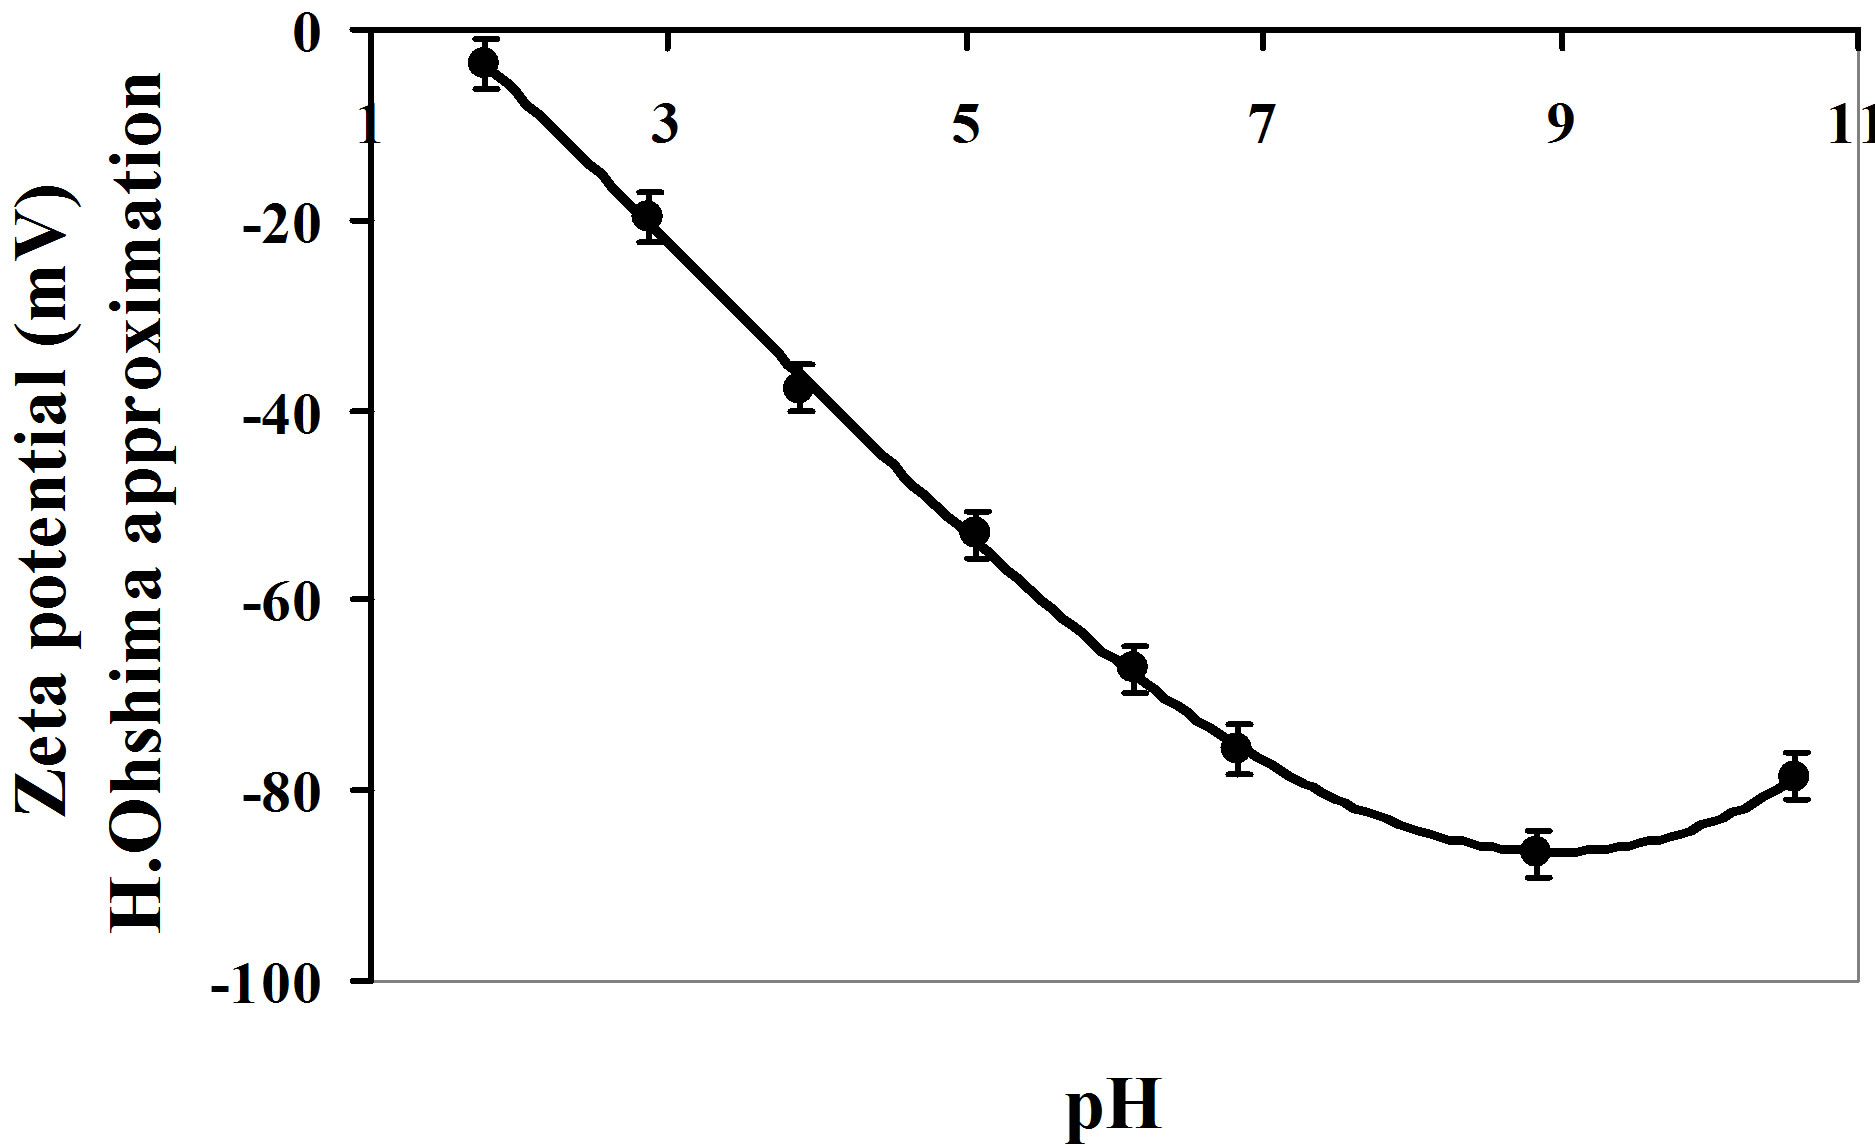
Figure 3. Estimation of zeta potential based on H. Ohshima’s approximation.
particle size analysis as a function of pH Figure 3.
The solubility of amorphous silica becomes significant at pH values above 9 [19]. This dissolution process forms silicate  ions that behave like an electrolyte, increasing the charge. Therefore, at high pH, the increase in the surface charge is due to both the addition of sodium hydroxide and silica dissolution.
3.3. Nanoseparation
3.3.1. Optimization of Coagulant Concentration
Before we can set up the solid/liquid separation process for a given physico-chemistry, we must determine the optimum concentrations of the reagents to be used. The first phase consists therefore in determining the optimum concentrations of coagulant and then of flocculant.
When coagulants are added, pH variations remain insignificant (less than 0.1 pH unit). The variations in electrophoretic mobility as a function of added amounts of cationic polymers correspond to the classic neutralization curves. Increasing the polymer concentration (Figure 4) results in a decrease in the absolute value of the electrophoretic mobility, going through the isoelectric point, and then an increase of up to a horizontal asymptote located at an electrophoretic mobility lower than that of the uncoagulated product. In turbidity (Figure 4), the function increases up to a given value, decreases forming secondary maxima, and then stabilizes, plateauing slightly above the initial turbidity. The isoelectric point and the maximum turbidity for each coagulant correspond to the optimum coagulation concentration.
The shape of these curves reflects the various coagulation states. The reactions can be broken down into three states:
Ÿ Simultaneous neutralization and bridging between the beginning and the isoelectric point (IEP) (maximum turbidity).
Ÿ A combination of 2 conditioning mechanisms between the IEP and the first plateau (turbidity between the first and last maxima). There is competition between neutralization/bridging and steric stabilization beyond the IEP. Steric stabilization increases with the coagulant concentration to the detriment of neutralization/bridging.
Ÿ Total steric neutralization corresponding to the individual neutralization of each particle. This mechanism causes a redispersion of particles in solution as a result of a reversal of charge within the solution. The near-environment of a particle surface can then be entirely occupied by hydrophilic polymer chains that generate a repulsive hydration force. This is observed when the coagulant concentration is high enough so that all of the particles are rapidly covered.
The non-return to the initial turbidity after steric stabilization is due to the coating of the particles by the polymer and to the presence of free coagulant in solution. In this way, the value of the refractive index for the suspension is modified and, consequently, also that of the turbidity [25,26]. These configurations are represented by figure 5. The first state corresponds to the path from “a” to “c1” and the last to a path from “a” to “c2”.
The transition from destabilization (IEP) to steric stabilization follows a competition between the increase in the number of individual coated nanoparticles and the decrease in the formation of aggregates.
The optimum concentration is the quantity of coagulant that does not adsorb uniformly on the entire surface of each particle and that produces electrically neutral aggregates (Figure 5). Each active cluster of coagulant adsorbs on at least two particles and the neutrality of the electrical charge of each particle is ensured by at least 2 active clusters. The particles having surfaces with opposite charges can therefore touch, leading to the formation of an aggregate by neutralization of surfaces with opposite charges. The number of NPs per aggregate, its diameter and its texture depend on the nature of the coagulant and the applied hydrodynamic conditions.
Figure 6 shows the influence of the ratio of charge density to molar mass. Below the IEP and for high charge densities (FL2250 and FL2565), the adsorption curve is concave (rapid recovery) and the adsorption kinetics are rapid. Conversely, for low charge densities and high molar masses (FL4520 and FL4820), the adsorption curve is convex (slow recovery). These two behaviours correspond to two different adsorbed polymer conformations. The presence of long hooks and loops for 20% cationicity, and a flat conformation for cationicities between 50% and 65%. The molar mass associated with cationicity enables us to explain the behaviour of the 2 coagulants and these two last cationicities. For the same concentrations, the FL2250 coagulation performance is lower than that of FL2565. This is due to the difference in the length of the chains of these two coagulants. The free, non-adsorbed parts of the polymers are not the same
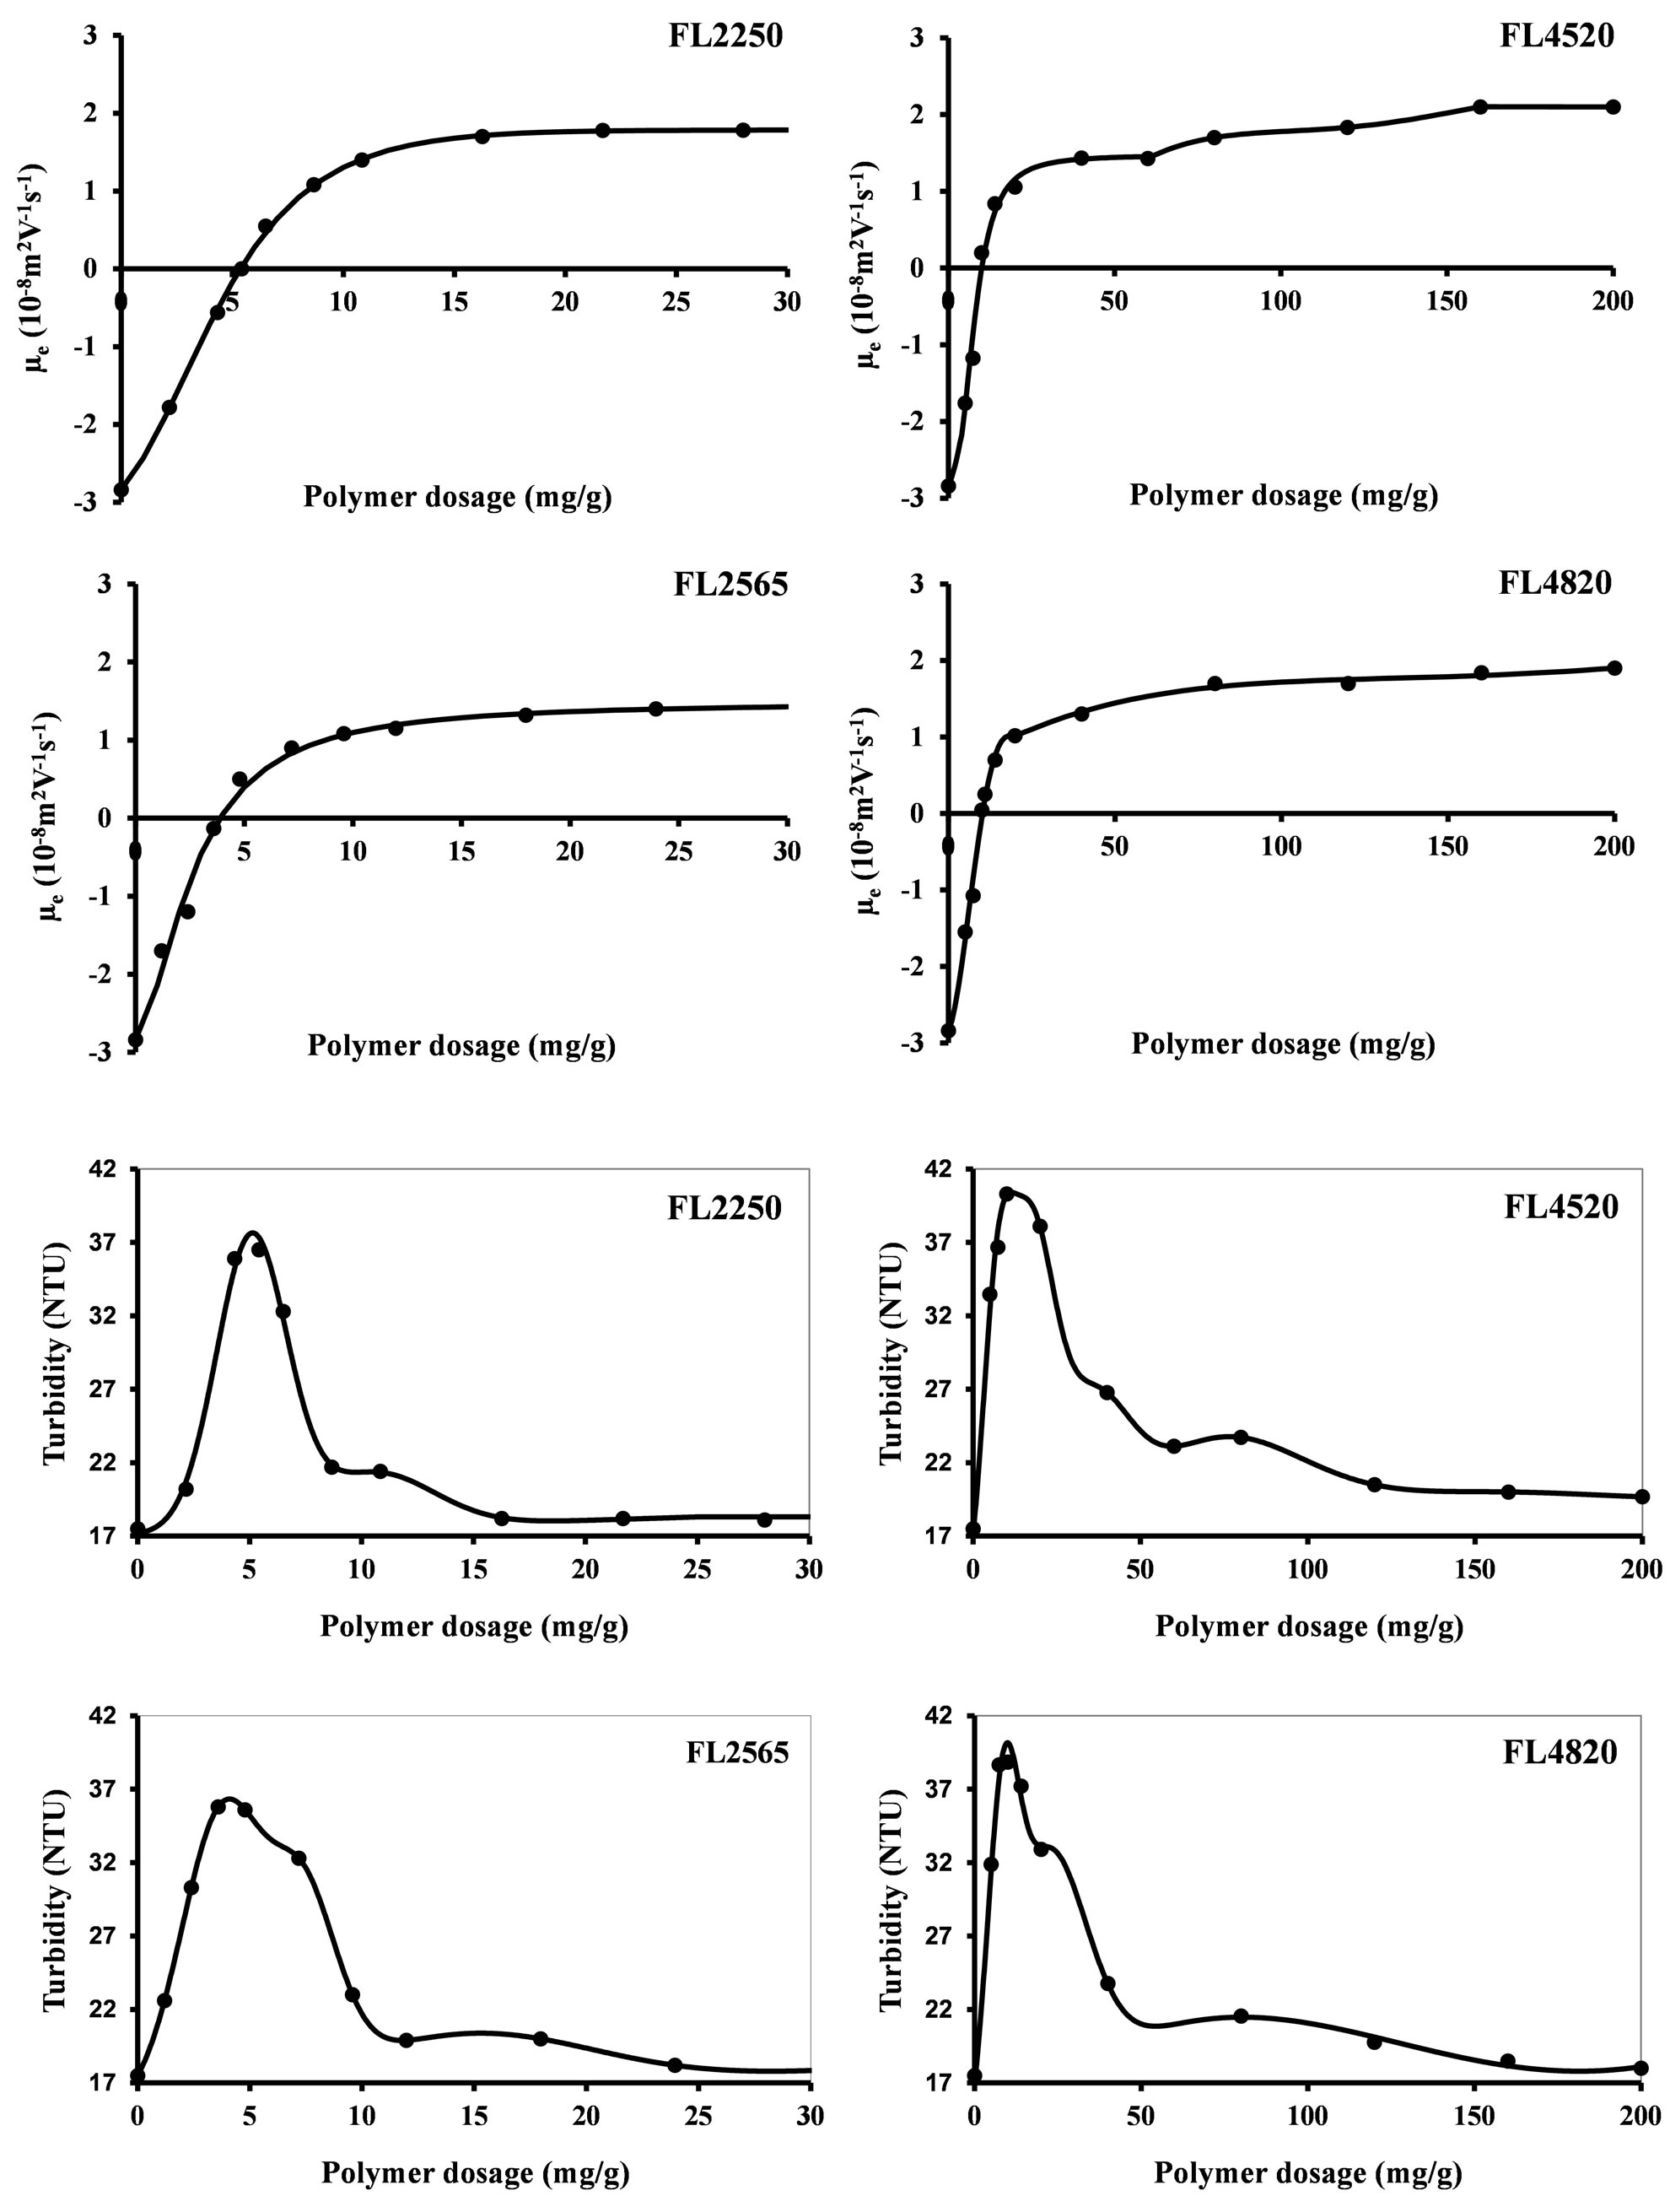
Figure 4. Influence of coagulant concentration on the electrophoretic mobility and on the turbidity of S30R50 nanoparticles.
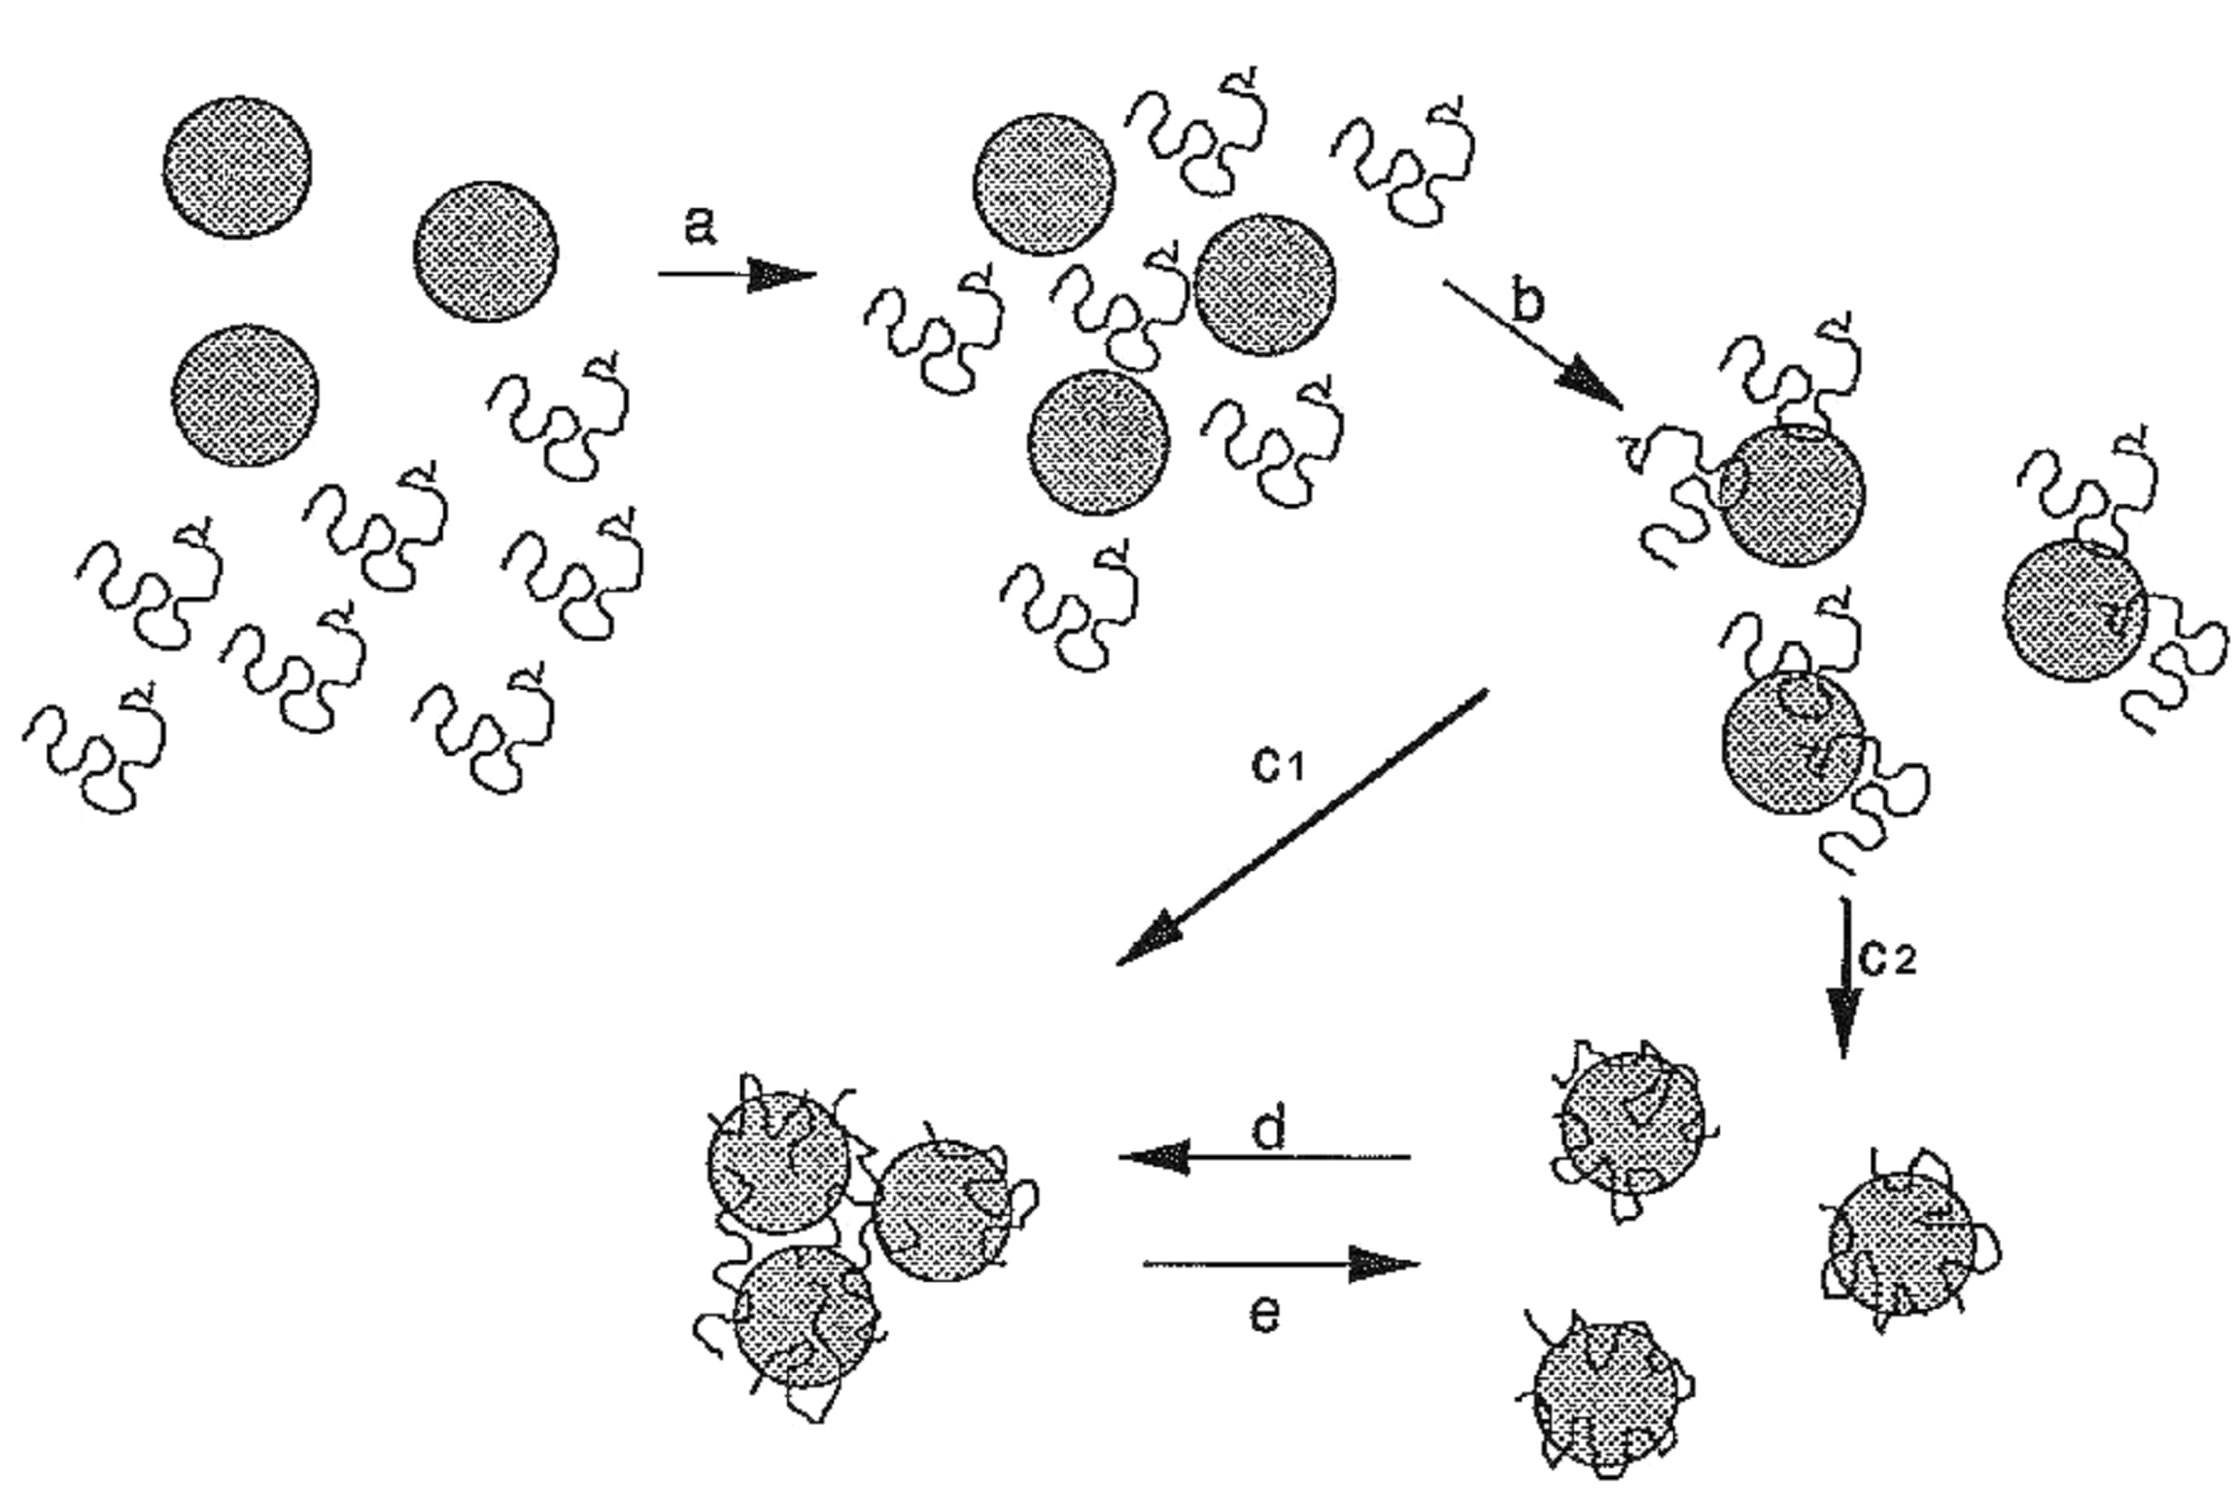
Figure 5. Mode of action and conformation of organic coagulants with the particle surface.
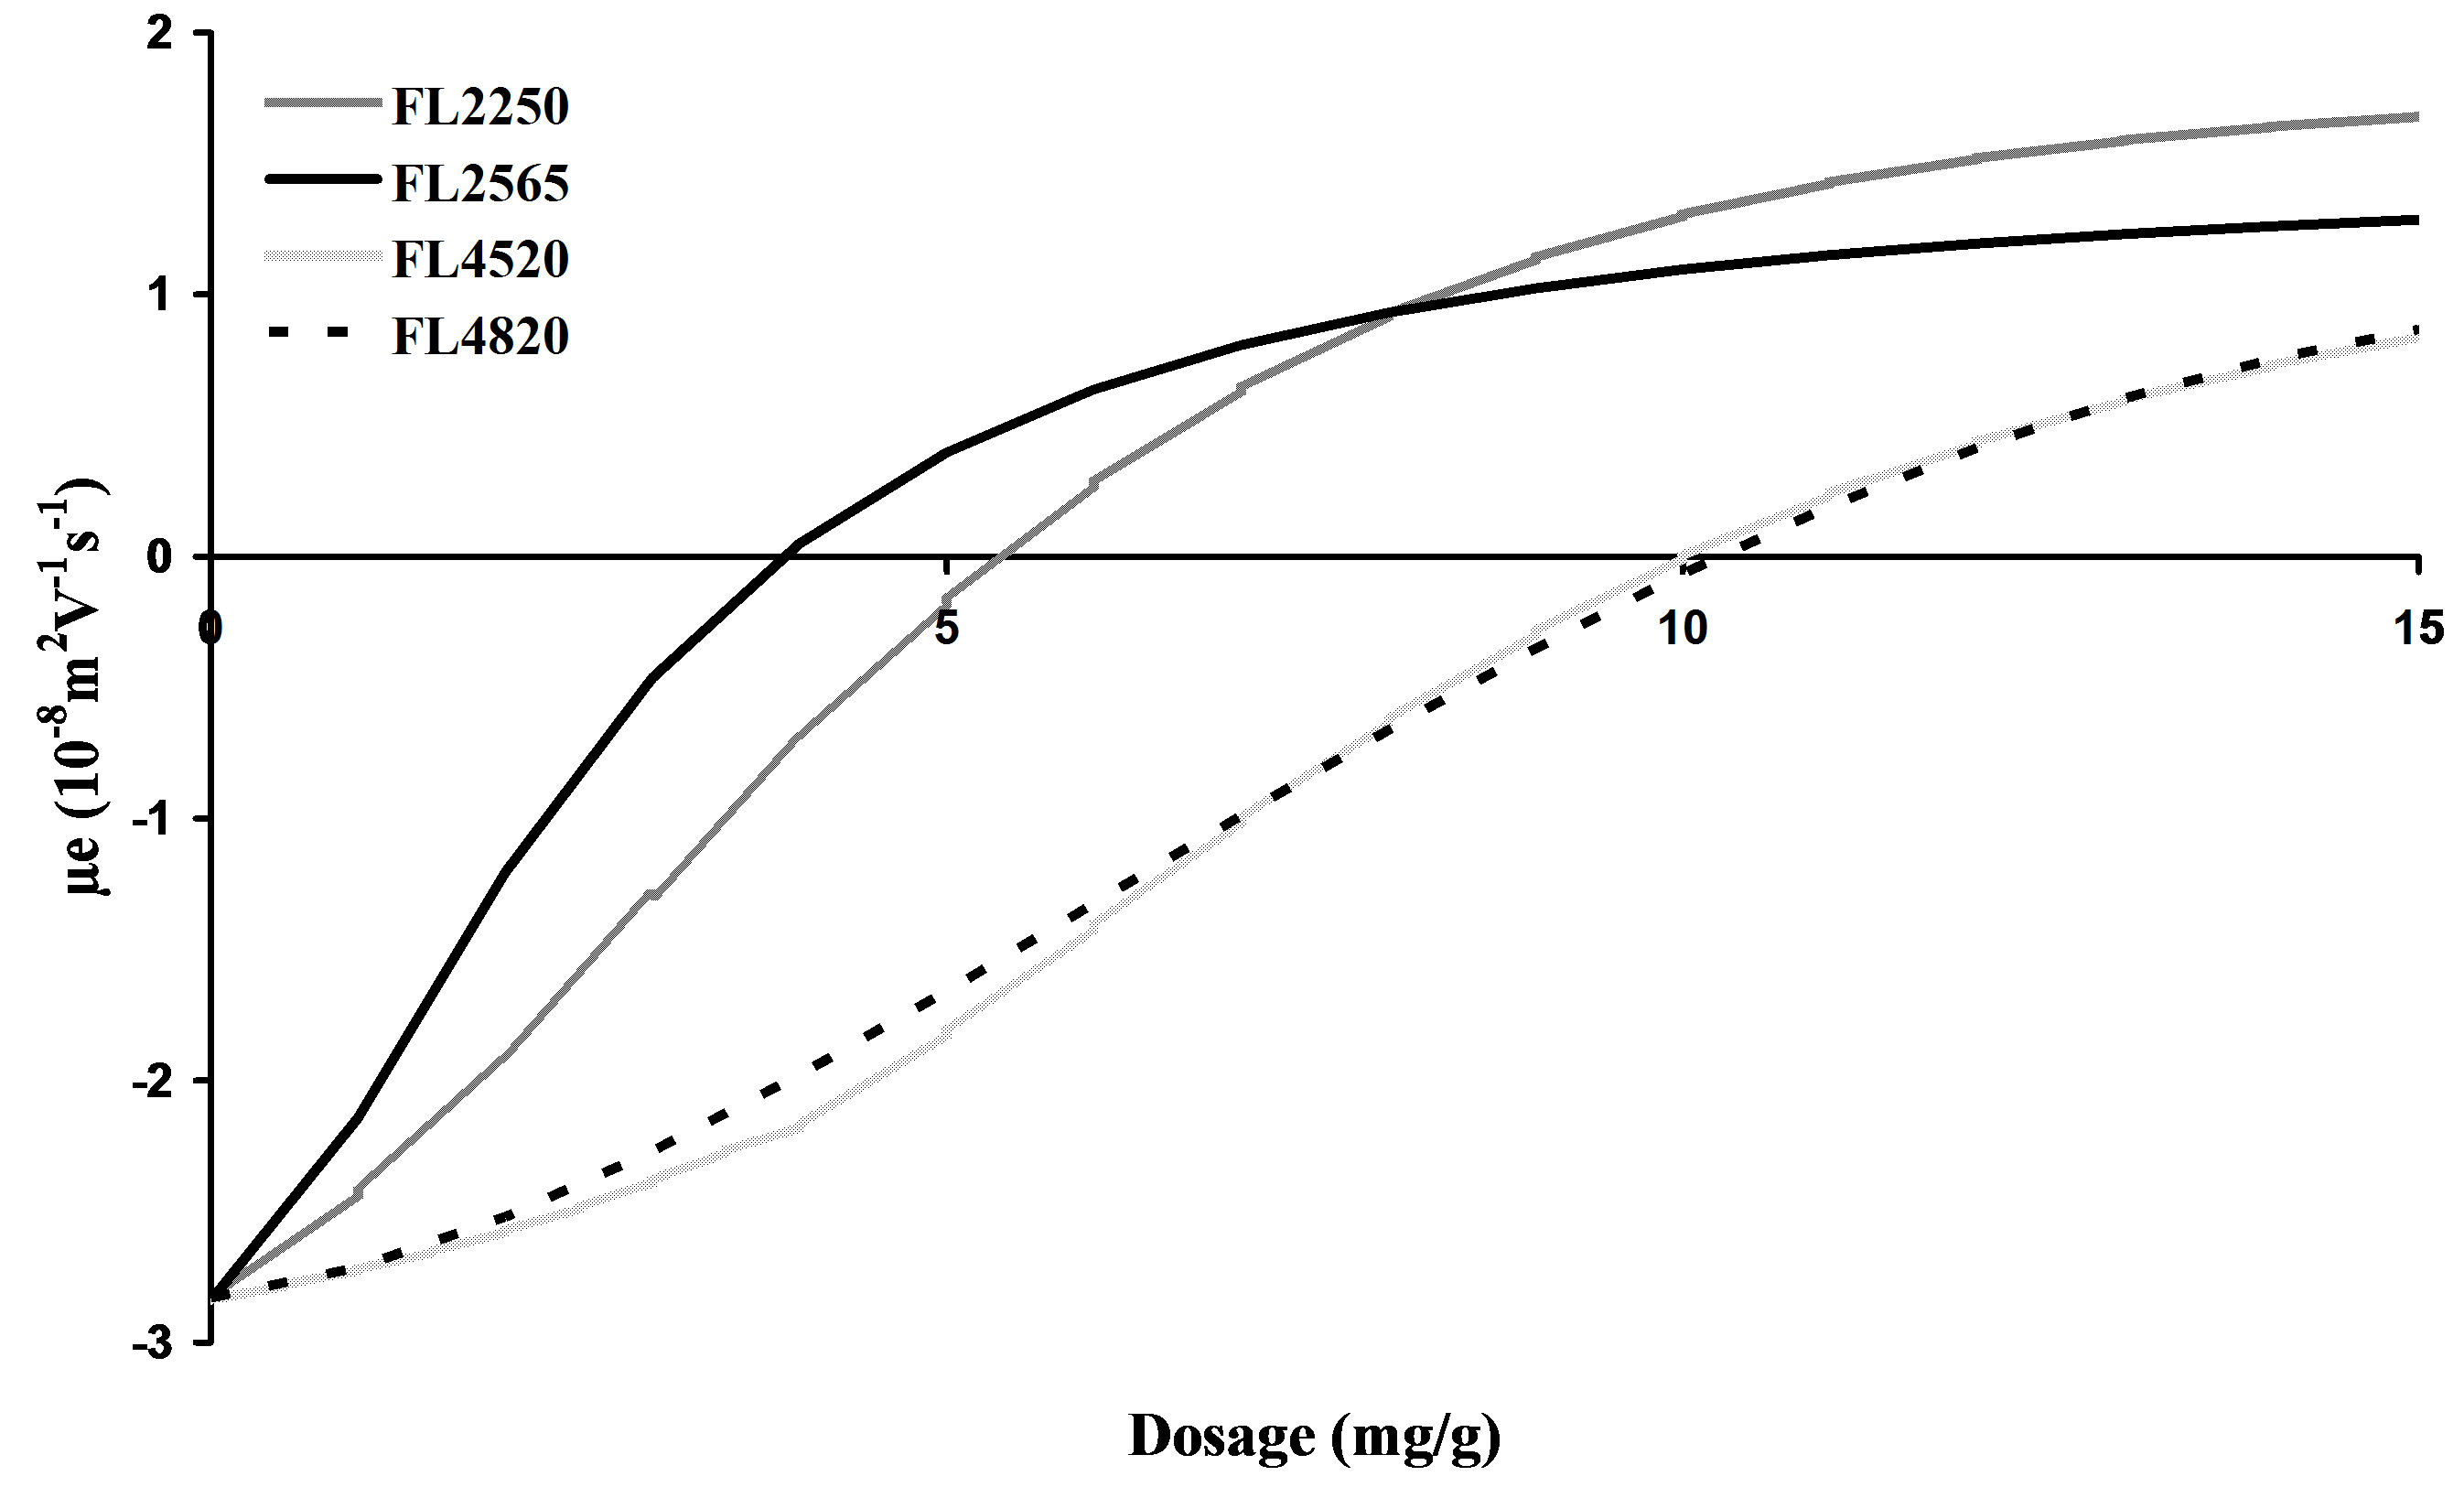
Figure 6. Shape of the electrophoretic mobility curve concavities below the OCC.
size and therefore their agglomeration efficiency is different (Table 3).
The OCC of the polymers can therefore be optimized with reference to the molar mass and the cationic charge. The OCC obtained are given in Table 4. The lowest value is given by coagulant FL2565, which has the highest charge density. The OCC obtained decrease with the percentage of active matter and therefore the effective charge used for coagulation (Figure 7).
3.3.2. Coagulation-Flocculation
3.3.2.1. Coagulant Performance It is difficult to predict, based on the physico-chemical characteristics of a suspension, which reagent will give the best results. Indeed, the efficiency of a flocculant depends on numerous, and in some cases contradictory, factors related mainly to the nature of the suspension to
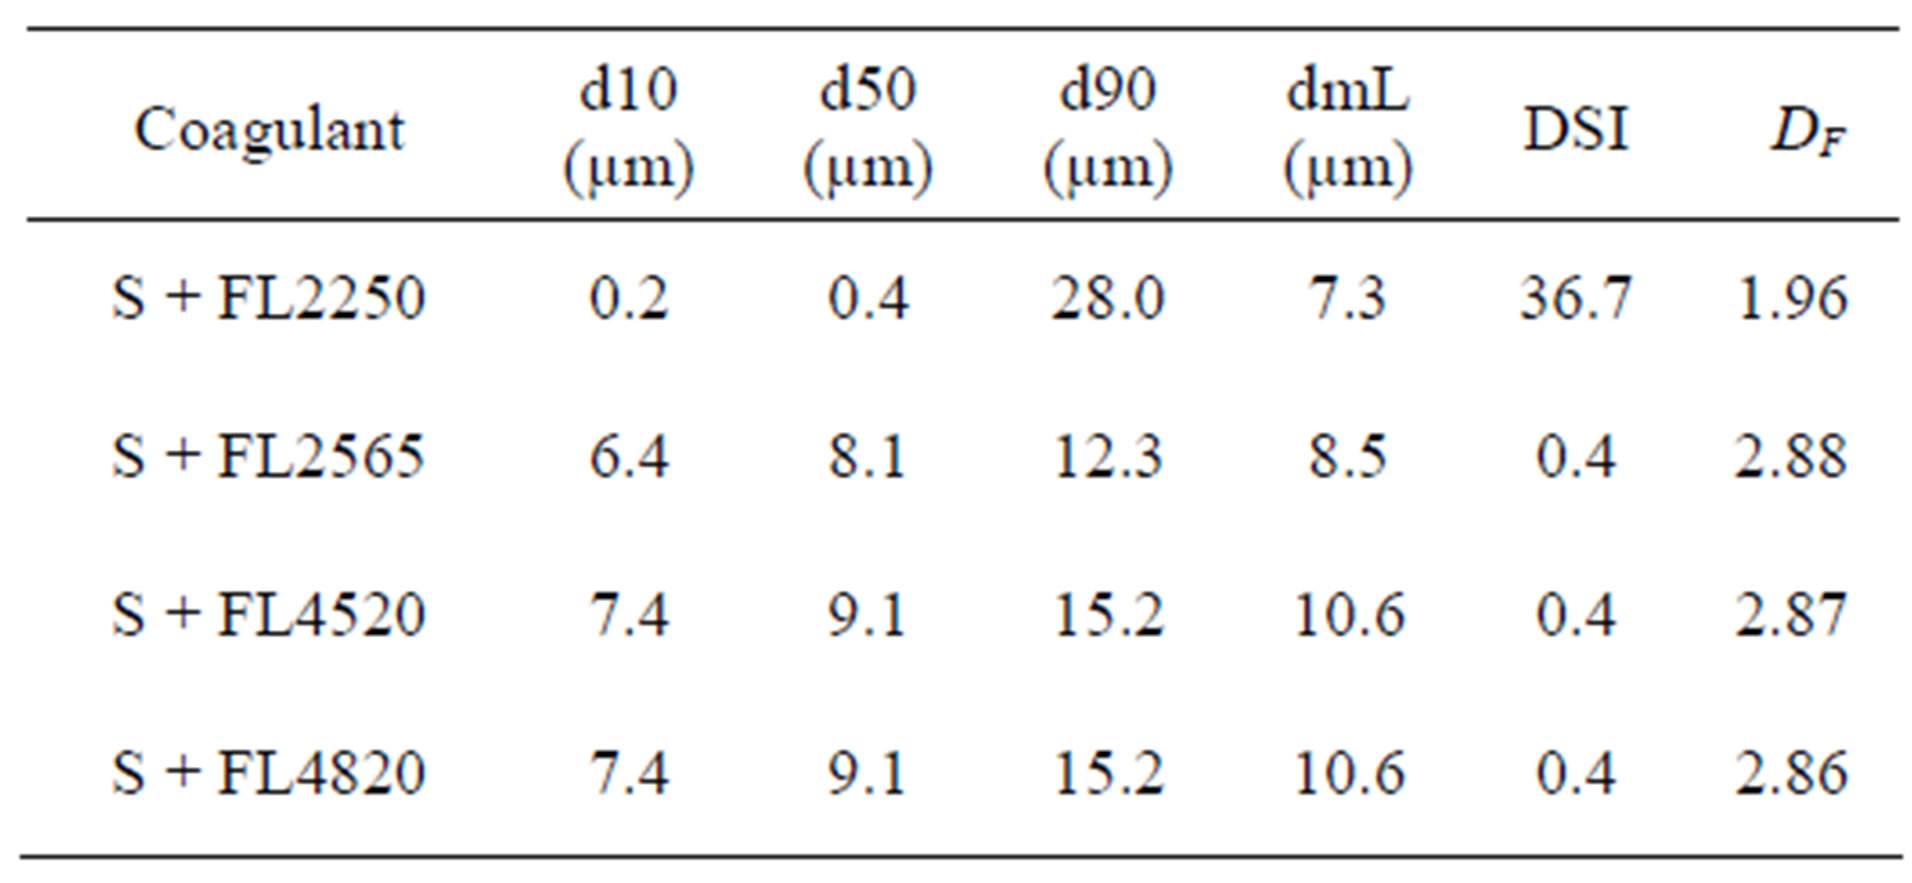
Table 3. Main size parameters after coagulation.
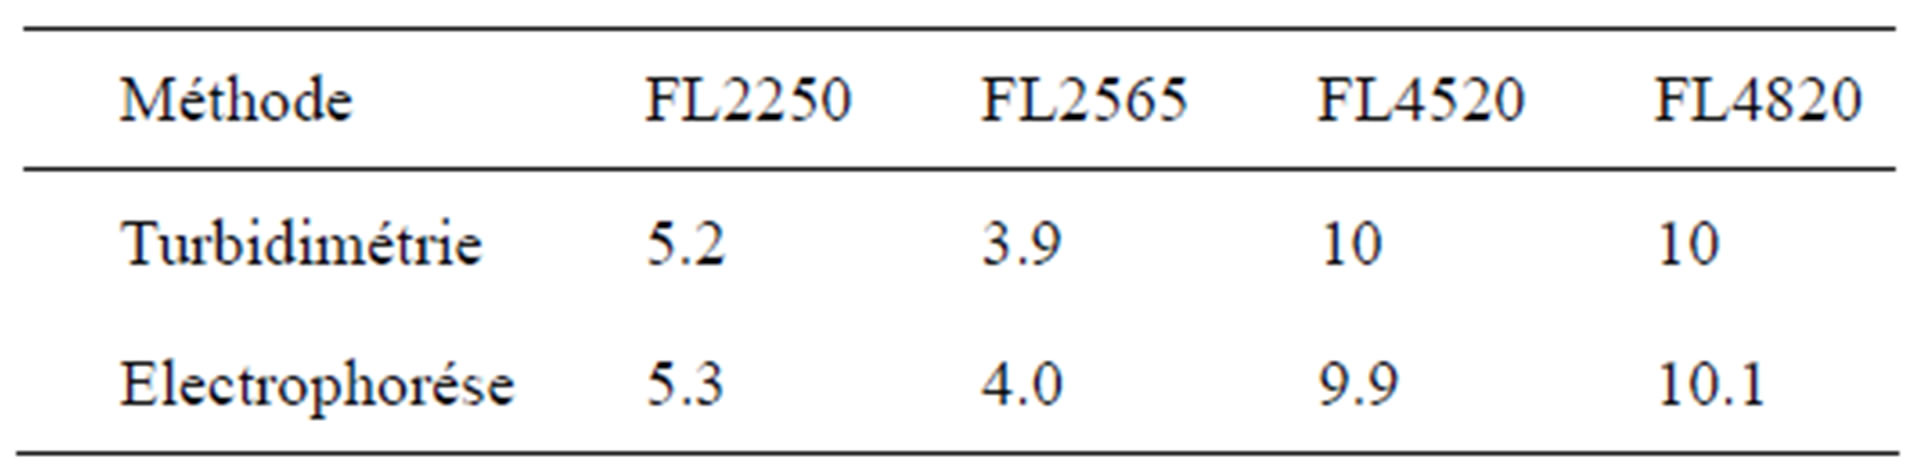
Table 4. Optimum coagulant concentrations (OCC) at ±0.1 (mg/g).
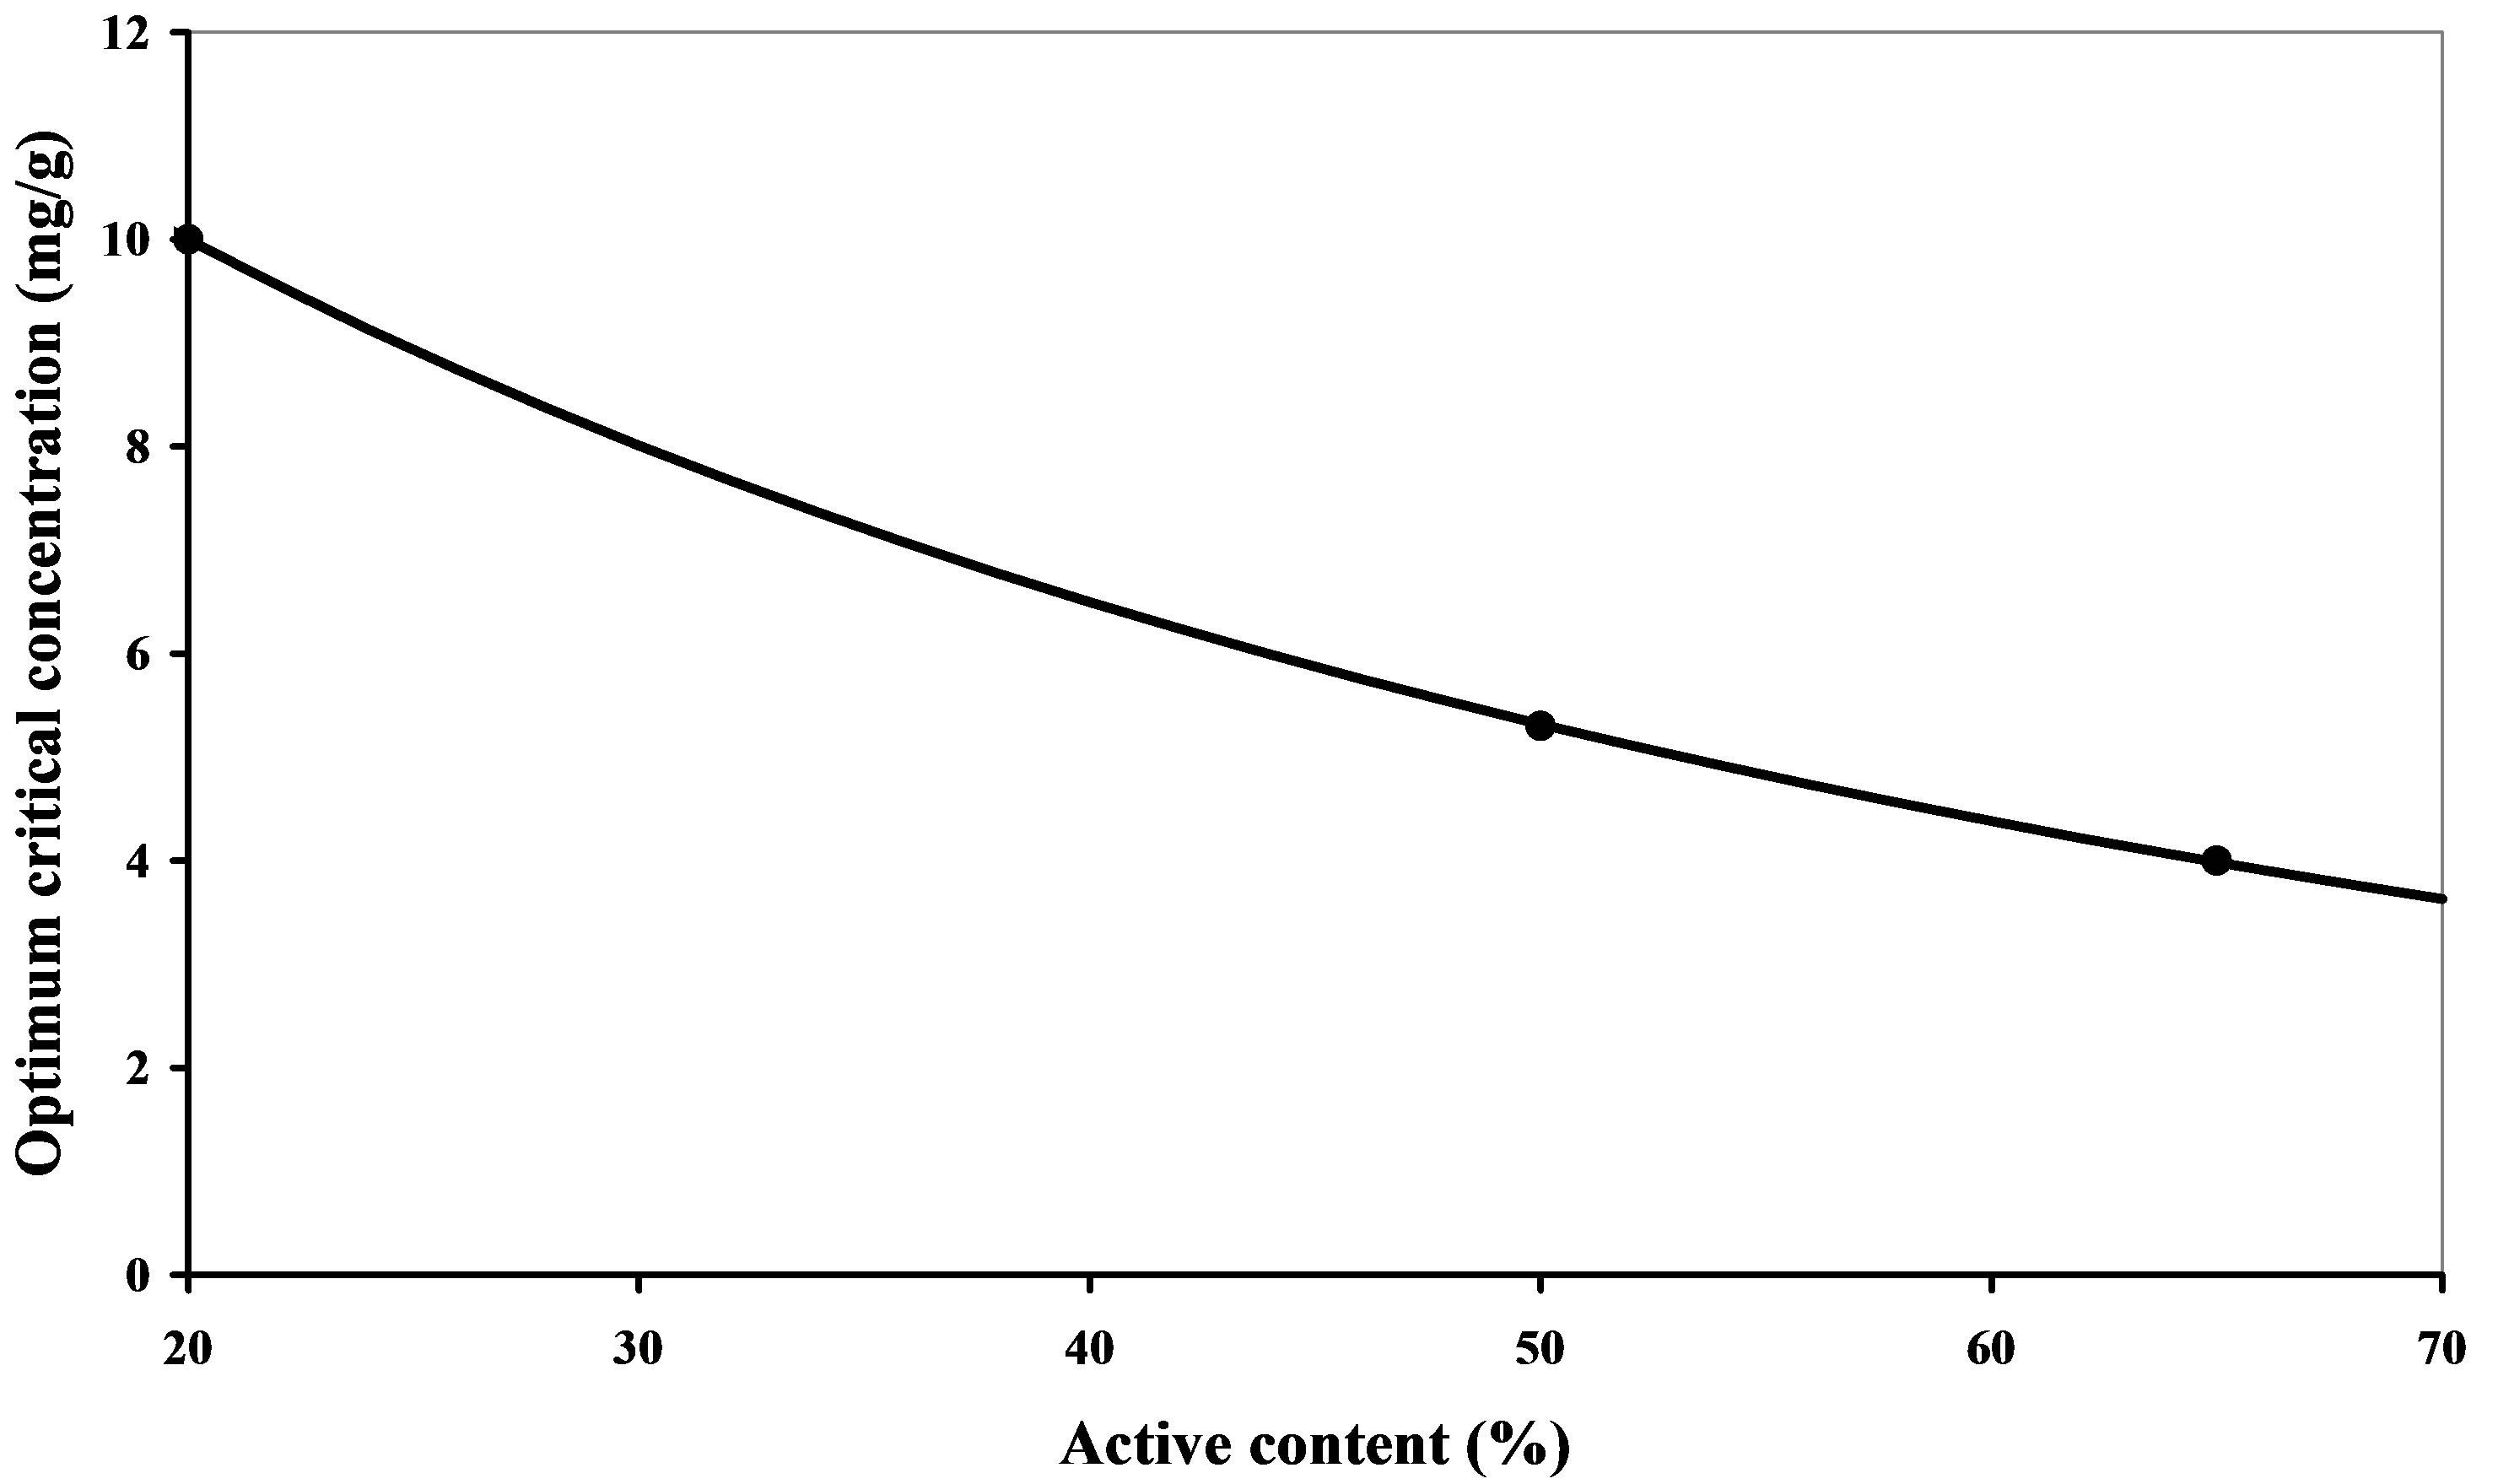
Figure 7. Evolution of the OCC as a function of the percentage of the coagulant’s active matter.
be treated, to the design and use of the installation and how the flocculant is used.
In order to optimize our search for the best reagent for the suspension studied, 8 flocculants were tested using the jar test. These polymers are all cationic, with different molar masses and cationic charges. Their references are FO4115, FO4115SH, FO4190, FO4190SH, FO4990, FO4990SH, FO4550 and FO4800SH. The experimental protocol therefore included 4 coagulants and 8 flocculants. Each test involved coagulation followed by flocculation. The efficiency of the various reagents was evaluated in terms of supernatant clarity. The lowest turbidities were obtained with FO4190, FO4550 and FO4990- SH with optimum flocculant concentrations (OFC) of between 2.8 and 3.12 mg/g. This last value was used for the study of floc texture in spite of the fact that it is in excess in the case of FO4990SH.
Coagulation and flocculation were done in the 1-liter reactor described above. The performance of this reactor is similar to those of industrial flocculation containers [27]. Moreover, this one-dimensional reactor is energy efficient.
The coagulants were conditioned under a gradient of 583 s–1 for 10 min. This set of parameters was selected following a kinetic and hydrodynamic study that is not discussed in detail here. An example of the impact of the duration of conditioning on the mixing efficiency and on the fractal dimension is summarized below (Table 5). After 10 minutes, we observed a very compact population of aggregates having a very high fractal dimension and a very limited size distribution. 10 minutes is a turning point after which the size of microflocs and their fractal dimensions vary relatively little. After 10 minutes, the microflocs are more resistant than those obtained in less than 10 minutes and are similar to the microbeads obtained after 120 minutes.
Where t is the time, dmL is the average diameter measured by laser diffractometry, DSI is the spread index expressed by the ratio (d90 - d10)/(2d50) and DF is the masse fractal dimension.
dx: diameter corresponding to x% of cumulative undersize by volume (x = 10, 50 or 90).
The performances of the 4 coagulants selected in terms of size and fractal dimension are given in Table 3. FL2250, a polyamine with a low molar mass (Table 1), gave the poorest results. It aggregated the mineral particles much less well. The flocs obtained with this coagulant were weak (Figure 8) [28], had a fractal dimension of 1.96 and a very broad size distribution, DSI = 37. Indeed, with short chains (low molar mass), the surfaces are isolated without causing a great formation of bridges between mineral surfaces. The performances of the other coagulants are similar, even identical for FL4520 and
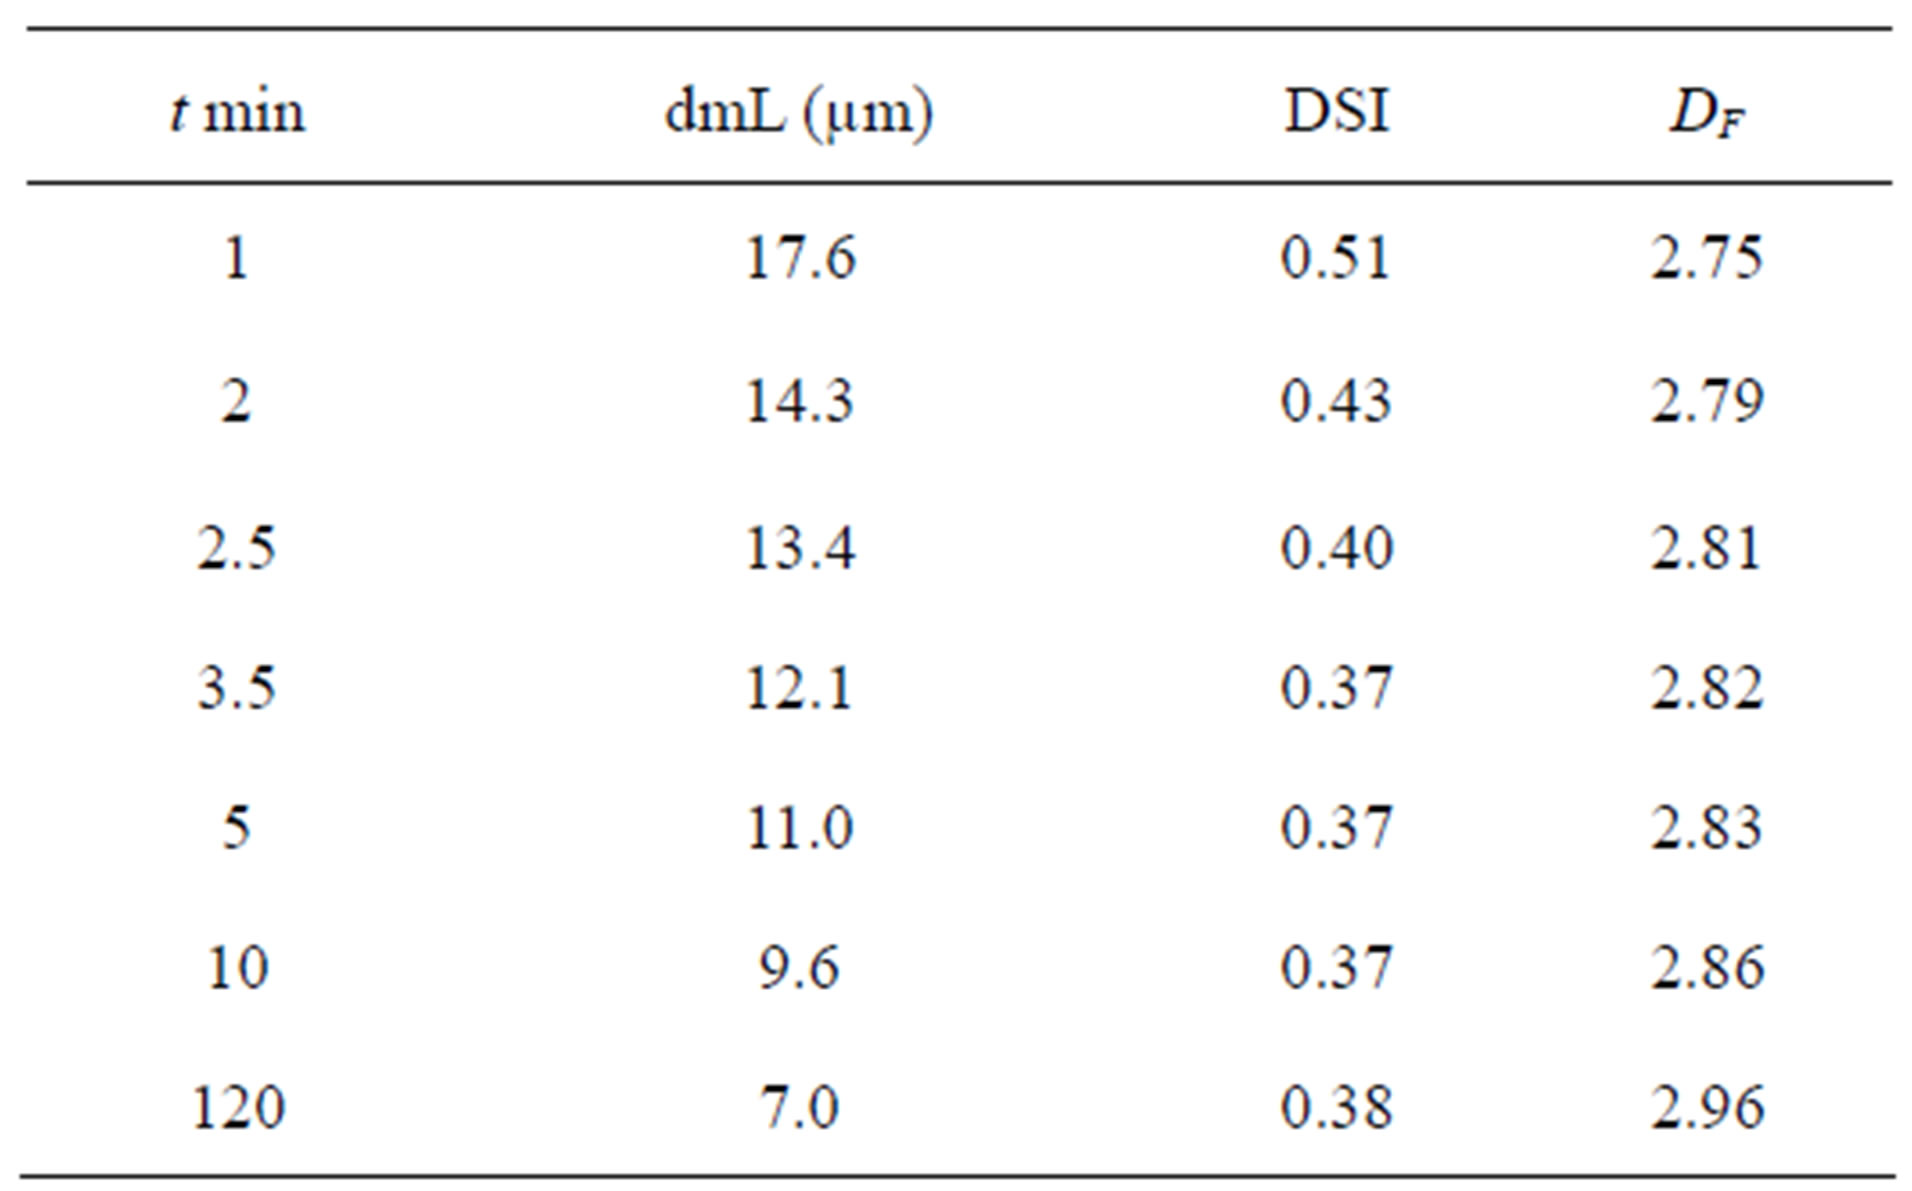
Table 5. Fractal dimension and principal size parameters after coagulation.
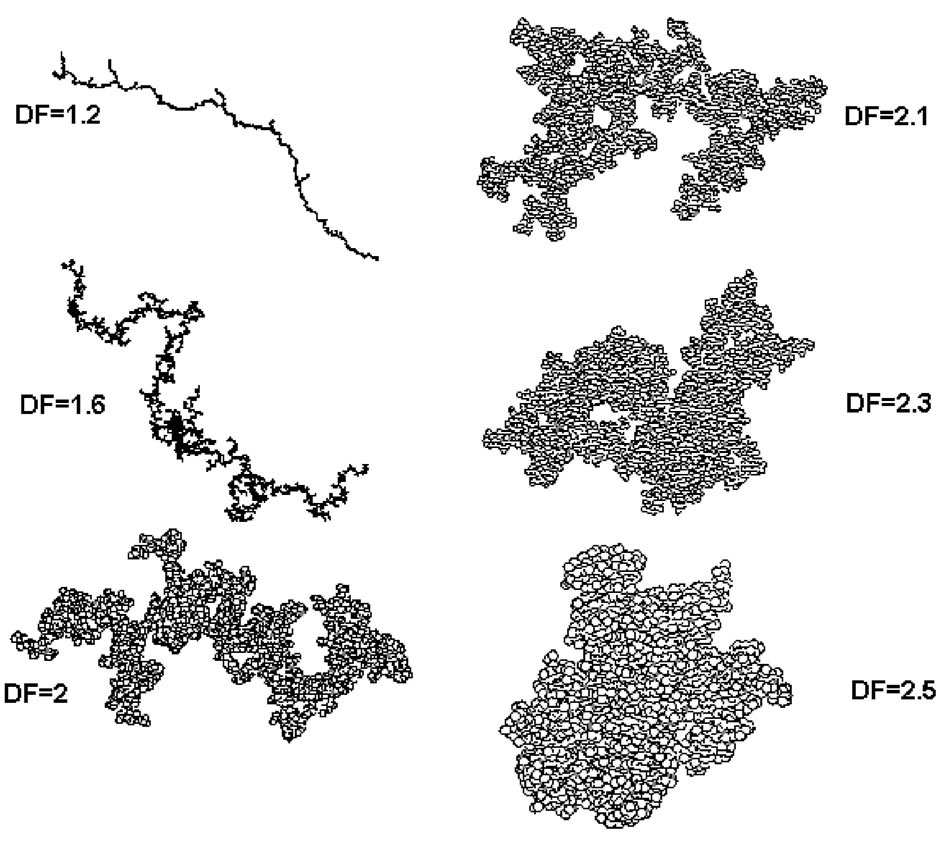
Figure 8. Two-dimensional projections of typical three-dimensional aggregates of 4096 primary particles obtained for DF = 1.5 to 2.5 [28].
FL4820. The fractal dimensions of these 3 reagents are similar and represent very compact structures (Figure 8). In light of these results, we chose to continue the coagulation/flocculation treatment only with FL2565 and FL- 4820.
3.3.2.2. Flocculant Performance The main characteristics of the flocculants used are given in Table 2. The coagulation required a rather rapid stirring rate in order to mix the suspension well and bring the various small entities (NPs/polymers) into contact. Flocculation, however, requires a relatively slow stirring rate in order to foster contact and the aggregation of the microflocs into larger flocs without breaking the flocs that have already formed.
The most relevant textural parameters are given in Table 6. In terms of particle size distribution, the treatment used for the 3 combinations selected conditions the product in populations of large homogeneous, almost monomodal flocs (Figure 9). The proportion of small flocs is almost insignificant compared to the central population. The smallest diameter observed in the 3 particle size analyses is about 4 µm, which is 47 times larger than the average diameter of the untreated product.
Where t is the time, dmL is the average diameter measured by laser diffractometry, dx is the diameter corresponding to x% of cumulative undersize by volume (x = 10, 50 or 90), DSI is the spread index expressed by the ratio (d90 - d10)/(2d50), DF is the masse fractal dimension, εF is the average floc porosity, ρF is the average floc density and t is the turbidity.
The existence of a population of small flocs is related to the flocculation process. As flocculation proceeds, the
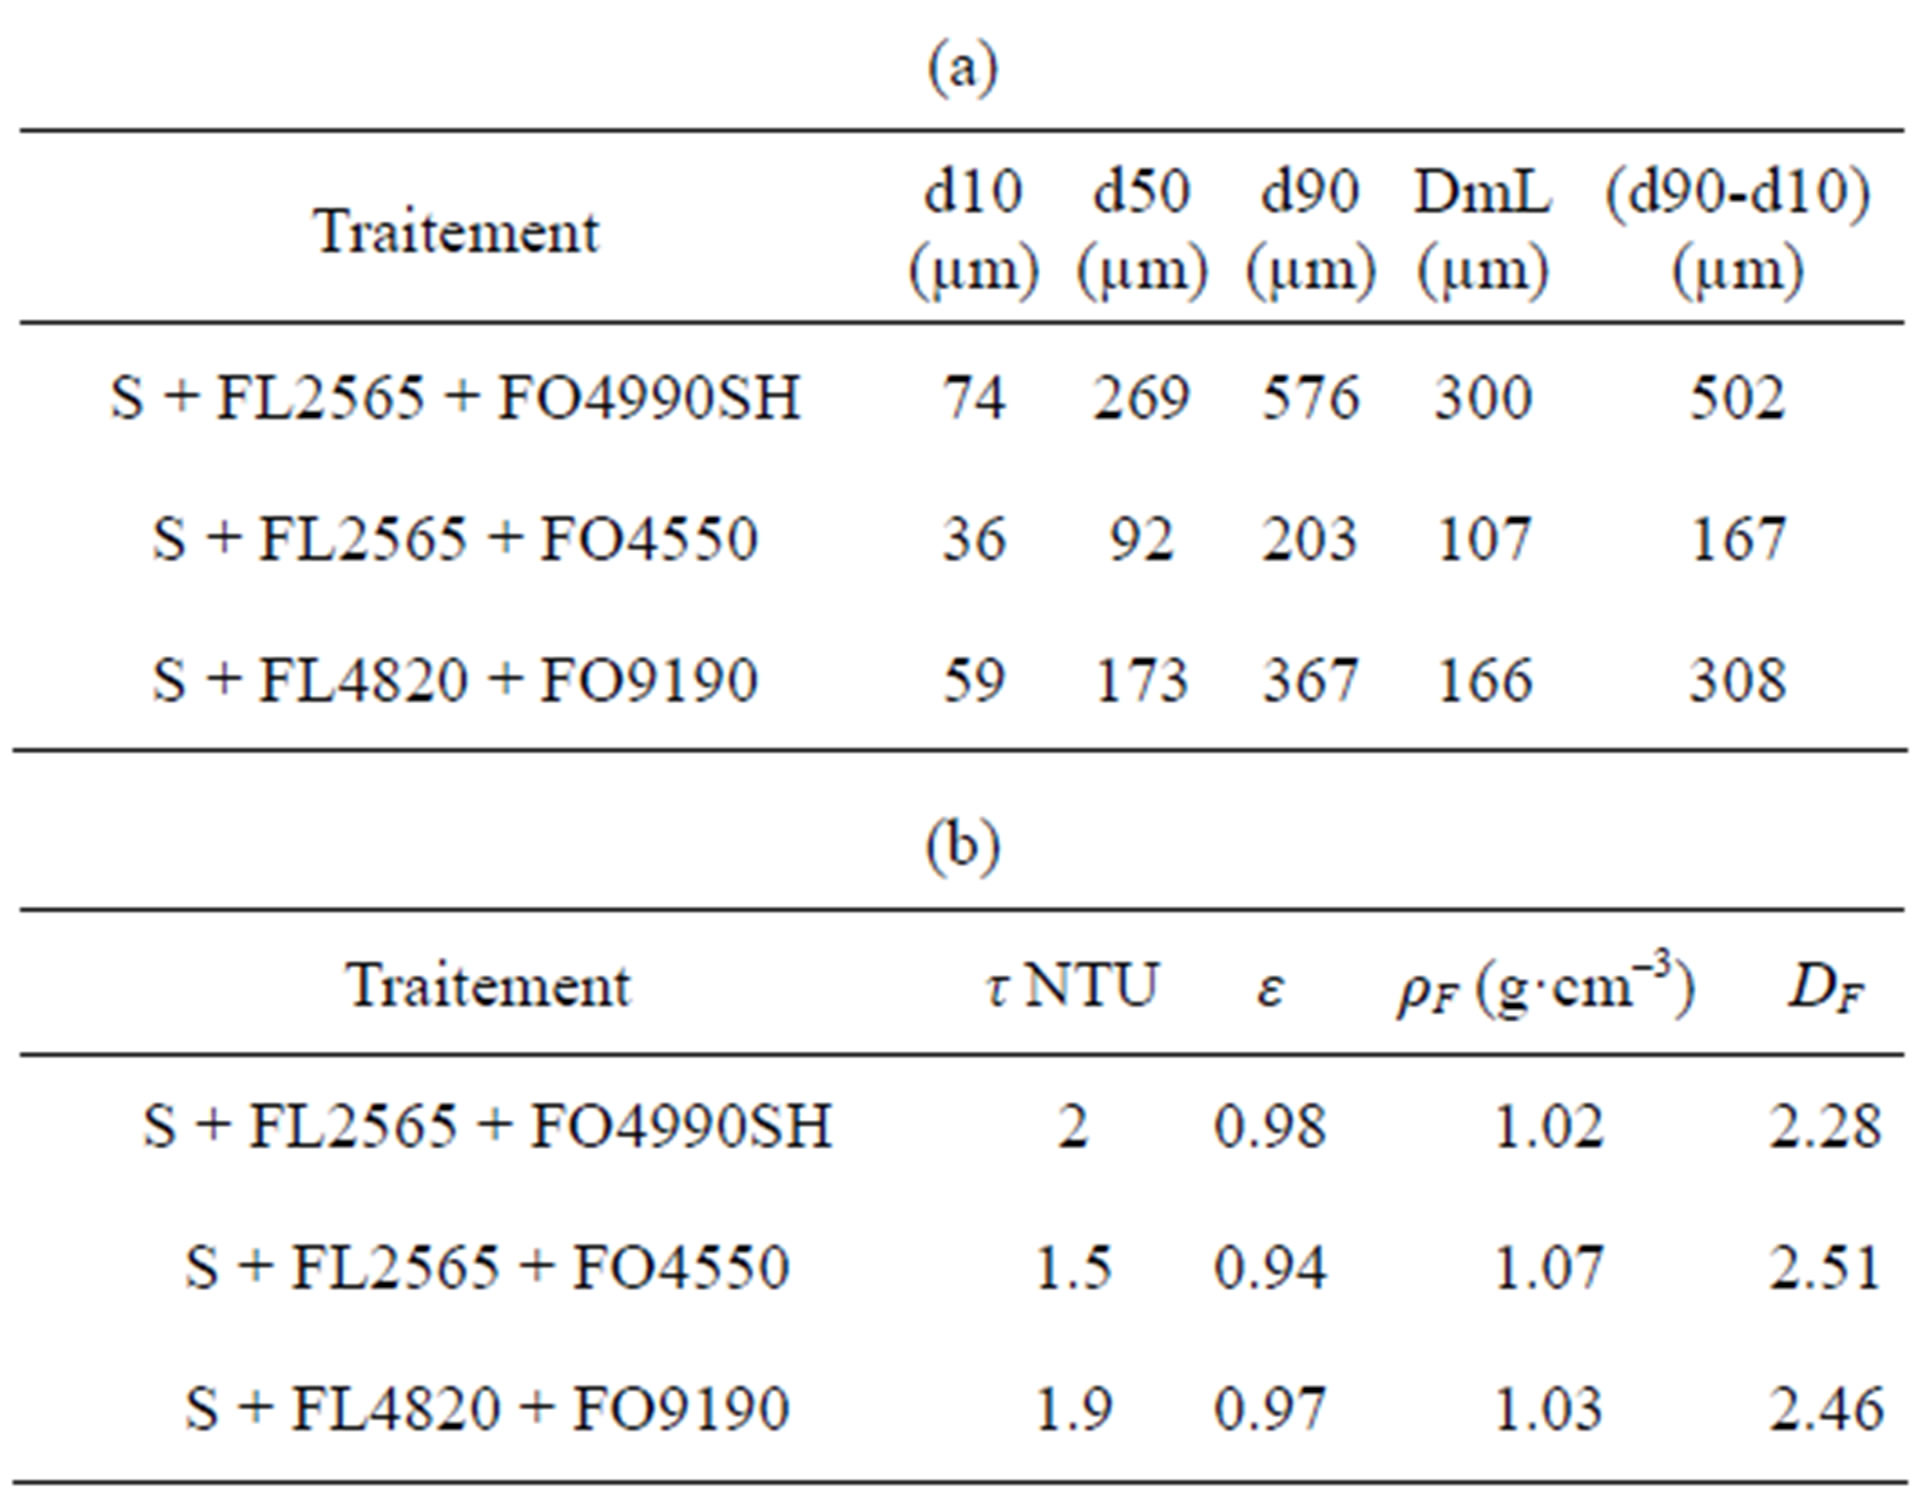
Table 6. (a) Turbidity and texture after coagulation and flocculation; (b) Turbidity and texture after coagulation and flocculation.
formation of large flocs decreases, the number of particle collisions drops and, as a result, a certain number of microflocs are not aggregated. The shapes of the 3 distributions is similar (Figure 9). This suggests that the floc formation conditions are identical and the observed differences in size range are a result of the nature of the reagent used. The smallest variation is observed with the FL2565/FO4550 combination, which also fosters the formation of the densest and most compact flocs (Figure 8). Table 6 shows that the density decreases rapidly as size increases, which indicates the formation of increaseingly open structures characterized by an increasingly low fractal dimension. This shows that the average fractal dimension is a constant that reflects both the initial state of particle coagulation and the role and nature of the added flocculant.
The best criterion for flocculant selection is good clarity and a high sedimentation rate. The most relevant measurements are given in Table 6. For turbidity measurements, 3 other suspensions were prepared under the same coagulation and flocculation conditions and sedimentation was monitored. The turbidity of the settled solids, collected 20 mm beneath the surface of the liquid after 5 minutes of decantation, was measured. The results obtained for the 3 tests are equivalent to or lower than 2 ±1 NTU (Table 6(b)). DLS particle size analyses done on these samples after sieving at 10 µm did not reveal the presence of NPs. The measured intensities are nil.
Concerning sedimentation, the size of the flocs and their size distribution, d10 in particular, govern most of the variation in the floc decantation rate. Literature references indicate that water flow through porous intra-floc space can also influence the decantation rate of the most porous, granular flocs that have sufficient permeability. For a given density and size, the sedimentation rate of a
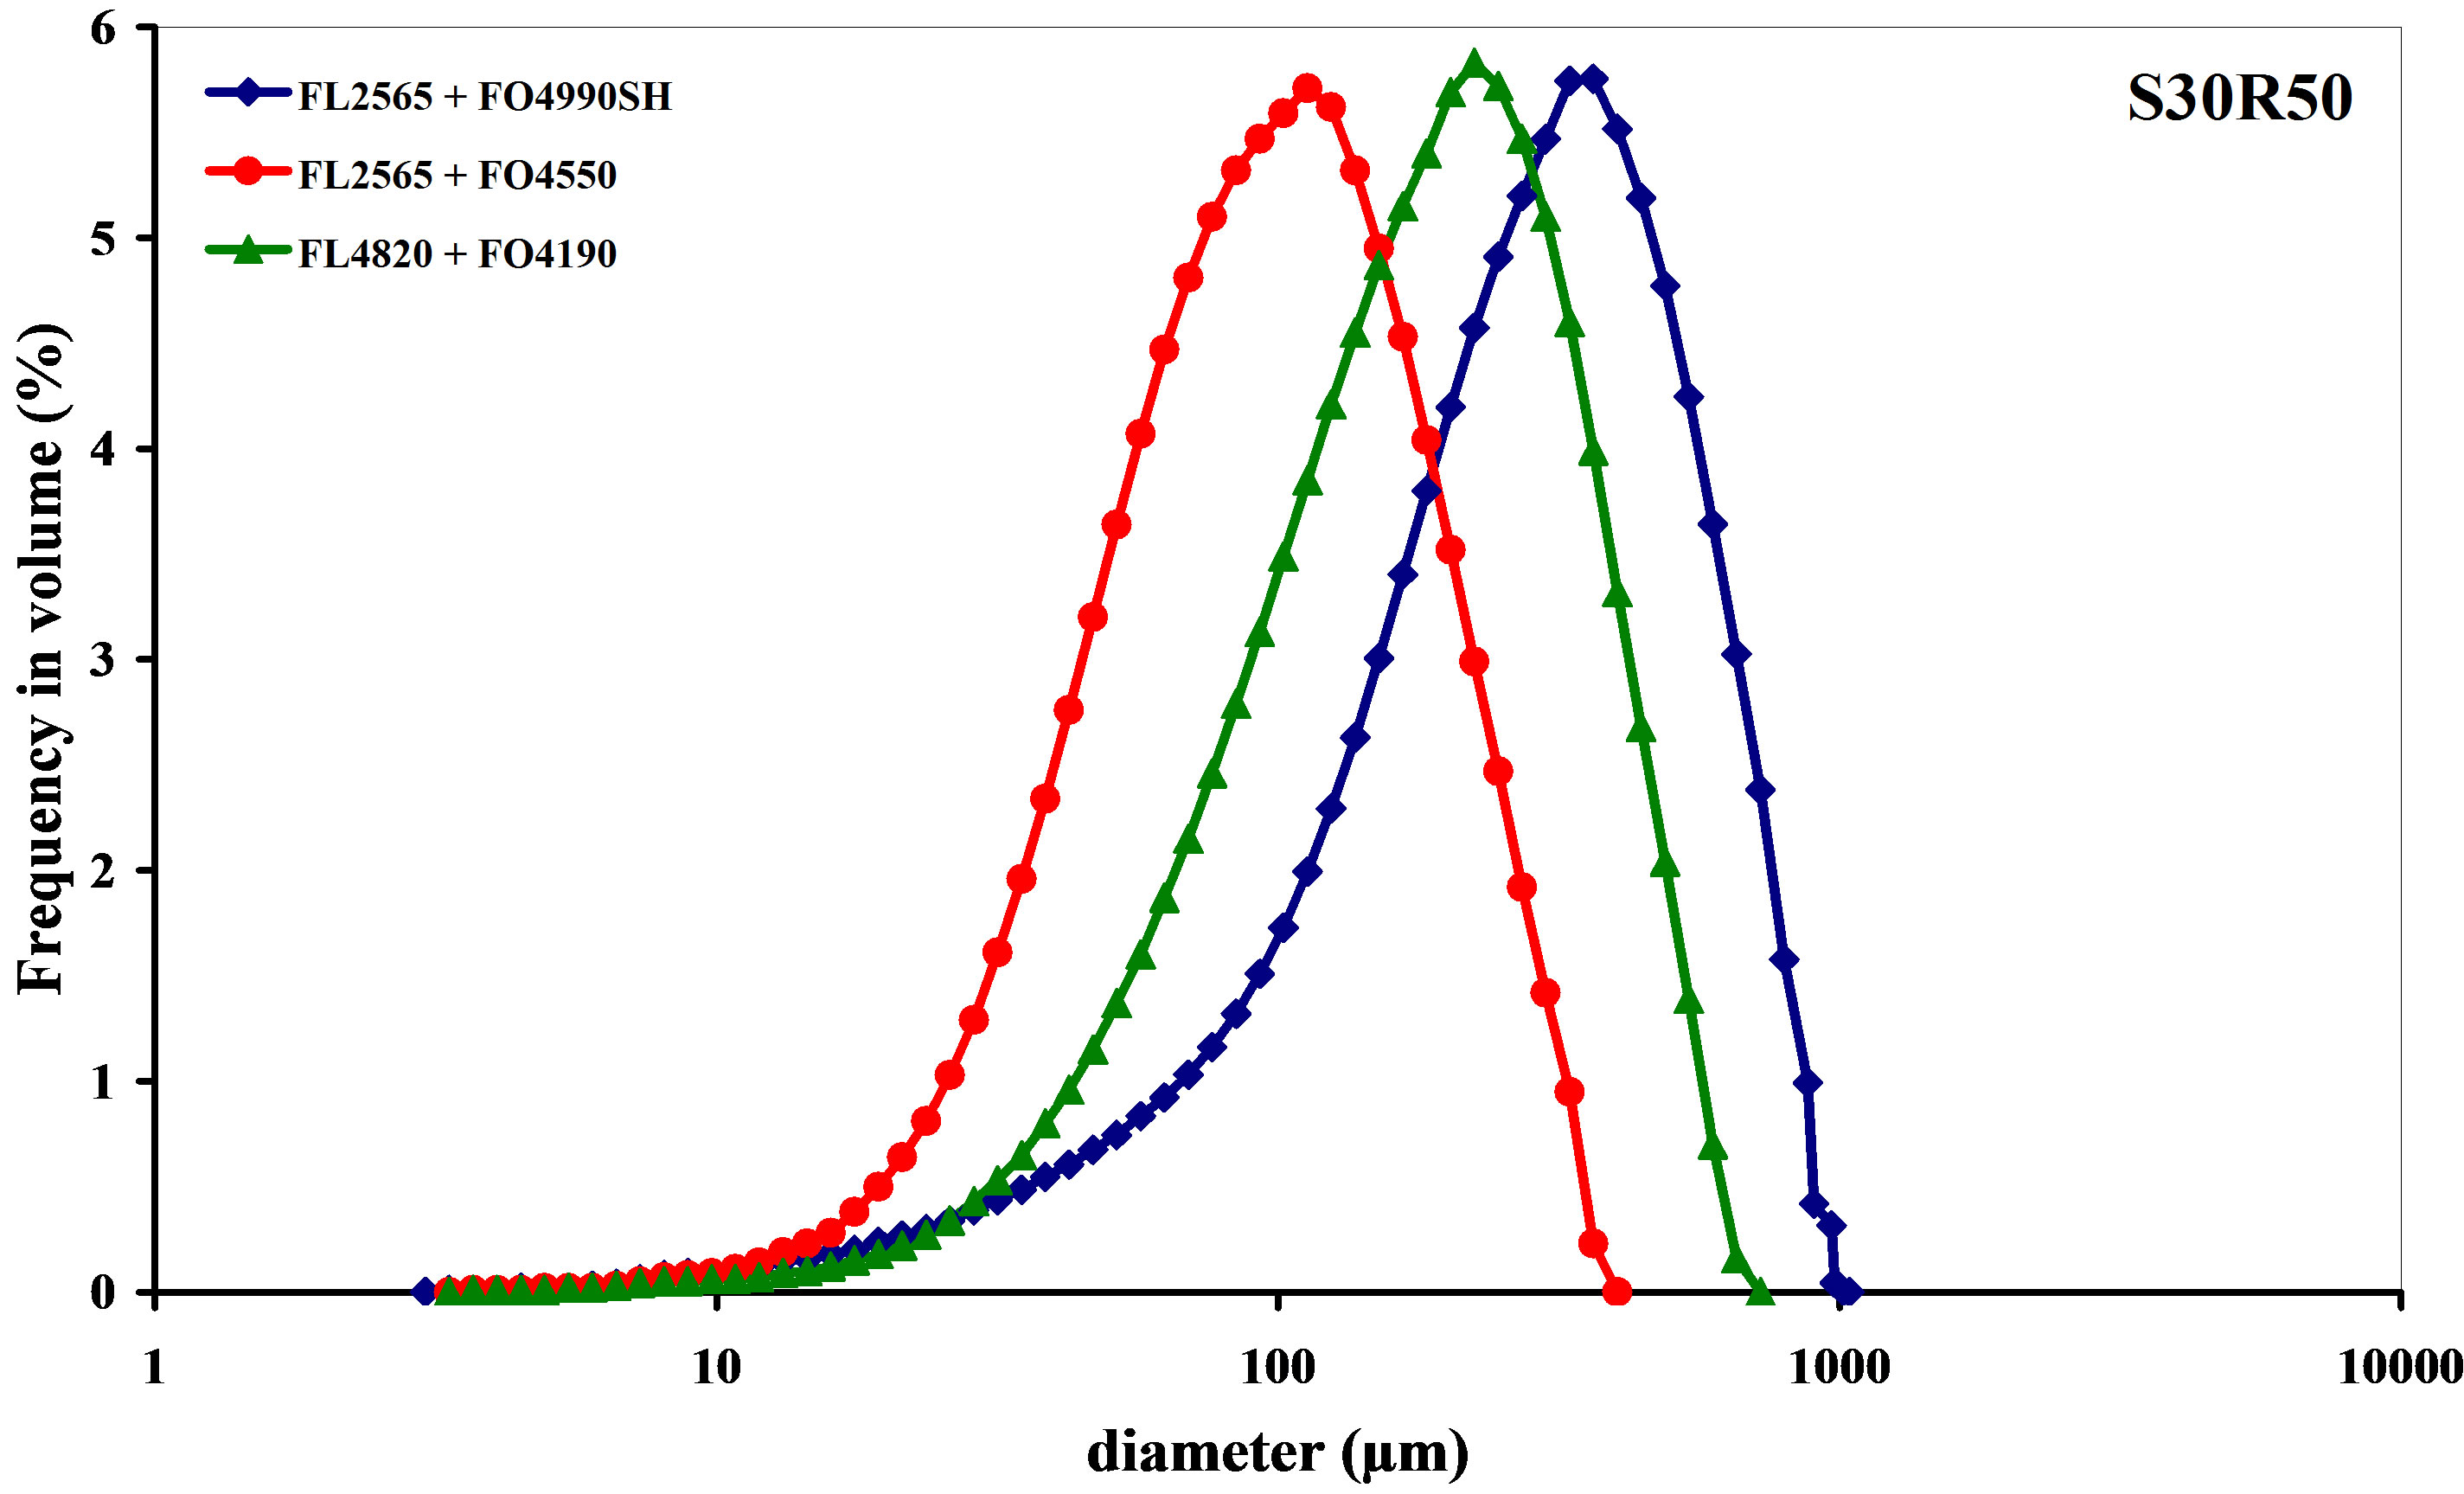
Figure 9. Size distribution after coagulation-flocculation.
porous and permeable sphere is greater than that of a compact sphere. Fluid circulation in the pores increases the velocity, under laminar flow and at the beginning of transient flow, for a porous sphere compared to a nonpermeable sphere having the same size and average density [29].
This criterion, based solely on clarity, does not, by itself, enable us to select a combination. In the absence of measured decantation rate data, it is preferable not to make a selection, especially since this treatment will be part of a solid/liquid separation process that includes filtration.
4. CONCLUSIONS
The aim of this work was to contribute to the study of the stability of silica NPs (nanosilica) and to the development of a methodology for their destabilization by coagulation-flocculation. The aggregation process proposed here uses standard organic reagents and involves the characterization on line by laser diffractometry of the aggregates formed. The results obtained depend on the nature of the solid phase, the physico-chemical properties of the NP suspension, the nature of the aggregation reagents and the hydrodynamic conditions of stirring and mixing.
In an effort to attain good performance, we used cationic organic coagulants. These have advantages compared to common reagents like iron or aluminium salts. They are used in low concentrations and have a low impact on the pH of the suspension. Under fixed hydrodynamic and physico-chemical conditions, the nature of the coagulants chosen was a determining factor for the success and the optimization of the separation process. The ratio of their charge density to their molar mass governs the quality of the separation and the floc size and texture. Aggregation was also fostered by the NPs’ surface energy.
Reaching our objective was greatly facilitated by the use of laser diffractometry on line. This technique also enabled the determination of the porosity, density and fractal dimension of the flocs, although not the size distributions.
The performances obtained show that the use of cationic polymers is a promising process for treating other types of NPs. However, prior to industrial use, a hydrodynamic study of the process should be carried out in order to determine the impact of the process on floc aggregation and rupture phenomena and on their structure. Efforts must be made in this direction to better understand the relationship between structure and size, the consequences on floc cohesion and permeability and, lastly, on filtration.
Future work might involve the inclusion of this process in an industrial flowsheet entailing coagulationflocculation and filtration.
5. ACKNOWLEDGEMENTS
The author is grateful to French National Research Agency for financial support (NANOSEP, ANR-08-ECOT-009). He would also like to thank SNF FLOERGER (France) for providing samples of the coagulants and flocculants used and AZ Electronic Materials for providing the nanosilica.
REFERENCES
- Oberdörster, G. (2000) Toxicology of ultrafine particles: In vivo studies. Philosophical Transactions of the Royal Society A: Mathematical, Physical and Engineering Sciences, 358, 2719-2740.
- Banfield, J.F. and Navrotsky, A. (2001) Nanoparticles and the environment. Reviews in mineralogy and geochemistry. Mineralogical Society of America, Washington DC.
- Yean, S., Cong, L., Yavuz, C.T., Mayo, J.T., Yu, W.W., Kan, A.T., Colvin, V.L. and Tomson, M.B. (2005) Effect of magnetic particle size on adsorption and desorption of arsenite and arsenate. Journal of Material Research, 20, 3255-3264. doi:10.1557/jmr.2005.0403
- Clariant Klebosol Brochure 2010.
- Zantye, P.B., Kumar, A. and Sikder, A.K. (2004) Chemical mechanical planarization for microelectronics applications. Materials Science and Engineering, 45, 89-220.
- Brunauer, S., Emmett, P.H. and Teller, E. (1938) Adsorption of gases in multimolecular layers. Journal of the American Chemical Society, 60, 309-319. doi:10.1021/ja01269a023
- Marler, B. (1988) On the relationship between refractive index and density for SiO2 polymorphs. Physics and Chemistry of Minerals, 16, 286-290. doi:10.1007/BF00220696
- Murillo, A.G. (2002) Elaboration, propriétés structurales, optiques et spectroscopiques de films sol-gel scintillants de Gd2O3 et Lu2O3 dopés Eu3+. PhD Thesis, Claude Bernard Lyon I University, Lyon.
- Henry, D.C. (1931) The cataphoresis of suspended particles. Part I. The equation of cataphoresis. Proceedings of the Royal Society, London Series, 133, 106-129. doi:10.1098/rspa.1931.0133
- Ohshima, H. (1994) A simple expression for Henry’S function for the retardation effect in electrophoresis of spherical colloidal particles. Journal of Colloid and Interface Science, 168, 269-271. doi:10.1006/jcis.1994.1419
- Carman, P.C. (1940) Constitution of colloidal silica. Transactions of the Faraday Society, 36, 964-973. doi:10.1039/tf9403600964
- Iler, R.K. (1955) Colloid chemistry of silica and silicates. Cornell University Press, Ithaca, New York.
- Kent, D.B., Tripathi, V.S., Ball, N.B., Leckie, J.O. and Siegel, M.D. (1988) Surface-complexation modeling of radionuclide adsorption in subsurface environments. NUREG/CR-4807, US Nuclear Regulatory Commission, Washington DC.
- Bizi, M. and Baudet, G. (2006) Contribution of static light scattering to the textural characterization of large aggregates. Journal of Colloid Interface Science, 300, 200-209. doi:10.1016/j.jcis.2006.03.069
- Van de Hulst, H.C. (1981) Light scattering by small particles. Dover Publications, Inc., New York.
- Kerker, M. (1969) The scattering of light and other electromagnetic radiation. Academic Press, New York.
- Guinier, A. and Fournet, G. (1955) Small angle scattering of X-rays. John Wiley and Son, New York.
- Bohren, C.F. and Huffman, D.R. (1983) Absorption and scattering of light by small particles. John Wiley and Sons, New York.
- Michard, G. (1989) Chemical balances in natural waters. Eds Published, Paris.
- Bizi, M. (2012) French National Research Agency Report, NANOSEP-ANR-08-ECOT-009, RP-61015-FR.
- Bolt, G.H. (1957) Determination of the charge density of silica sols. Journal of Physical Chemistry, 61, 1166-1169. doi:10.1021/j150555a007
- Iler, R.K. (1979) The chemistry of silica: Solubility, polymerization, colloid and surface properties and biochemistry of silica. John Wiley and Sons, New York.
- Prezzi, M., Monteiro, P.J.M. and Sposito, G. (1998) Alkali-silica reaction. Part 2: The effect of chemical additives. ACI Materials Journal, 95, 3-10.
- Cases, J.M. (1969) Point de charge nulle et structures des silicates. Journal of Chemical Physics, 66, 1602-1611.
- Gregory, J. (1973) Rates of flocculation of latex particles by cationic polymers. Journal of Colloid Interface Science, 42, 448-456. doi:10.1016/0021-9797(73)90311-1
- Gregory, J. (1987) Flocculation by polymers and polyelectrolytes. In: Tadros, T.F., Ed., Solid-Liquid Dispersions, Academic Press, London.
- Bizi, M. and Gaboriau, H. (2008) Flocculation analysis and control system by laser diffractometry at industrial scale. AIChE Journal, 54, 132-137. doi:10.1002/aic.11352
- Thouy, R. and Jullien, R. (1996) Structure factors for fractal aggregates built off-lattice with tunable fractal dimension. Journal of Physics, 6, 1365-1376.
- Matsumoto, K. and Suganuma, A. (1977) Settling velocity of a permeable model floc. Chemical Engineering Science, 32, 445-447. doi:10.1016/0009-2509(77)85009-4