Natural Science
Vol.4 No.5(2012), Article ID:19116,6 pages DOI:10.4236/ns.2012.45042
Major-minor element analysis in some plant seeds consumed as feed in Turkey
![]()
1Department of Chemistry, Faculty of Sciences and Arts, Celal Bayar University, Manisa, Turkey; *Corresponding Author: umran.hicsonmez@cbu.edu.tr
2Department of Biology, Faculty of Sciences and Arts, Celal Bayar University, Manisa, Turkey
3Department of Physics, Faculty of Sciences and Arts, Celal Bayar University, Manisa, Turkey
4Department of Mathematics, Faculty of Sciences and Arts, Celal Bayar University, Manisa, Turkey
Received 20 June 2011; revised 25 July 2011; accepted 10 August 2011
Keywords: Seed; Element Analysis; ICP-OES; ANOVA
ABSTRACT
In this study, samples (clover, oats, bean, green lentil, spinach, corn, red lentil and rice) taken from some seeds consumed as food by people and from plant seeds used as provender are examined. Element analysis (Al, B, Ba, Bi, Ca, Cd, Co, Cr, Cu, Fe, K, La, Mg, Mn, Na, Ni, Pb, Sn, Sr, Sb, Si, Ti, U, Zn and Zr) in these samples was measured by using ICP-OES. Ca, K and Mg as major elements in all samples are determined. As results of the element analysis, meaningful relations between the elements in seeds have been researched by making statistical comparisons using one way analysis of variance (ANOVA).
1. INTRODUCTION
In the last few decades, the determination of minerals and trace elements is important to enhance production efficiency in plants and foods [1]. The various elements transfer to the food chain of humans is significantly affected by the geological origin of the soils and the groundwater basin as well as the living area of the flora and the drinking water reservoir. Some of the trace elements including iron, manganese, zinc and copper are essential micronutrients with a variety of biochemical functions in all living organisms. However, the benefits of these micronutrients may be completely reversed if present at high concentrations. Some heavy metals particularly cadmium and lead, not essential elements for human nutrition, on the other hand, have been considered serious soil and environment pollutant due to their potential toxicity at low concentrations [2]. In addition, uranium and potassium-40 which is radioisotope of its element get into the flora and are comprehensively stored in young plants [3].
Recent studies have shown that some of the seeds could find application as animal feeds, based on their nutritional values, and raw materials for paint formulation based on the amounts and nature of the oils contained in them [2,4-7]. In the study made by Bakoglu et al., nine elements (Cu, Mn, Cr, Ni, Zn, Fe, Mg, Al and Pb) were detected and protein contents were determined between 18.40 - 45.54 percentages in the seed. According to Bakoglu et al. M. minima var. minima’s seeds are a good source of essential and beneficial micronutrients required for healthy growth [8]. Kranner and Colville (2011) had been investigated the transport of metals to developing seeds, the tissue-specific localization of metals within seeds, and finally the uptake of metals from soil by intact seeds [9].
Ajayi (2008) also found that the seeds were good sources of mineral elements. The result revealed potassium to be the prevalent mineral elements which are 2470.00 ppm and 1680.00 ppm for A. heterophyllus and T. africana, respectively followed by sodium, magnesium and then calcium [4].
The techniques most widely used for analyses of various plants include ICP-OES (Inductively coupled plasma optical emission spectrometry), ICP-AES, ICP-MS (Inductively coupled plasma mass spectrometry), FAAS (Flame atomic absorption spectrometry) and ETAAS (Electrothermal AAS) [1,2,5,8,10].
ICP (Inductive coupled plasma) diffusion spectroscopy is commonly used as a good element analysis technique today and it has got the capacity to measure considerable amount of elements at same time.
Chaves et al. (2010) have proposed methods for the determination of 5 major (Ca, K, Mg, Na and P) and 14 minor elements (Al, Ba, Cd, Co, Cu, Fe, Ga, Mn, Mo, Ni, Pb, Rb, Sr and Zn) in vegetable seeds by ICP OES and by ICP-MS, respectively. Among the four major studied elements, K was more concentrated, followed by P, Mg and Ca for the majority of the seeds. Among the elements determined by ICP-MS, Fe, Zn, Na, Al and Mn showed higher concentrations [11].
In another study in England, Jung and Thornton (1997) made element analysis in soils, rice caulines and waters by using ICP-AES. They examined concentrations of element Cd, Cu, Pb, Zn and N in rice and rice cauline. Results of Cd, Cu, Pb, Zn and N concentrations in rice cauline varied as 0.20 - 0.70 μg/g, 5.3 - 22.6 μg/g, 3.1 - 10.3 μg/g, 27 - 486 μg/g and 31 μg/g, respectively. Also concentrations of Cd, Cu, Pb, Zn and N in rice varied as 0.20 - 0.70 μg/g, 5.3 - 22.6 μg/g, 3.1 - 10.3 μg/g, 27 - 486 μg/g and 31 μg/g, respectively [12].
In our study, element analysis of some seeds consumed as food by people and some plant seed used as provender was measured by using ICP-OES. As results of the element analysis, by making statically comparisons, meaningful relations between elements in seeds have been researched. Statistical analyses were performed using MINITAB software package [13].
2. MATERIALS AND METHODS
Seeds were bought from seed wholesalers and local markets in Western Turkey (Manisa, Izmir provinces or towns). Samples (clover, oats, bean, green lentil, spinach, corn, red lentil and rice) were grinded in a grinder.
One gram powdered dry samples were weighed into 100 ml glass beakers. 3 mL of 65% HNO3 and 5 mL of 35% H2O2 was added to the samples and allowed to react overnight. The following morning the beakers were carefully heated until clear solutions were obtained. Care was taken to ensure that the samples did not dry. A mixture of 3 mL 65% HNO3 and 9 mL 37% HCl was added and gently heated until a small volume of acid remained. The residue was filtered and solutions were precisely transferred to 100 mL plastic standard flasks and made to volume with deionized water.
Element concentrations of Al, B, Ba, Bi, Ca, Cd, Co, Cr, Cu, Fe, K, La, Mg, Mn, Na, Ni, Pb, Sb, Si, Sn, Sr, Ti, U, Zr and Zn were analyzed with a Perkin-Elmer 2001 Model Inductively Coupled Plasma-Optic Emission Spectrometry (ICP-OES).
The statistical results were made by using the one-way of ANOVA test. The differences were assessed by oneway ANOVA test. The reason for doing an ANOVA is to see if there is any difference between groups on some variable. One-way ANOVA is used to test for differences of among two or more groups. The significance at P < 0.05 and P < 0.01 levels has been considered for evaluation [13].
3. RESULTS AND DISCUSSION
Concentrations of element Co, Na, Ca, Mg, Al, B, Ba, Cu, Mn, Ni, Zn, Cr, Cd, Sn, K, Ti, Fe, Sr, Sb, Si, Pb, Bi, U, La, and Zr of the clover, oats, bean, green lentil, spinach, corn, red lentil and rice samples are given Table 1 by using ICP-OES.
It is concluded from the results of element concentrations for the bean, green lentil, spinach, corn, red lentil and rice seeds consumed as food by humans with clover and oats used as provender for animals by using ICPOES. According to Table 1;
• In the element analysis made by using ICP-OES, element concentrations of Cd, Sb, and La have not been detected in all samples.
• It has been determined that element concentrations of Co, Na, Ca, Mg, Al, Cu, Mn, Zn, Cr, Sn, K, Ti, Fe, Sr, Si, Pb and Bi were present in all samples. The element B was not detected in 3 plant seeds (spinach, corn and rice). It was measured maximum concentration in red lentil as 0.5 mg/kg. Metal nutrients, such as iron (Fe), manganese (Mn), zinc (Zn), and copper (Cu), are essential for normal plant growth. During rice seed germination, the nutrients stored in the seed are used for germination. The rice seed is composed mainly of embryo and endosperm and the metal nutrients are stored in both structures [14].
• The element Ba was not detected in 3 samples (corn, red lentil and rice). It was measured maximum concentration in spinach as 4.8 mg/kg.
• The element Ni was not detected in a rice sample. It was measured maximum concentration in oats as 3.7 mg/kg. Foods with mean nickel concentrations > 1 mg/kg included oatmeal, wheat bran, dried beans, soya products, soup powder, tea leaves, hazelnuts, peanuts, lucerne seeds, sunflower seeds, licorice, spices, cocoa, and dark chocolate [15].
• The element U was not detected in 2 samples (clover and corn). Uranium concentrations were measured as £1 mg/kg in other seeds. Anke et al. investigated the specific uranium contents of most of the116 foodstuffs. All sugar-, starchand fat-rich foodstuffs like margarine, bee honey, pearl barley, semolina and vanilla blancmange, cereal grains, seeds, cocoa, coffee, flour, wheat and rye bread, rolls, etc. are generally poor in uranium (0.8 - 1.9 mg/kg dry matter) [3].
In the literature, the concentrations of element Ca, Cd, Co, Cu, Fe, K, Mg, Na, Mn, Ni, Pb and Zn in spinach were measured as 17144 mg/kg, 0.77 mg/kg, 1.41 mg/kg, 2.71 mg/kg, 166.4 mg/kg, 3100 mg/kg, 2370 mg/kg, 5460 mg/kg, 9.9 mg/kg, 17.14 mg/kg, 9.44 mg/kg and 9.6 mg/kg, respectively by using atomic absorption spectrophotometer (AAS) in Egypt [16]. The concentrations of element P, Mn, Fe, Co, Ni, Cu, Zn, Se and Mo in lentil were measured as 3380 μg/g, 14.3 μg/g, 81.5 μg/g, 0.071 μg/g, 1.89 μg/g, 8.52 μg/g, 42.1 μg/g, 1.03 μg/g and 12.7 μg/g, respectively, by using ICP-MS in Czechoslavakia
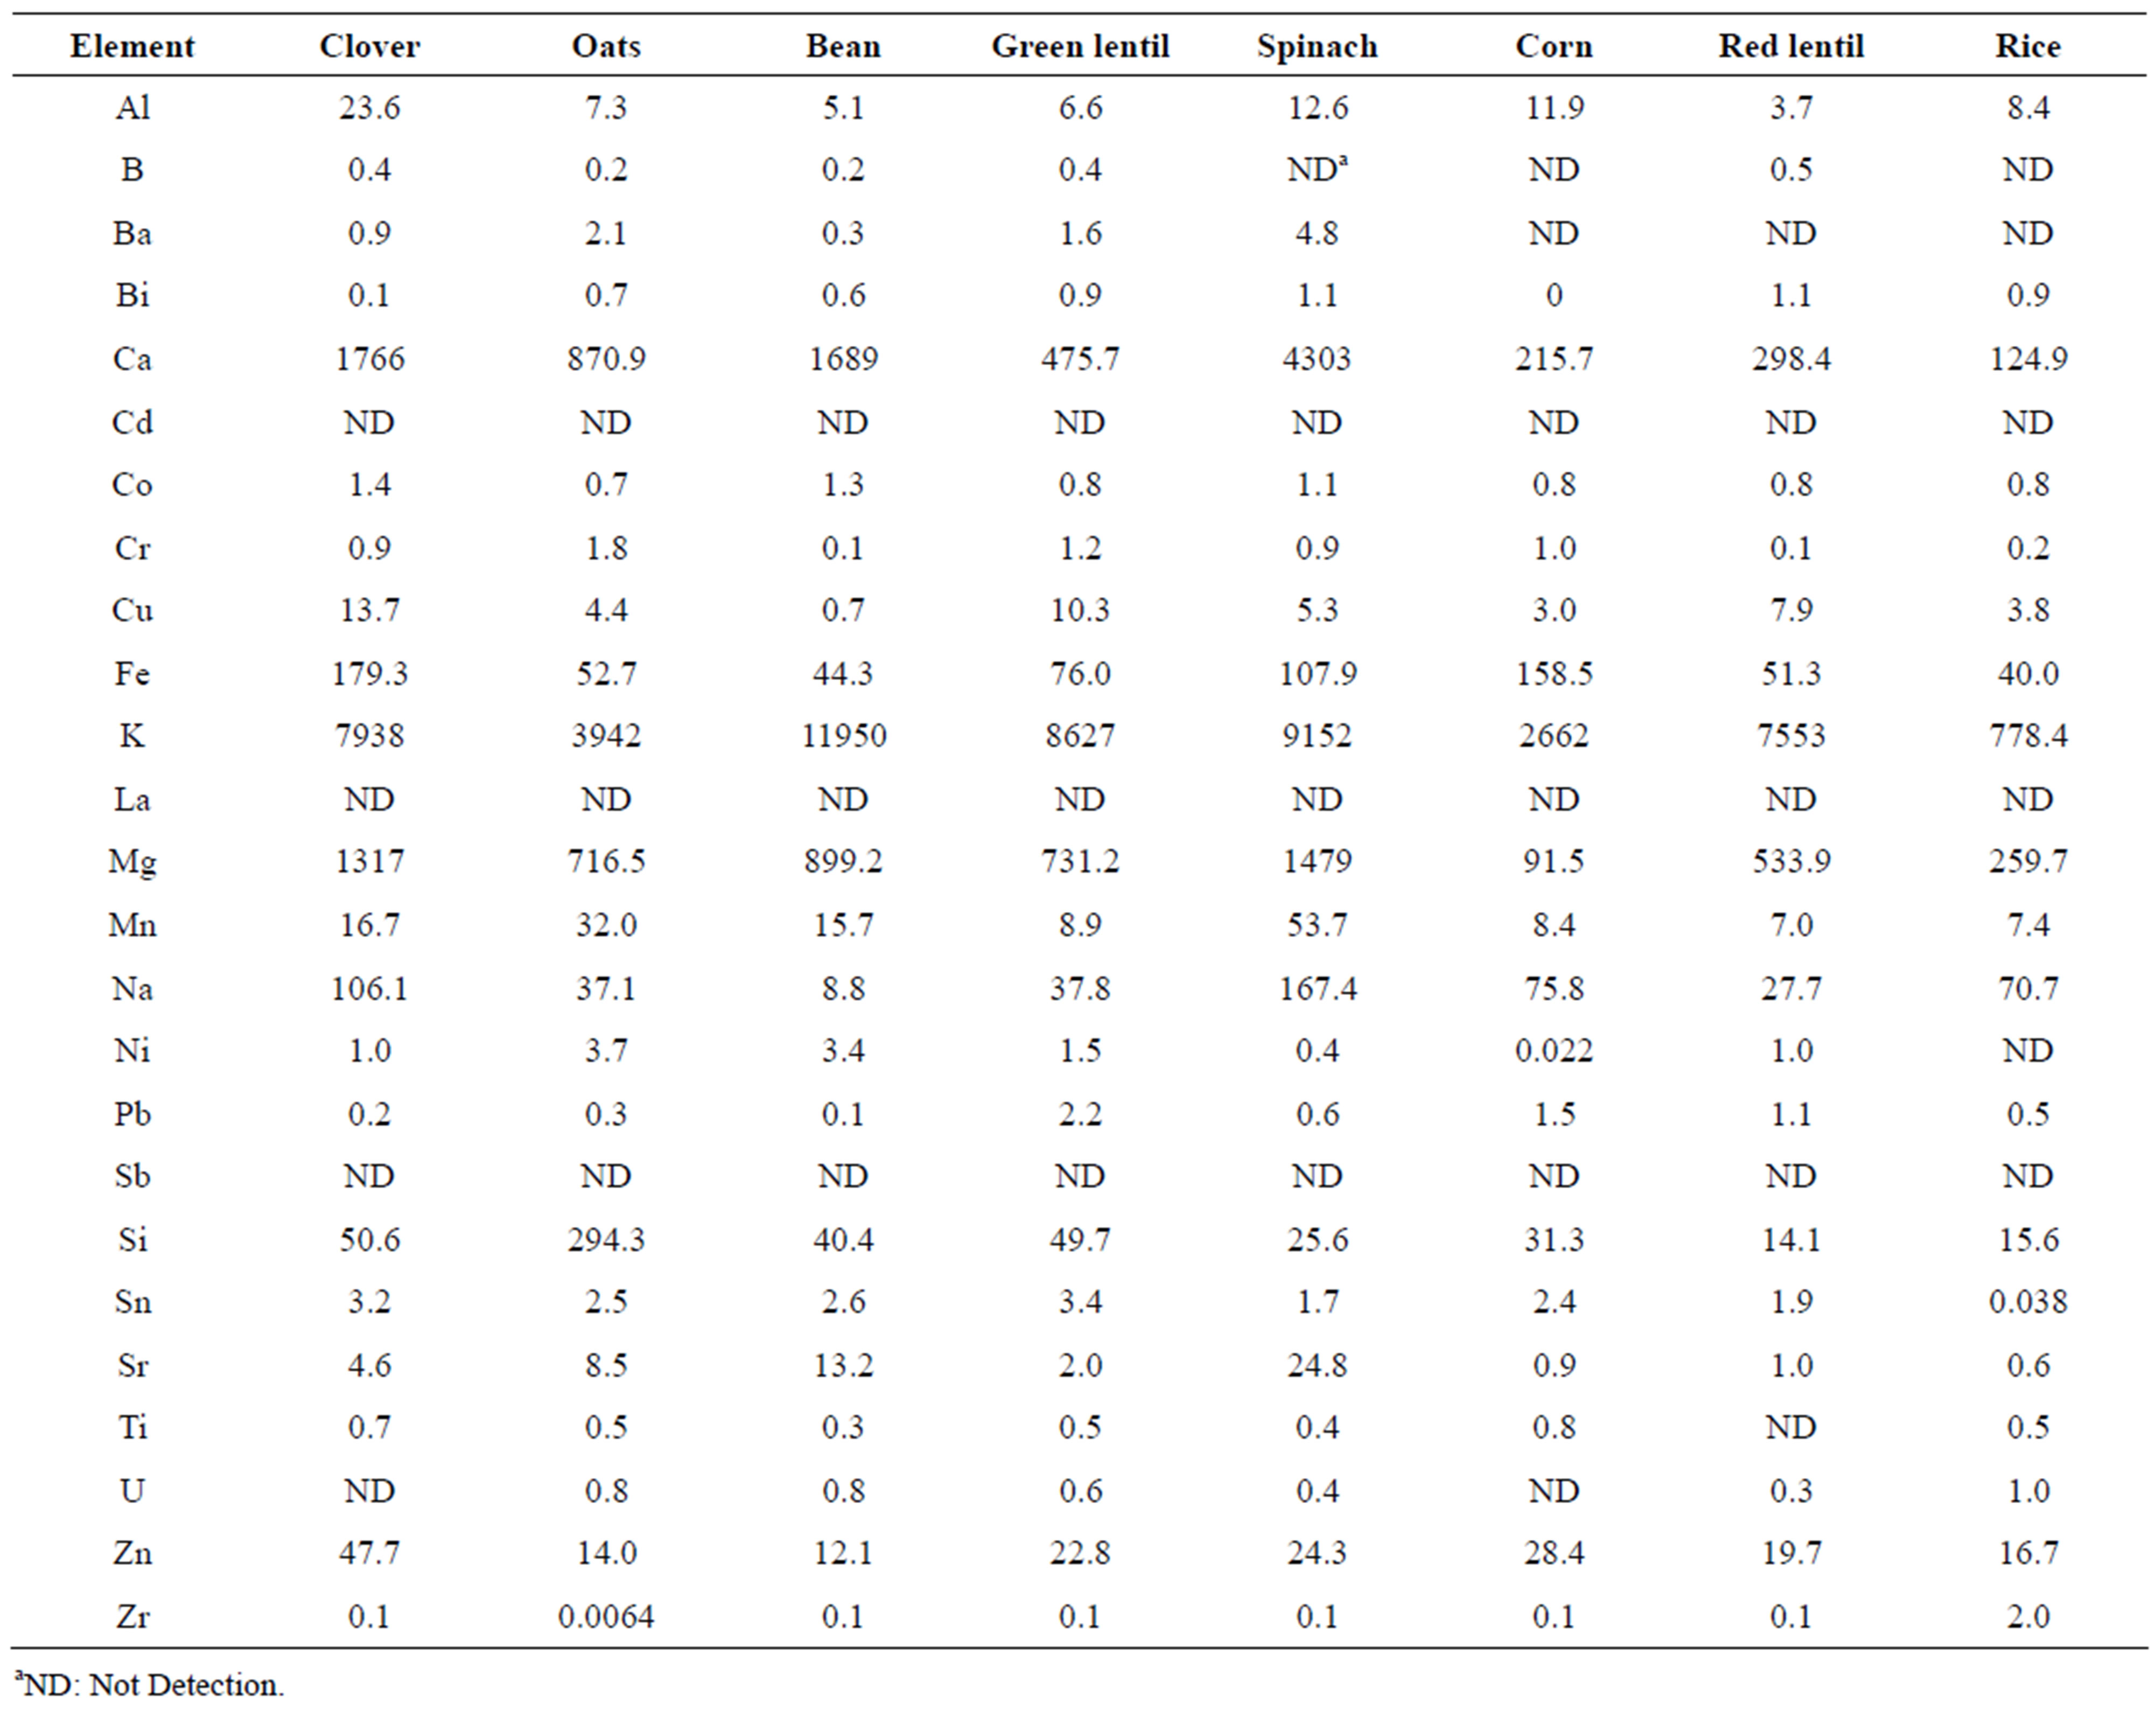
Table 1. Element concentrations of the plant seeds as mg/kg in dry matter.
[17]. In another study in Czechoslavakia, the concentrations of element Cu and Zn were measured as 8.52 μg/g and 42.1 μg/g, respectively, in the seeds of soya bean, lentil and bean by using ICP-MS [18]. In the element analysis of Vicia faba L. var. major, the concentrations of element Ca, P, K, Mg, Na, S, Al, B, Ba, Co, Cr, Cu, Fe, Ga, Li, Mn, Ni, Pb, Sr and Zn were measured as 728.6 mg/kg, 6545.46 mg/kg, 15486.05 mg/kg, 1426.27 mg/kg, 499.70 mg/kg, 497459.95 mg/kg, 15.46 mg/kg, 10.97 mg/kg, 31.02 mg/kg, 0.66 mg/kg, 11.25 mg/kg, 18.00 mg/kg, 89.17 mg/kg, 0.33 mg/kg, 0.067 mg/kg, 15.91 mg/kg, 3.83 mg/kg, 1.50 mg/kg, 5.25 mg/kg and 52.83 mg/kg, respectively, by using ICP-AES [19].
S.D’llio et al. (2002) have done element analysis for 8 different type of rice by using plasma-based techniques (ICP-AES, Q-ICP-MS, HR-ICP-MS) in Italy. Concentrations of Cd, Co, Cr, Cu, Fe, Mn, Pb, V and Zn varied as 15.6 - 228 ng/g, 4.40 - 30.9 ng/g, 2.1 - 4.7 ng/g, 1958 - 3165 ng/g, 2378 - 5014 ng/g, 4656 - 11847 ng/g, 4.57 - 17.3 ng/g, 2.48 - 5.16 ng/g and 7510 - 20529 ng/g, respectively [20]. Lee et al. made element analysis in soils, plants and waters by using ICP-AES in Korea in 2001. In this study, concentrations of Cd, Cu, Pb and Zn for rice varied as 0.01 - 0.24 mg/kg, 1.0 - 3.0 mg/kg, 0.2 - 0.5 mg/kg and 8.4 - 18.4 mg/kg, respectively [21]. In another study in Korea, Jung et al. made element analysis in soils, plants, waters and sediments by using ICP-AES. The concentrations of element As, Sb and Bi for corn particles varied as 0.03 - 0.06 μg/g, <0.01 μg/g and 0.01 - 0.02 μg/g, respectively [22].
Statistical evaluations in Tables have been concluded by using ANOVA one way of statistical test. Meaningful values (P < 0.05 and P < 0.01 levels) have been obtained between the concentrations of element Co determined in the seeds and Na, Ca, Cu, Mn, Sn, Sr, Si, Bi and Zr concentrations by using ANOVA test. It is shown that there is a relation between the concentrations of element Co and other element concentrations.
Especially, the relation with Na is forceful (P = 0.003), is seen in Table 2.
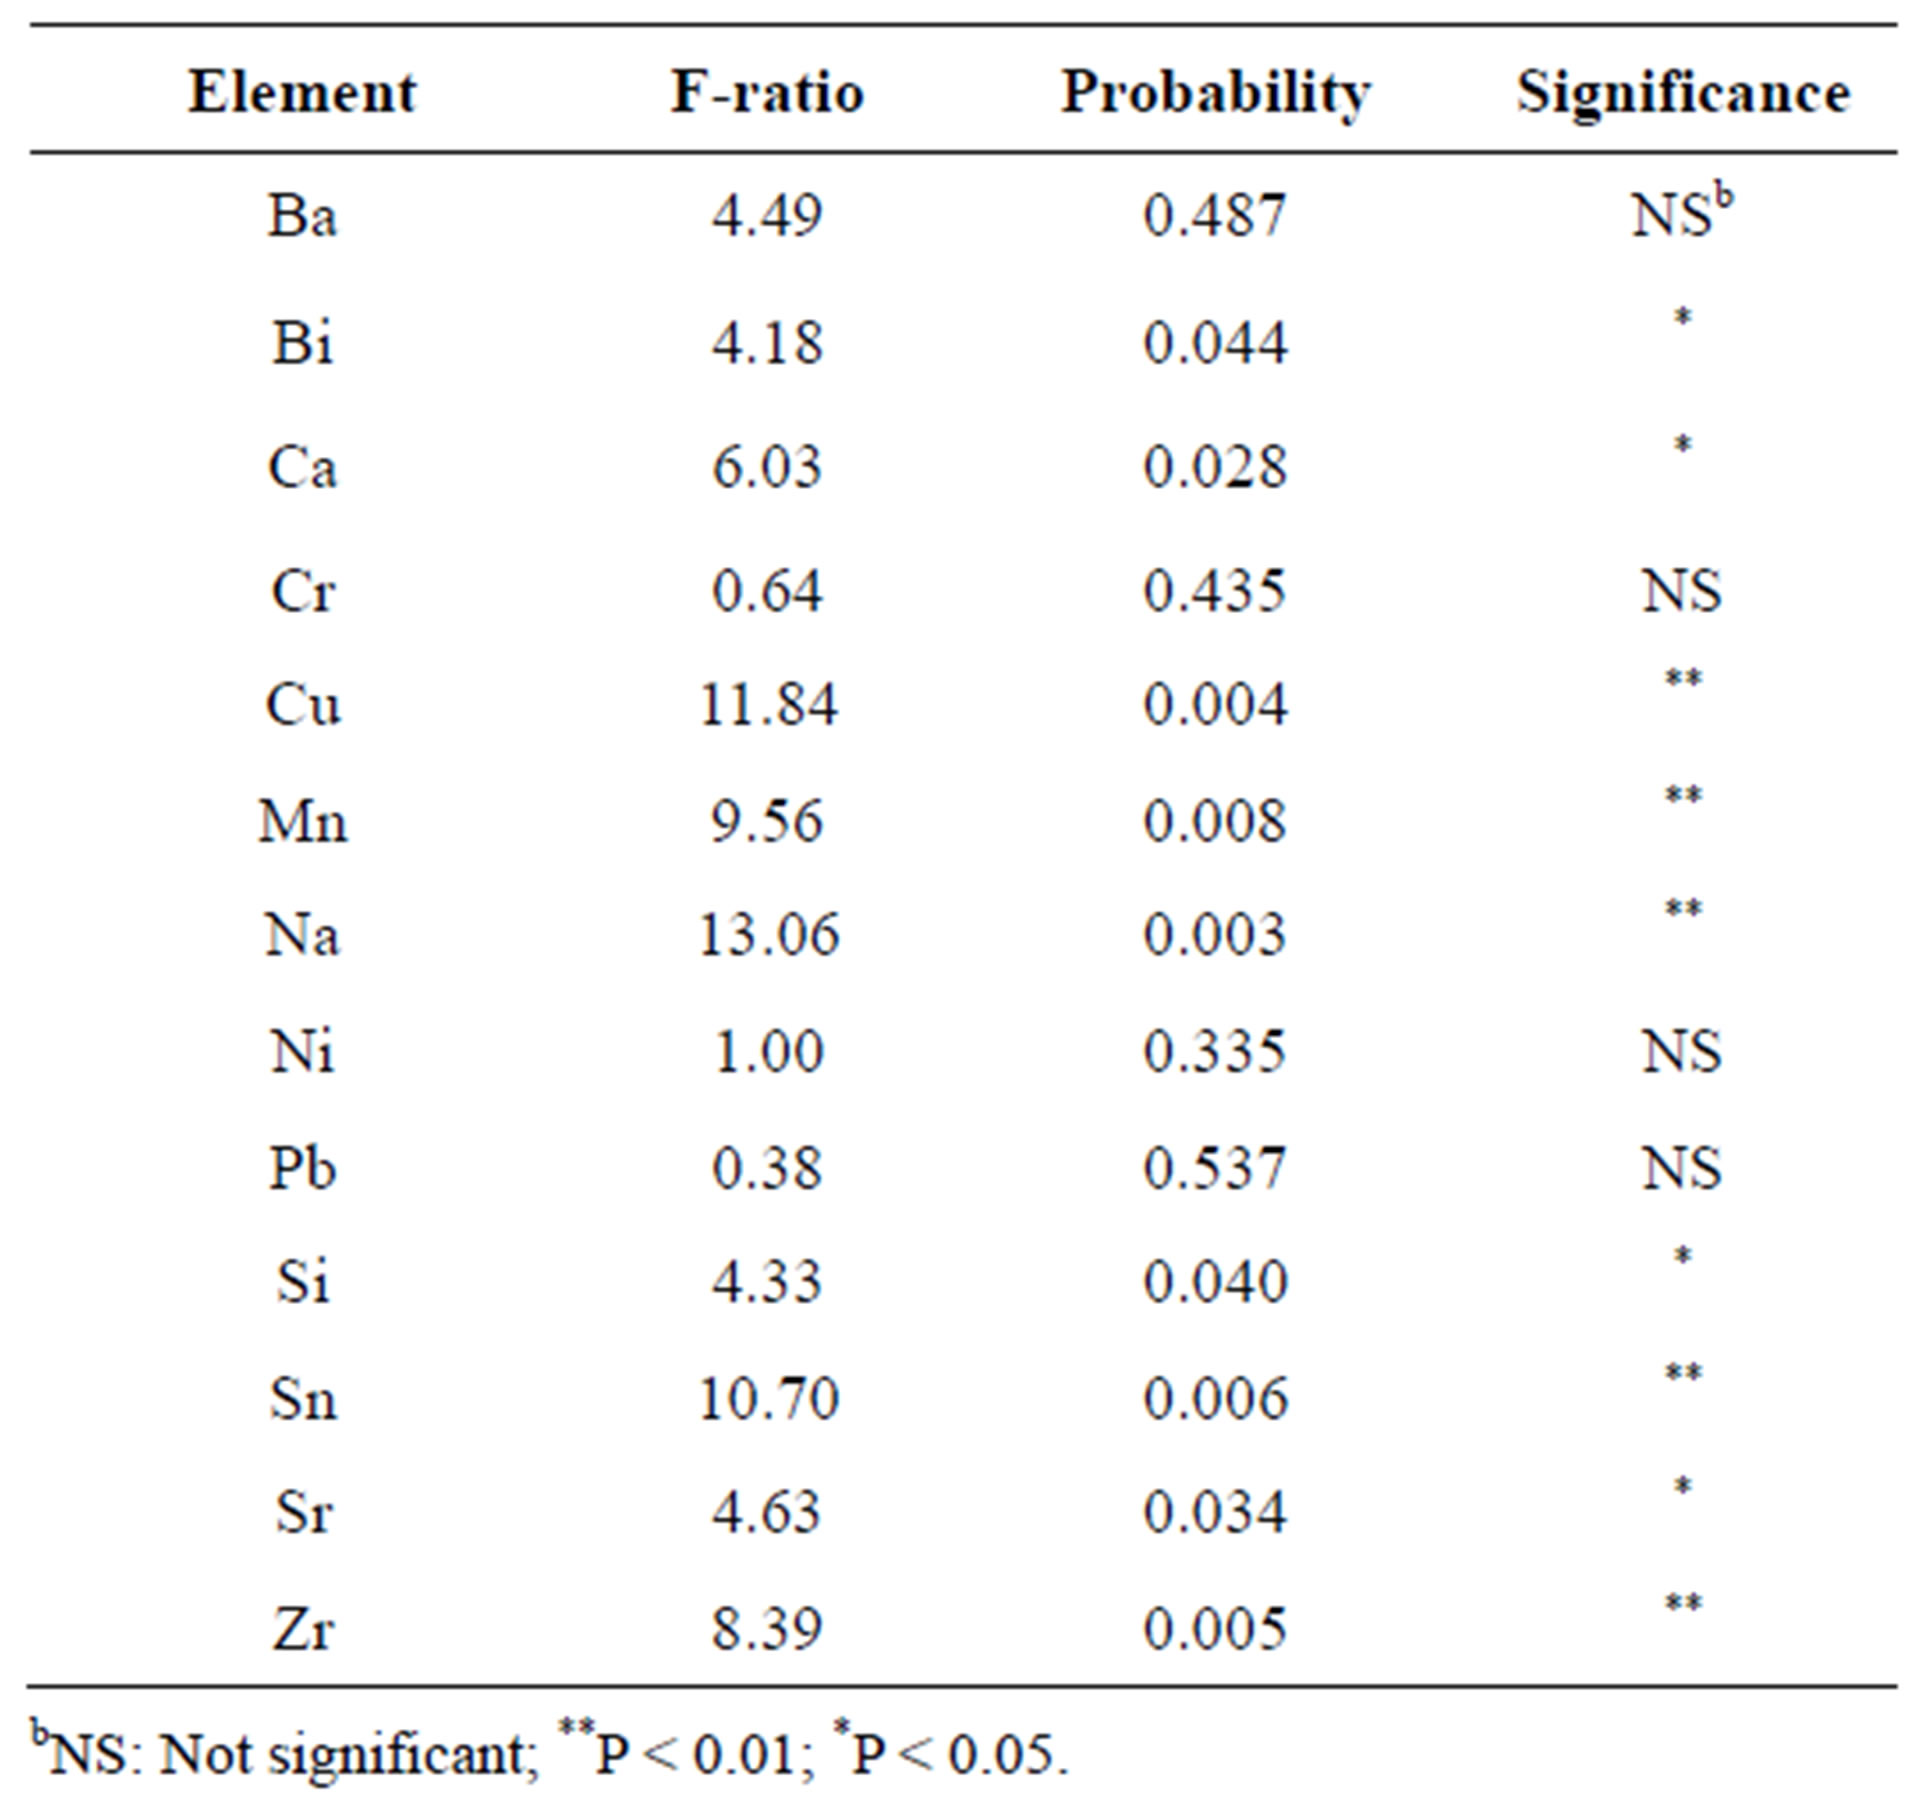
Table 2. Comparison of Co concentration with the other elements.
Na is the best element which shows forceful relations with the other element concentrations in the seeds. Meaningful values (P < 0.05 and P < 0.01 levels) have been obtained between the concentration of this element and Ca, Al, B, Ba, Cu, Mn, Ni, Zn, Cr and Sn concentrations. Significance at P < 0.05 level has been obtained between Ca concentrations and the other element concentrations except Mg.
In Table 3, Al concentrations in the seeds have got a significance with B, Ba, Ni, Zn, Cr and Sn concentrations at P < 0.01 level. This indicates that the relation among them is meaningful.
Element B has got an important correlation with Cu, Mn, Bi at P < 0.01 significance level, and also with Cr, Sr, Si, Pb, U at P < 0.05 significance level. But, B hasn’t a meaningful relation with Ba.
The concentrations of element Ba have a significant relation with Cu, Mn, U, Zr, Sr, Si and Bi concentrations (Table 4).
Element Cu in the seeds only changes with Ni, Zn, Cr and Sn. Changing of the concentration of Cu also depends on the concentrations of Co, Na, Ca, B, and Ba (Table 5).
Mn concentrations in the seeds have a correlation with the other element concentrations at P < 0.01 significance level. But, Mn isn’t have a relation with Zn and Si.
Ni concentrations have a meaningful relation with only Na, Ca, Al, Cu and Mn concentrations (Tables 3, 5). Then, it can be said that Ni concentrations show variation dependently with those element concentrations.
The concentrations of element Zn only change with concentrations of element Al, Cu, and Na, Ca, Fe, Sr (Tables 3, 5 and 6).
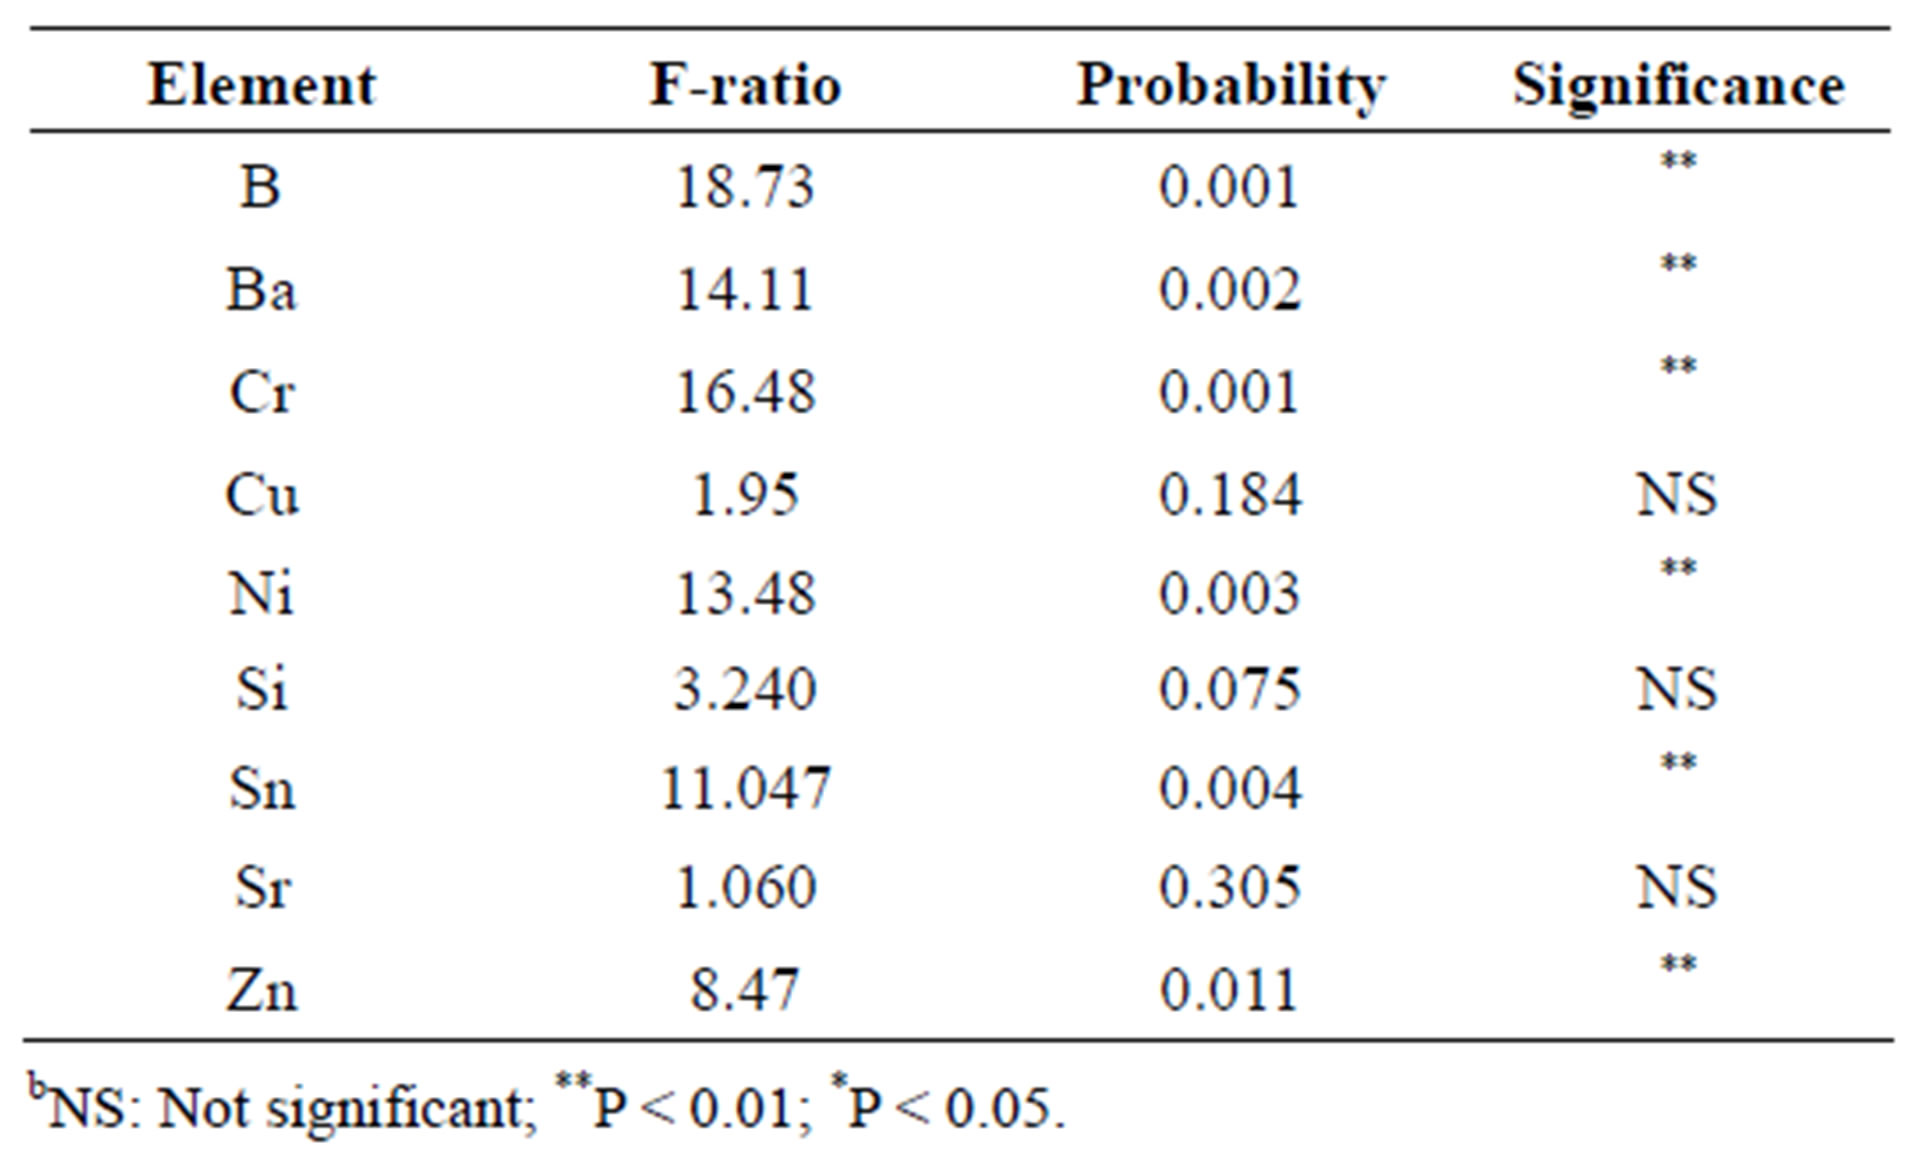
Table 3. Comparison of Al concentration with the other elements.
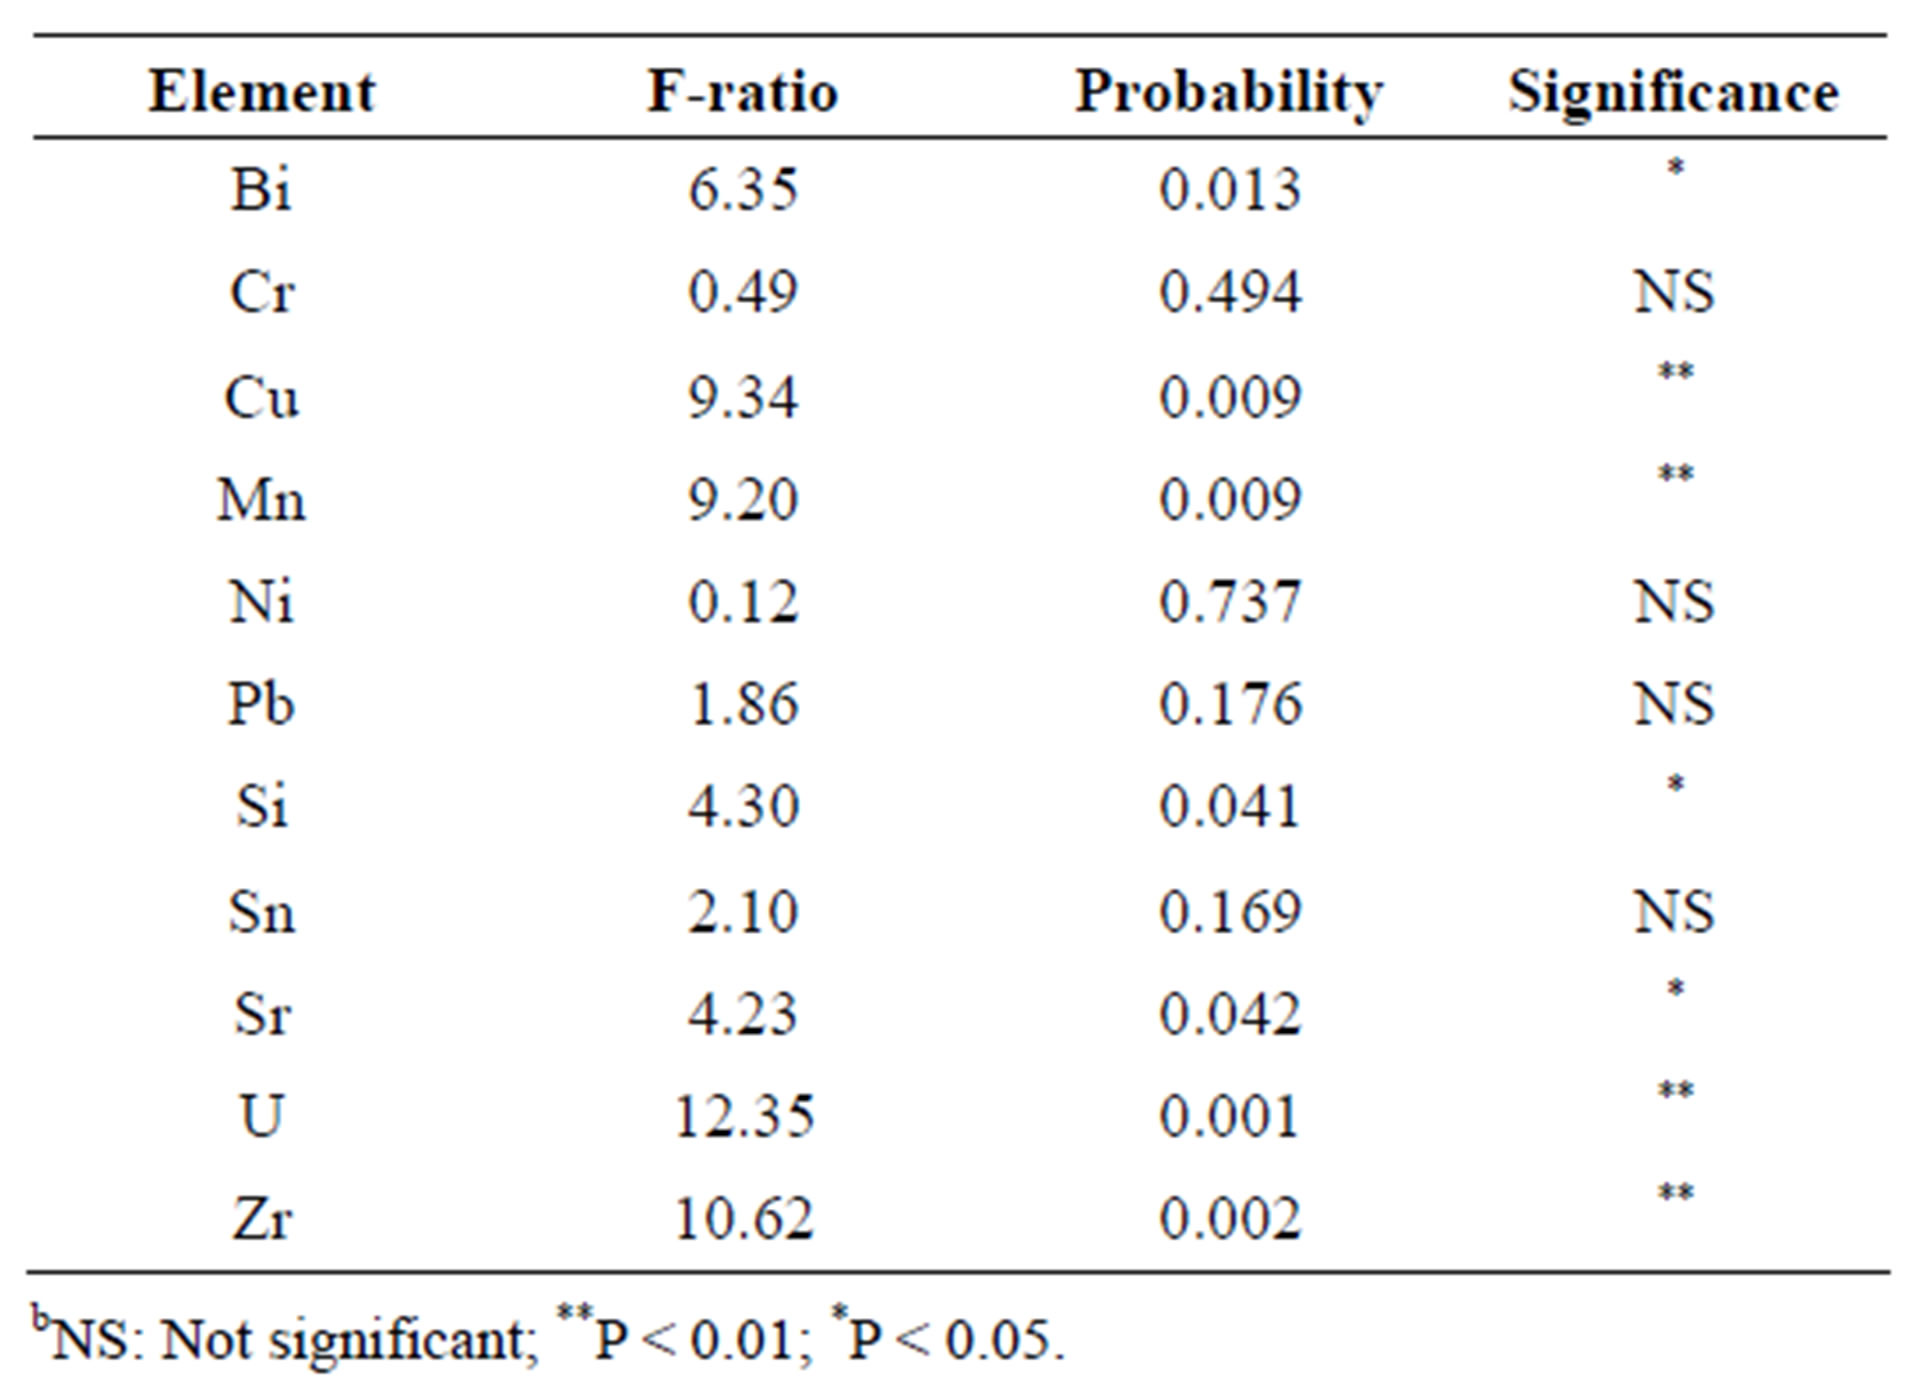
Table 4. Comparison of Ba concentration with the other elements.
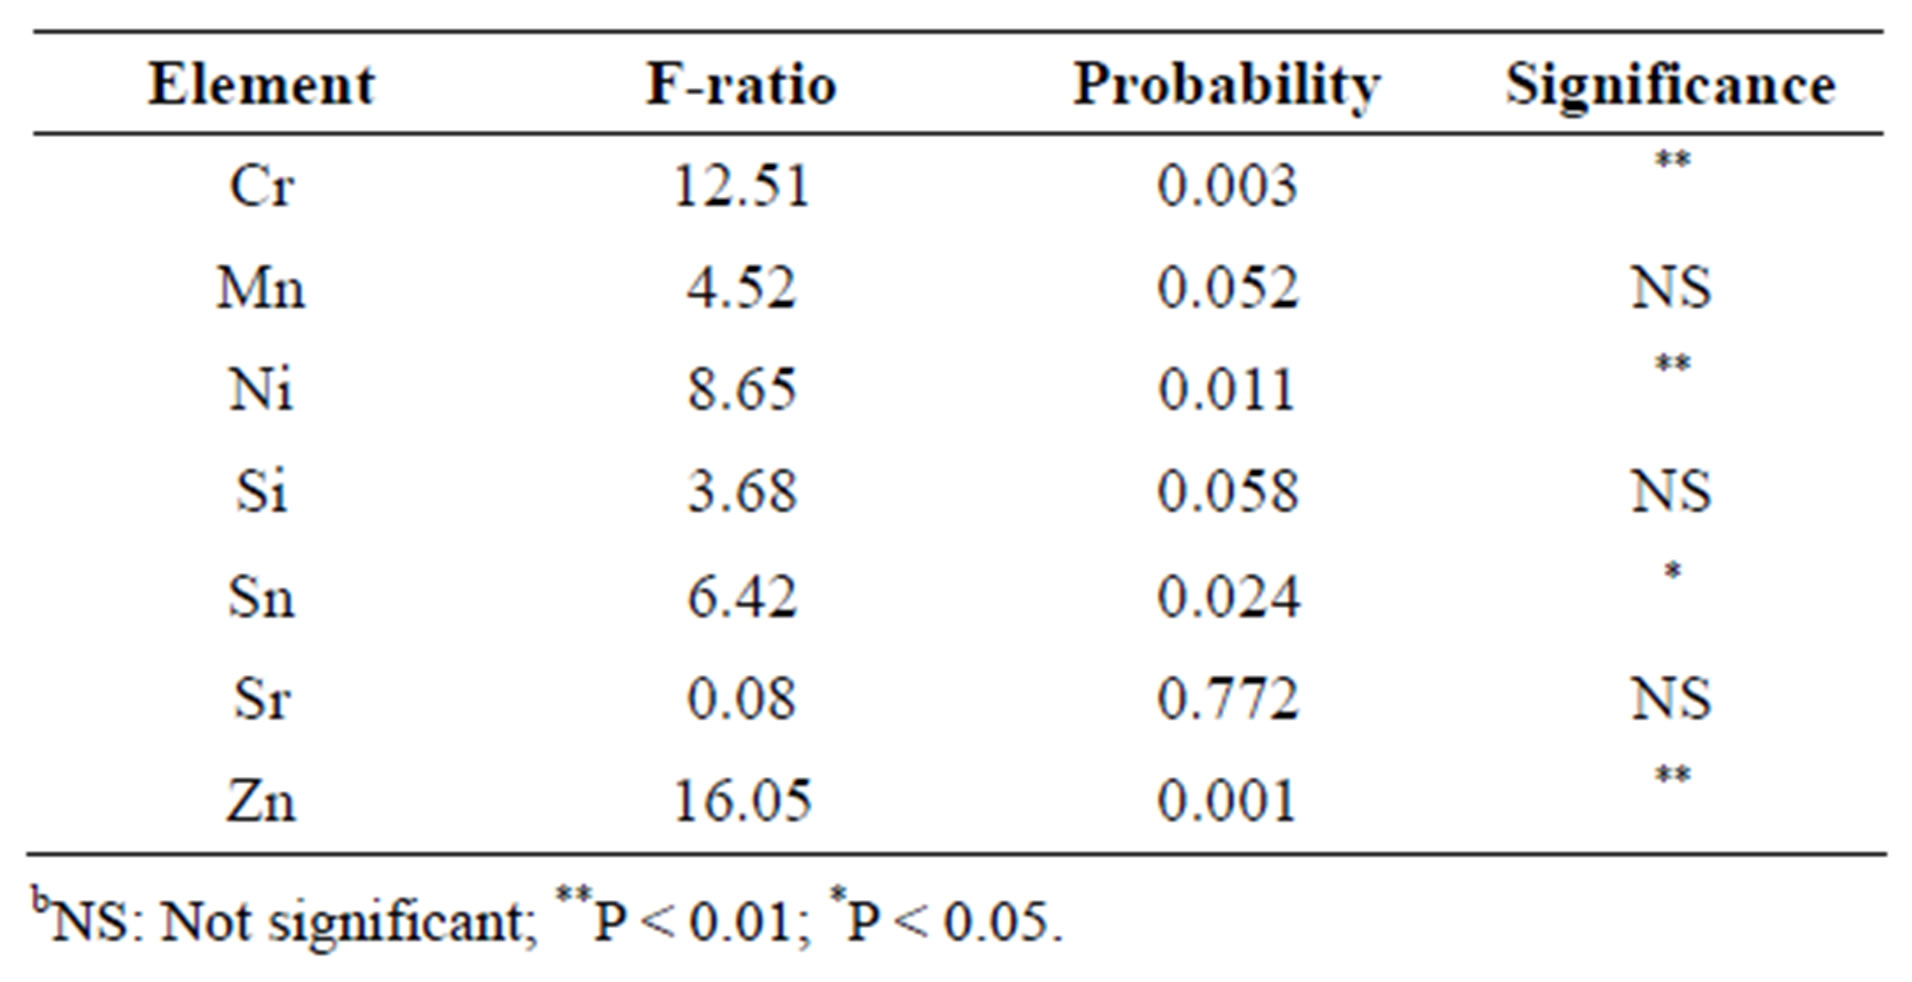
Table 5. Comparison of Cu concentration with the other elements.
Table 6. Comparison of Zn concentration with the other elements.
Element Cr has a meaningful relation only with Sn at P < 0.01 significance level.
Element Sn has a meaningful relation with Bi, U and Zr at P < 0.01 level (Table 7). Sn is also an element which is of little amount in the seeds (Table 1).
Ti, an element which is of quite little amount in the seeds has a relation with only Sr and Si at P < 0.05 level.
Fe concentrations analyzed in the plant seeds were compared with some other element results by using ANOVA test. Element Fe has a meaningful relation with only Mn, Zn and Sr at P < 0.01 significance levels (Table 8).
Element Sr is not have a meaningful relation with the other elements except Co, B, Ba, Zn, Ti and Fe, U, Zr, (Tables 2, 4, 7).
According to Table 9, element Si is not have a meaningful relation with the other elements except Co, B, Ba and Ti (Tables 2, 4).
Element Pb is not have a meaningful relation with the other elements except Mn and B. Merian (1991) pointed out that the lead concentrations are highest in the roots,
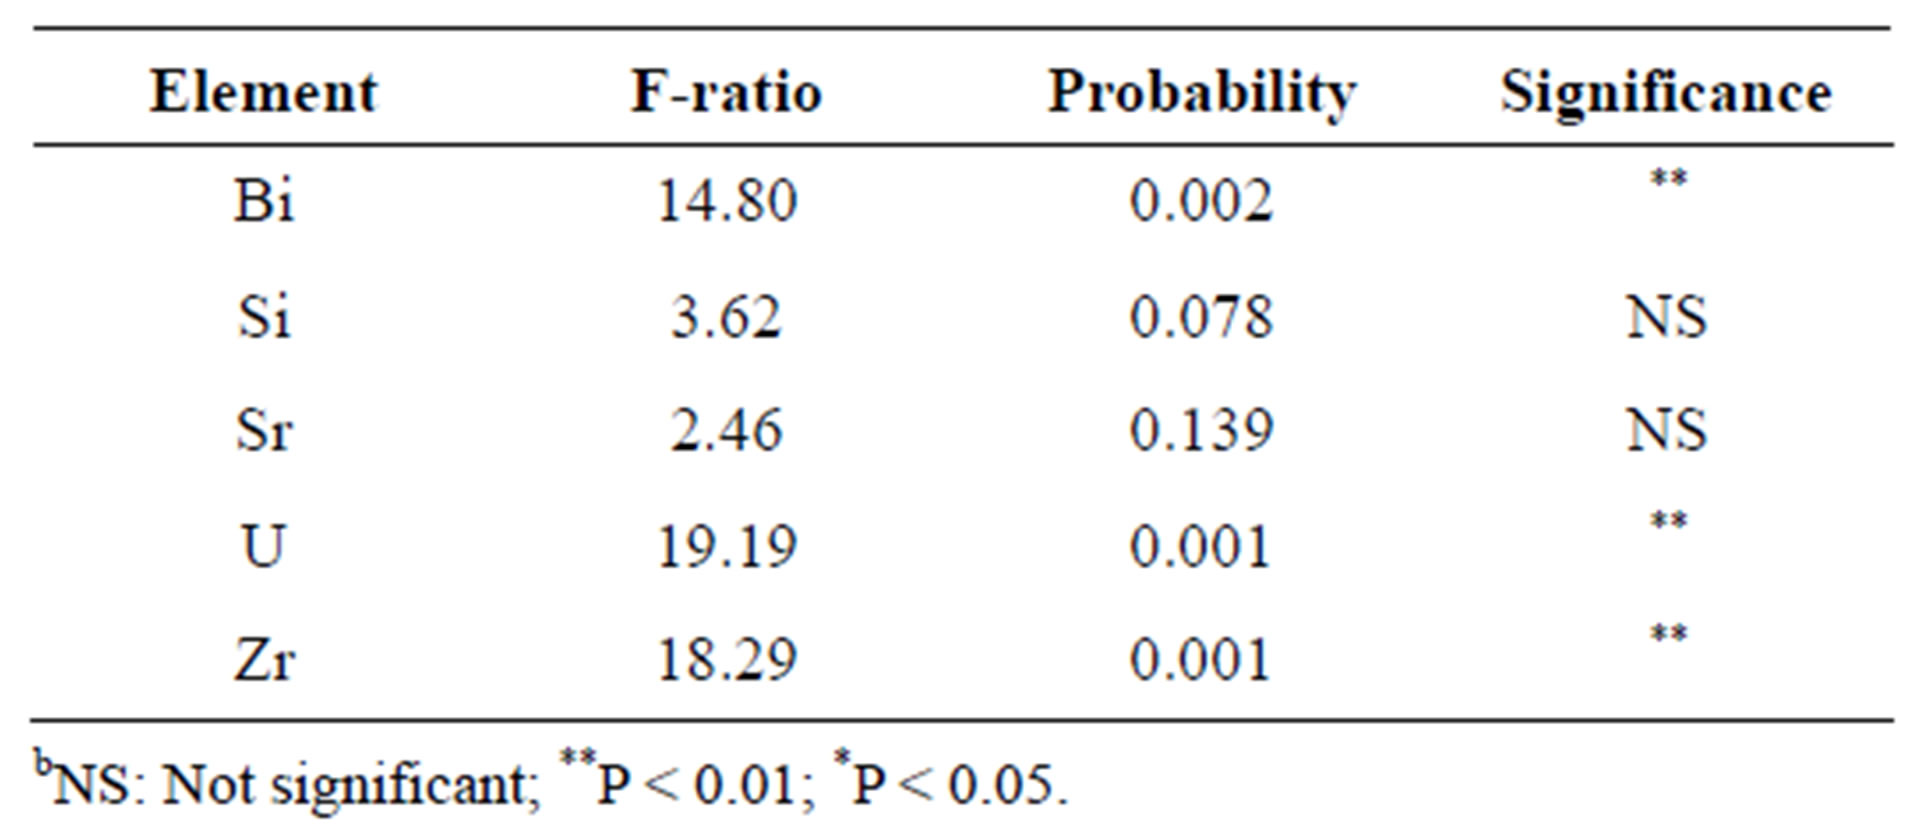
Table 7. Comparison of Sn concentration with the other elements.
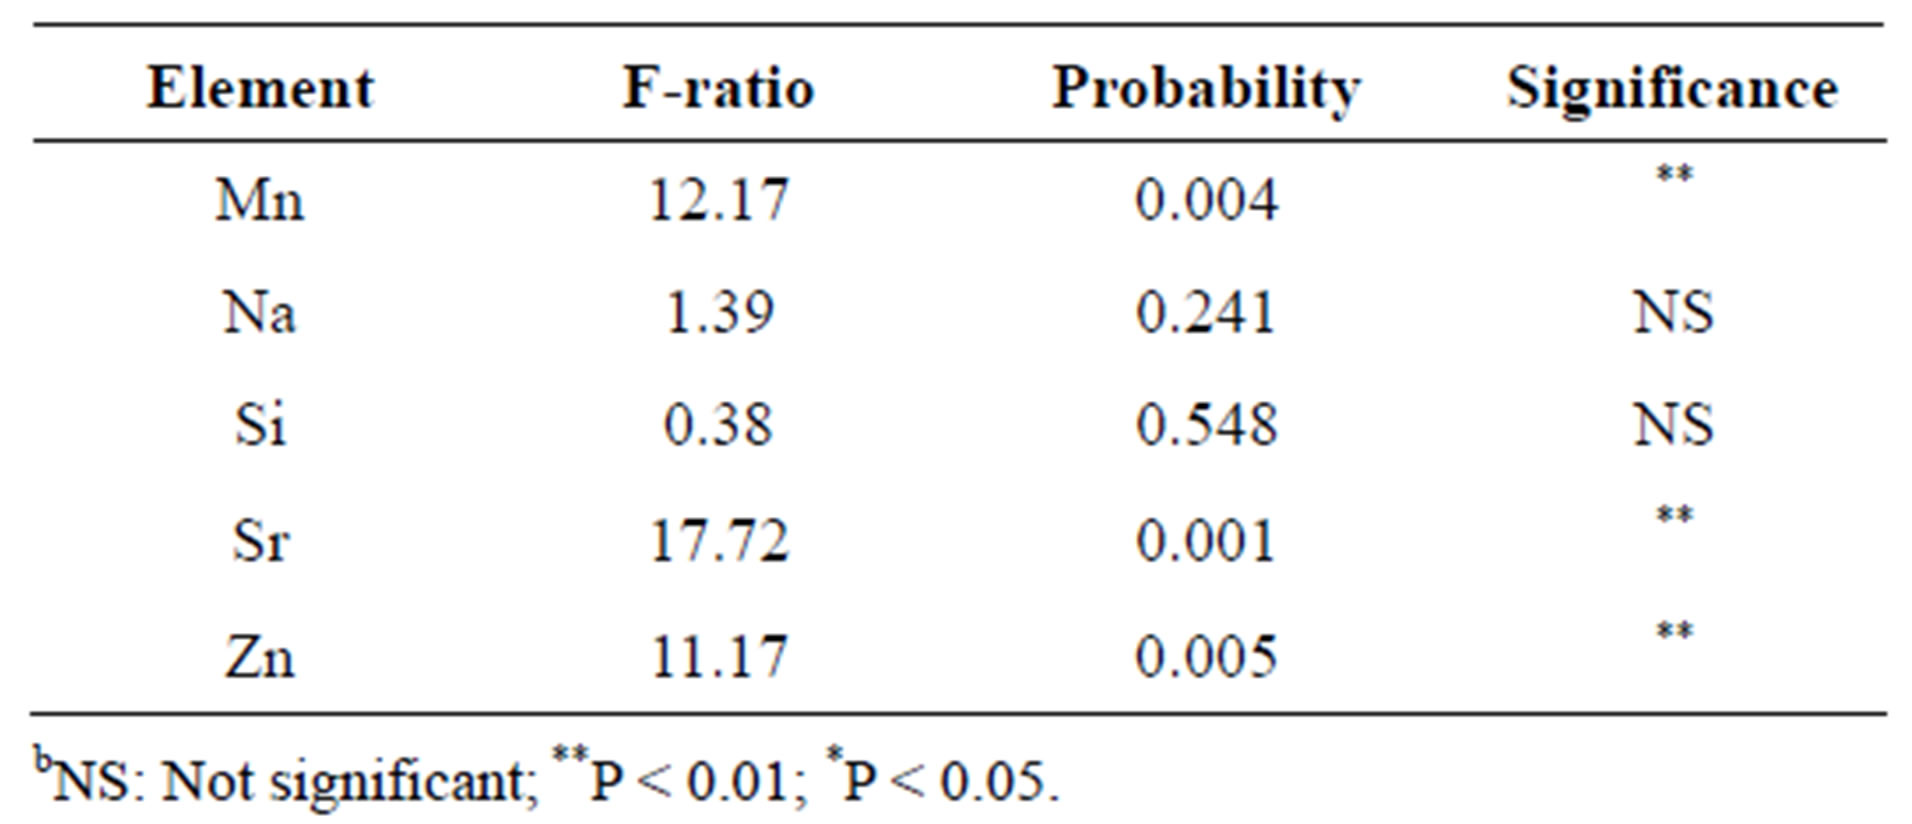
Table 8. Comparison of Fe concentration with the other elements.
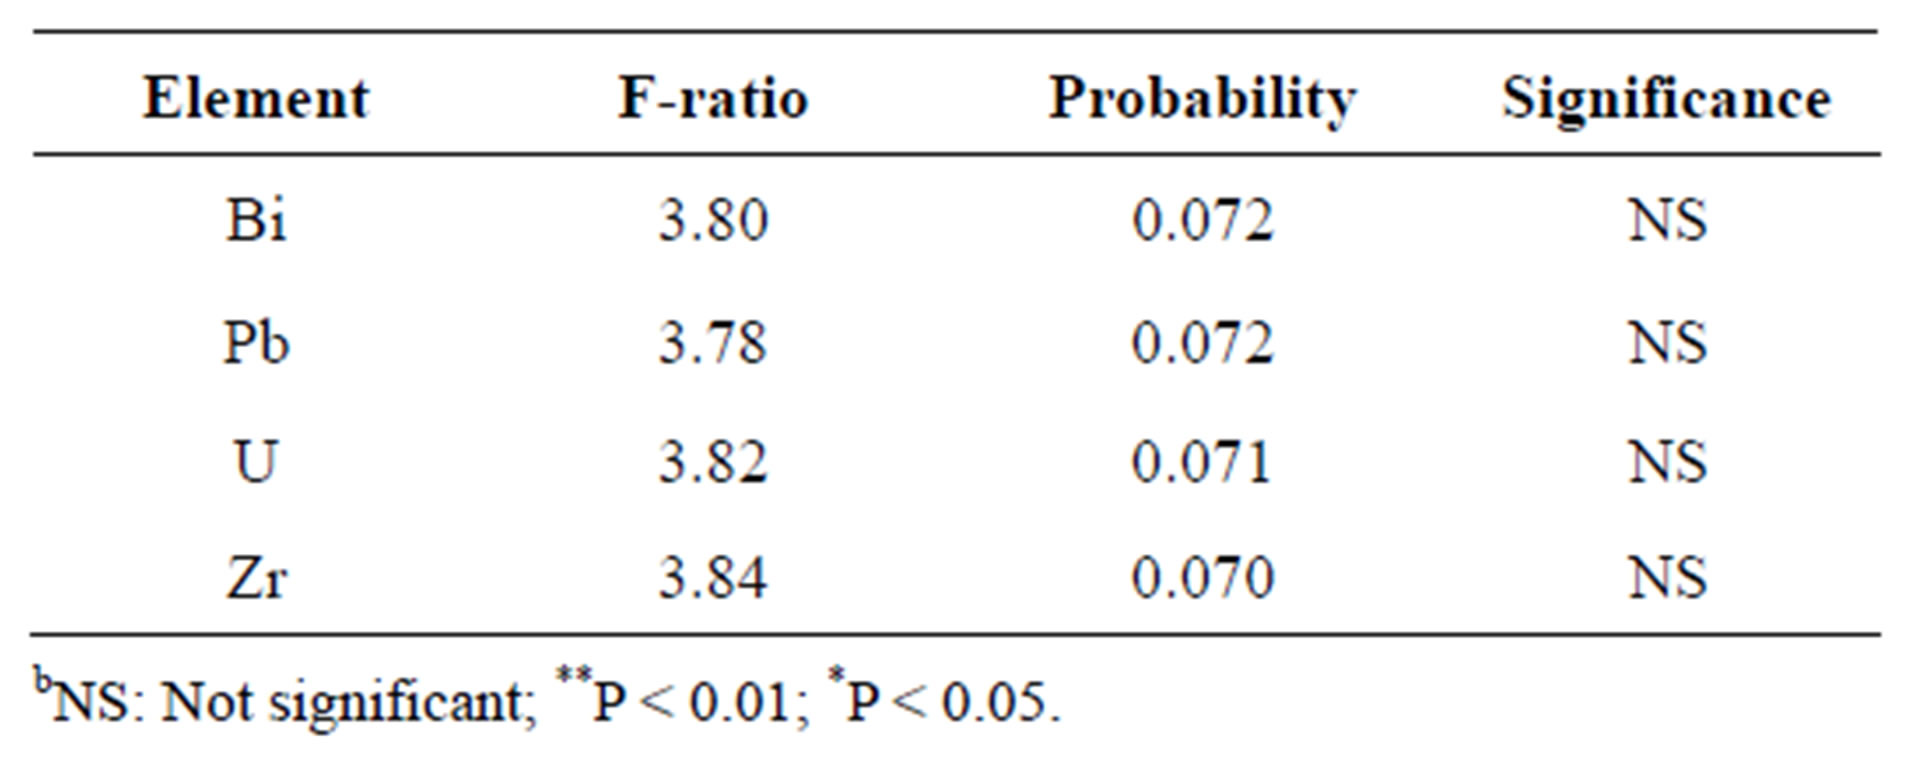
Table 9. Comparison of Si concentration with the other elements.
lower in stems and leaves, and lowest in flowers or seeds [15].
Element Bi is not have a relation with the other elements except Co, B, Ba, and Mn, Sn.
4. CONCLUSIONS
Some of the trace elements including iron, manganese, zinc and copper are essential micronutrients with a variety of biochemical functions in all living organisms. The concentrations of element Mn, Fe, Zn and Cu were measured as 16.7 mg/kg, 179.3 mg/kg, 47.7 mg/kg and 13.7 mg/kg in clover; 32.0 mg/kg, 52.7 mg/kg, 14.0 mg/kg and 4.4 mg/kg in oats; 15.7 mg/kg, 44.3 mg/kg, 12.1 mg/kg and 0.7 mg/kg in bean; 8.9 mg/kg, 76.0 mg/kg, 22.8 mg/kg and 10.3 mg/kg in green lental; 53.7 mg/kg, 107.9 mg/kg, 24.3 mg/kg and 5.3 mg/kg in spinach; 8.4 mg/kg, 158.5 mg/kg, 28.4 mg/kg and 3.0 mg/kg in corn; 7.0 mg/kg, 51.3 mg/kg, 19.7 mg/kg and 7.9 mg/kg in red lental; 7.4 mg/kg, 40.0 mg/kg, 16.7 mg/kg and 3.8 mg/kg in rice, respectively by using ICP-OES.
In present study, it seems that many elements in the seeds have meaningful relations among them at P < 0.05 and P < 0.01 significance levels. The forceful relation (P £ 0.003) between elements is found as follows: Co with Na; Al with B, Ba, Ni and Cr; Ba with U and Zr; Cu with Zn and Cr; Fe with Sr.
But element Mg in the seeds is not have any statistical relation with the other elements. According to this result, it can be said that Mg concentration indicates variation independently from the other element concentrations. Element K which is of many amount in the seeds is also independent from the other elements.
REFERENCES
- Rodrıguez, L.H., Morales, D.A., Rodrıguez, E.R. and Romero, C.D. (2011) Minerals and trace elements in a collection of wheat landraces from the Canary Islands. Journal of Food Composition and Analysis, 24, 1081- 1090. doi:10.1016/j.jfca.2011.04.016
- Korkmaz, K., Kara, S.M., Ozkutlu, F. and Gul, V. (2010) Monitoring of heavy metals and selected micronutrients in hempseeds from north-western Turkey. African Journal of Agricultural Research, 5, 463-467.
- Anke, M., Seeber, O., Müller, R., Schäfer, U. and Zerull, J. (2009) Uranium transfer in the food chain from soil to plants, animals and man. Chemie der Erde, 69, 75-90. doi:10.1016/j.chemer.2007.12.001
- Ajayi, I.A. (2008) Comparative study of the chemical composition and mineral element content of Artocarpus heterophyllus and Treculia africana seeds and seed oils. Bioresource Technology, 99, 5125-5129. doi:10.1016/j.biortech.2007.09.027
- Naozuka, J., Marana, S.R. and Oliveira, P.V. (2010) Water-soluble Cu, Fe, Mn and Zn species in nuts and seeds. Journal of Food Composition and Analysis, 23, 78-85. doi:10.1016/j.jfca.2009.08.003
- Rodushkina, I., Engström, E., Sörlinb, D. and Baxter, D. (2008) Levels of inorganic constituents in raw nuts and seeds on the Swedish market. Science of the Total Environment, 392, 290-304. doi:10.1016/j.scitotenv.2007.11.024
- Adelakun, O.E., Oyelade, O.J., Ade-Omowaye, B.I.O., Adeyemi, I.A. and Venter, M.V. (2009) Chemical composition and the antioxidative properties of Nigerian Okra seed (Abelmoschus esculentus Moench) flour. Food and Chemical Toxicology, 47, 1123-1126. doi:10.1016/j.fct.2009.01.036
- Bakoglu, A., Bagci, E. and Ciftci, H. (2009) Fatty acids, protein contents and metal composition of some feed crops from Turkey. Journal of Food Agriculture & Environment, 7, 343-346.
- Kranner, I. and Colville, L. (2011) Metals and seeds: Biochemical and molecular implications and their significance for seed germination. Environmental and Experimental Botany, 72, 93-105. doi:10.1016/j.envexpbot.2010.05.005
- Sardans, J., Montes, F. and Peñuelas, J. (2010) Determination of As, Cd, Cu, Hg and Pb in biological samples by modern electrothermal atomic absorption spectrometry. Spectrochimica Acta Part B, 65, 97-112. doi:10.1016/j.sab.2009.11.009
- Chaves, E.S., Santos, E.J., Araujo, R.G.O., Oliveira, J.V., Frescura, V.L.A. and Curtius, A.J. (2010) Metals and phosphorus determination in vegetable seeds used in the production of biodiesel by ICP OES and ICP-MS. Microchemical Journal, 96, 71-76. doi:10.1016/j.microc.2010.01.021
- Jung, M.C. and Thornton, I. (1997) Environmental contamination and seasonal variation of metal in soils, plants and waters in the paddy fields around a Pb-Zn mine in Korea. The Science of the Total Environment, 198, 105- 121. doi:10.1016/S0048-9697(97)05434-X
- Schaefer, R.L. and Anderson, R.B. (1989) The student edition of minitab and Microsta, user’s manuel. Addison Wesley Publishing Company Inc., New York.
- Takahashi, M., Nozoye, T., Kitajima, N., Fukuda, N. and Hokura, A. (2009) In vivo analysis of metal distribution and expression of metal transporters in rice seed during germination process by microarray and X-ray fluorescence imaging of Fe, Zn, Mn, and Cu. Plant and Soil, 325, 39-51. doi:10.1007/s11104-009-0045-7
- Merian, E. (1991) Metals and their compouns in the environment. VCH Pub, New York.
- Mohamed, A.E., Rashed, M.N. and Mofty, A. (2003) Assessment of essential and toxic elements in some kinds of vegetables. Ecotoxicology and Environmental Safety, 55, 251-260. doi:10.1016/S0147-6513(03)00026-5
- Koplik, R., Borkova, M., Mestek, O., Kominkova, J. and Suchanek, M. (2002) Application of size exclusion chromatography-inductively coupled plasma mass spectrometry for fractionation of element species in seeds of legumes. Journal of Chromatography B, 775, 179-187. doi:10.1016/S1570-0232(02)00296-9
- Mestek, O., Kominkova, J., Koplik, R., Borkova, M. and Suchanek, M. (2002) Quantification of copper and zinc species fractions in legume seeds extracts by SEC/ICPMS: Validation and uncertainty estimation. Talanta, 57, 1133-1142. doi:10.1016/S0039-9140(02)00151-0
- Hacıseferoğulları, H., Gezer, I., Bahtiyarca, Y. and Mengeş, H.O. (2003) Determination of some chemical and physical properties of Sakız faba bean (Vicia faba L. var. major). Journal of Food Engineering, 60, 475-479.
- D’llio, S., Alessandrelli, M., Cresti, R., Forte, G. and Caroli, S. (2002) Arsenic content of various types of rice as determined by plasma-based techniques. Microchemical Journal, 73, 195-201. doi:10.1016/S0026-265X(02)00064-4
- Lee, C.G., Chon, H.T. and Jung, M.C. (2001) Heavy metal contamination in the vicinity of the Daduk Au-AgPb-Zn mine in Korea. Applied Geochemistry, 16, 1377- 1386. doi:10.1016/S0883-2927(01)00038-5
- Jung, M.C., Thornton, I. and Chon, H. (2002) Arsenic, Sb and Bi contamination of soils, plants, waters and sediments in the vicinity of the Dalsung Cu-W mine in Korea. The Science of the Total Environment, 295, 81-89. doi:10.1016/S0048-9697(02)00042-6