Health
Vol.6 No.10(2014), Article ID:44501,4 pages DOI:10.4236/health.2014.610112
Economic Cost of Community-Based Management of Severe Acute Malnutrition in a Rural District in Ghana*
Abdul-Malik Chantimah Abdul-Latif1, Justice Nonvignon2
1District Health Directorate, Ghana Health Service, Jasikan, Ghana
2Department of Health Policy, Planning & Management, School of Public Health, University of Ghana, Legon, Ghana
Email: malik.chantimah@gmail.com, jnonvignon@ug.edu.gh
Copyright © 2014 by authors and Scientific Research Publishing Inc.
This work is licensed under the Creative Commons Attribution International License (CC BY).
http://creativecommons.org/licenses/by/4.0/


Received 24 February 2014; revised 26 March 2014; accepted 2 April 2014
ABSTRACT
Background: The community based management of severe acute malnutrition (CMAM) was introduced in Ghana in 2008 to manage cases of severe acute malnutrition (SAM) recorded at the community level. This study estimated the economic cost of the CMAM programme for children under-five in the Agona west municipality of Ghana. Methods: A retrospective cross sectional study that used a cost analysis design was employed to estimate the economic cost of the programme from the societal perspective. Household cost data from caregivers were obtained using a semi-structured questionnaire. That of programme cost data was obtained from document reviews as well as the use of semi-structured questionnaires and subsequent discussions with key personnel of the Ghana Health Service, Food and Nutrition Technical Assistance and UNICEF. One and multi-way sensitivity analyses were conducted to test how sensitive the cost estimates are to certain variations in the cost profiles. Results: The economic household cost of CMAM was estimated as $1905.32 ($47.63 per household) of which 79% was attributed to direct cost while the remaining 21% made up indirect cost. Programme economic cost of CMAM was estimated as $27633.5 (96% recurrent and 4% capital), with refresher training constituting majority of the cost (34%). The constituents of the total economic cost of the programme, estimated as $32214.56 are programme cost (86%), household costs (6%) and community volunteer cost (8%). Therefore, the economic cost of treating one SAM case using the CMAM protocol was estimated as $805.36. Conclusion: Although CMAM has proven to be an effective tool for the management of SAM, its associated costs are quite enormous when coverage levels (geographic) are high yet small number of cases are detected and treated. Therefore, it is prudent to implement several cost saving strategies such as a reduction in the number of days spent on trainings in order to reduce these costs.
Keywords:Severe Acute Malnutrition, Community-Based Management of Acute Malnutrition, Economic Cost, Ghana, Nutrition, Children under Five

1. Introduction
Severe acute malnutrition (SAM) is a major public health problem facing most developing countries in Africa, Asia, Latin America and the Caribbean [1] . It mostly affects children and has serious adverse effects on them physically, socially and psychologically, diminishing their quality of life and the prospects for social progress. Malnourished children are highly susceptible to acute morbidity and mortality. They also have decreased cognitive development and are likely to affect the child’s economic productivity and susceptibility to chronic infections later in life [2] .
Governments all over the world, especially in developing countries have undertaken programmes to address SAM and other pressing health problems in a bid to improve the quality of life of children. Despite these efforts, SAM still contributes to about 1 million child deaths every year [3] .
Sever Acute Malnutrition is defined as the presence of bilateral edema, or a weight to height ratio at least three standard deviations below the median according to WHO growth standards, or a mid-upper arm circumference less than 115 mm [4] . Severe acute malnutrition is caused by a reduction in food intake as a result of food crises or armed conflict. The situation is further compounded by infections which make SAM even worse, leading to a high risk of mortality if not appropriately treated urgently. About 20 million children worldwide were estimated to have suffered from severe acute malnutrition in 2010 and this leaves them more vulnerable to serious illness and death. Globally, an estimated 171 million children below five years of age were stunted in 2010, and 104 million were underweight. In 2011, about 6.9 million children under the age of five died and about one third of these deaths are linked to malnutrition [5] . A malnourished child is nine times more likely to die than a child who is not wasted and therefore acute malnutrition is believed to constitute not less than 4.4% of the under five mortality burden globally and 6.0% loss of disability-adjusted life years (DALYs) among children under five [6] .
The community based management of acute malnutrition (CMAM) programme was introduced in 2007 by the WHO and UNICEF to manage cases of severe malnutrition recorded at the community level [4] . These UN agencies conceded that the treatment of SAM cases was restricted to health facilities and this had a major limitation on its coverage and access. They therefore approved the CMAM initiative with the position that large numbers of children with SAM can be treated in their communities without being admitted to a therapeutic feeding centre or health facility [7] .
The CMAM protocol is an innovative community-led public health intervention model that is used by many countries and agencies to manage severe acute malnutrition cases. It uses a case-finding approach to provide nutrition and medical care to severely malnourished children, according to their individual needs. The approach makes use of community volunteers who are equipped with the necessary skills to detect “suspected” malnourished children in communities using simple coloured paper strips to measure mid-upper arm circumference [4] . They are then referred to the community centres for further screening and those diagnosed of malnutrition are fed with Ready-to-Use-Therapeutic Foods (RUTF) which are nutrient dense rations that require no preparation and are palatable to young children [7] .
Several countries like Ethiopia [7] , Malawi [9] , Zambia [10] , Bangladesh [11] and Indonesia [12] have also adopted this program to manage and control malnutrition problems in their respective countries. Under the CMAM programme, malnourished children are mostly treated as outpatients while a few cases with complications are admitted and treated at the inpatient care. Various other interventions designed to reduce the incidence of malnutrition as well as improve food availability and access, are incorporated into the CMAM model [13] .
After five years of the implementation of the programme in Ghana, there is paucity of information to ascertain the economic cost of the treatment of a malnourished child using the CMAM protocol. Cost is a major obstacle to scaling up health interventions in developing countries [14] and therefore it is important to provide information on the cost of CMAM to guide policy makers. This is because resources allocated for health interventions, like any other resources, are scarce and must be utilised efficiently to achieve its targeted goals [15] .
The findings of a comparative study by Ashworth and Khanum [16] on three delivery systems on the management of severely malnourished children: inpatient care, day care and domiciliary rehabilitation care, reveal the most cost effective intervention to be domiciliary rehabilitation care ($38.8). The average cost of CMAM as presented by Puett [11] is $165 and that of Tekeste [7] and Purwestri [12] are $134.9 and $331.8 respectively. Though these studies considered costs from the societal perspective, they employed different CMAM delivery models and therefore there is the need to better understand these costs [11] . It is important to note that all the studies reviewed considered large number of cases that were in the hundreds. This is the first study that has examined the cost of CMAM in the context of higher geographic coverage but low case presentation. Therefore there is the need to provide evidence on the influence of low case presentation on the average cost per case treated on the CMAM programme. This study aimed to contribute to knowledge concerning the resource requirements for CMAM that can be used as a persuasive tool in advocacy efforts to get more support for the CMAM programme. Specifically, the objective of this study was to estimate the total cost of CMAM as well as the unit cost of treating a SAM case using the CMAM protocol.
2. Methods
2.1. Description of the Intervention
In the GHS/UNICEF/FANTA led CMAM programme in some districts in Ghana (Saboba, Tolon, East Gonja, Tatale, Karaga etc.), mothers of SAM cases are given vitamin A supplements and de-wormers in addition to the distribution of RUTF. These “secondary drugs” promote speedy recovery from malnutrition and infections. About 20% of children with SAM have symptoms of malaria and approximately 35% of those in the inpatient care are dehydrated upon admission. The Ghana standard treatment guideline recommends that all cases reported at the treatment centre must be tested for malaria using the rapid diagnostic test kit, before the commencement of treatment. Artemisinin-Based Combination Therapy (ACT) is the standard protocol for treating malaria [8] .
A severely malnourished child under CMAM treatment, on average recovers after eight (8) weeks even though some can extend as far as sixteen (16) weeks. During this period, the malnourished child undergoes an appetite test. In addition, their weight and mid-upper arm circumference are also monitored in order to track the progress of their recovery [8] . The success stories during the piloting phase of the programme have led to a general scale up in the country.
2.2. Study Design
The study was a retrospective cross sectional study of reported cases of SAM in the Agona west municipality of Ghana. A cost analysis design was used to estimate the economic cost of the CMAM programme from the societal perspective, and this covered both direct and indirect costs.
2.3. Study Location
The Agona west municipality is bounded in the north by Agona East district, in the West by Asikuma-OdobenBrakwa District, in the East by Affutu-Senya District and South by Gomoa East District. The municipality has a population of 132,161 as at 2012 and has an estimated annual growth rate of 2.8%. It consists of five sub municipals—Swedru sub-municipal, Nyakrom sub-municipal, Abodom sub-municipal, Bobikuma sub-municipal and Nkum sub-municipal.
Children under five years account for about 15.3% of the total population of the Agona west municipality. The municipality has one municipal hospital, one mission hospital, three private hospitals, four Government health centres (Nkum, Abodom, Bobikuma and Nyakrom), three maternity homes, seven functional CHPS zones and one private laboratory.
2.4. Study Population
The study population included SAM children between 6 - 59 months in the Agona west municipality of the central region of Ghana.
2.5. Sampling and Sample Size
Reported cases of SAM in the Agona west municipality have been fluctuating for the past five years. From 72 cases reported in 2008, the number of cases did not change much in 2009 (71). In 2010, 40 cases were reported which then short up to 45 cases in 2011 and then to 40 cases in 2012.
The absence of a sampling frame made it impossible to use a probability sampling technique and therefore, a purposive sampling procedure was employed to elicit the necessary information from the care givers of children who were beneficiaries of the CMAM programme in 2012. Epi Info version 7.0 was used to calculate the sample size using the following parameters: Population size of 40, response rate of 93%, confidence limit of 5% and a design effect of 1. This gave a sample size of 29, which was then used accordingly.
2.6. Data Collection Methods and Tools
2.6.1. Caregivers
Semi-structured questionnaires were employed to collect cost data attributable to care givers and the programme managers. The main items of the semi-structured questionnaire included: Questions to assist in estimating the direct cost (cost of food, transport, drugs etc.) and indirect cost (commuting, waiting and treatment time etc.) from the caregiver’s perspective. It also included questions to collect data on capital and recurrent cost from the perspective of programme managers (GHS/UNICEF/FANTA). Caregivers were asked to recall all costs they incurred while on treatment in 2012. The associated costs ranged from cost of transportation to and from the treatment site, money spent on food while waiting for treatment and the cost of preparing special foods for their children to facilitate their recovery from SAM. The rest of the costs were: the direct cost of employing someone to take care of whatever the caregivers would have been doing whiles seeking care at the treatment site and the indirect cost of the productive time lost as a result of seeking care for their SAM children. This information was then used for the cost estimation.
2.6.2. Programme Data
Regarding the estimation of costs from the perspective of health services, heads and key staff of the various agencies (GHS, FANTA and UNICEF) involved in the implementation of the CMAM programme were given self-administered short questionnaires and later interviewed to get more insights into the contribution they each made in support of the programme. Costs data were collected through six semi-structured discussions with some administrative and technical staff of these institutions. Nine front line implementers of the programme at the various treatment sites-community health nurses (CHNs), were also interviewed to ascertain the proper allocation of their time for the implementation, monitoring and overseeing the treatment of SAM cases [9] .
2.7. Data Analysis
Activity-based cost analysis was used in this study, taking into consideration all the components of the cost design that sum up to the total cost of the programme. The focus of the analysis was on the total cost associated with the addition of the CMAM programme to the existing nutrition programmes of the GHS [11] . Demographic data of care givers and their SAM children was analysed using STATA version 11.0 and all costs data was estimated and analysed using Microsoft Office Excel 2007. Statistical analysis (t-test) was conducted to determine the strength of the mean difference that exists between the age groups of SAM children in terms of total direct household cost and total indirect household cost. The same was also done for the sex of SAM children. Correlation analysis (Pearson correlation) was also performed to determine the relationship that exists between the total direct household cost and the total indirect household cost.
The cost of all activities or proportion of activities (societal perspective) that were specifically relevant to the objectives of this study was considered. Programme cost of CMAM included the cost incurred by all the organisations involved in the programme, while the caregiver/household cost were the expenses borne by the community as a result of their participation in the programme [12] . Details of all capital and recurrent costs of CMAM are shown in Table 1.
Though a sample of 29 caregivers was interviewed, the results were applied to the entire number of cases that were treated in 2012 (40). Firstly, the total household cost was estimated and then divided by 29 to get the unit cost per household. The unit cost per household was then multiplied by 40 to get the total household cost representative of the 40 cases that were treated in 2012.

Table 1. Capital and recurrent costs and their dependent and independent variables.
2.7.1. Cost Centres of the Study
As shown in Table 2, detailed cost centres for the allocation of cost, were arrived at after consultation with some staff and programme managers. Efforts were made to make them so comprehensive in order to minimise double consideration of resources spent on the programme. All relevant costs incurred by the CMAM implementing agencies were calculated separately and included in the analysis. Cost centres were expressed as percentages of the overall cost of the entire programme.
2.7.2. Programme Cost Measurement
CMAM costs from January 2012 to December 2012 included those budgeted for by the Ghana Health Service (GHS), and those incurred by USAID/FANTA and UNICEF through their financial accounting system. All the cost involved in the program were estimated in cedis to get the total cost and then converted into US $ dollar using the average 2012 Ghana Cedi—US $ rate of 1.88:1.00.
1) Direct costs: This was sub divided into recurrent and capital cost. The list of all resources that were used during the programme was quantified from stock records. Capital items were annualized over a three or five year period to determine the cost of using them. Vehicles were annualised over five years, laptops (3 years), while desktop computers, printers, photocopiers and salter scales were annualised over a 4 year period, all at a discount rate of 3% [17] .
2) Shared recurrent cost: Allocation of cost based on time was used in this case. Staff time, proportion of days for which vehicle, computers, printers, and photocopiers were used for the CMAM programme was considered. Recurrent transport costs for CMAM activities which used shared vehicles, was calculated based on logs recording. In cases where direct economic costs were difficult to estimate, financial costs were employed to estimate the actual economic cost.
Some specific costs that were incurred at different time periods were adjusted to reflect their current value. This included items that were stated in the financial documents but whose costs were not quantified [7] . In the case of buildings used for the programme, their market rental rates were estimated and used in the analysis [18] . The cost of RUTF usage for 2012, which covered the cost of purchase, transportation cost to the study site and the cost of storage, were all factored into the calculation. Summation of capital and recurrent costs of all the agencies involved in the CMAM programme for 2012 was done to obtain total programme cost.
2.7.3. Household Cost
The household costs were separated into direct and indirect costs, which were summed up to obtain the total household costs. All the direct cost of seeking care for SAM children, borne by caregivers was estimated.
The indirect cost constituted the value of productive time lost (commuting, waiting and treatment) due to caregivers’ participation in the CMAM programme was also analysed using the local daily wage rate [18] . Even though caregivers benefitted from the programme through the improvement in the nutritional status of their children, they lost the opportunity to earn money on days they came for treatment at the facilities.
2.7.4. Indirect Costs to Community Volunteers
The indirect cost of CMAM to community volunteers was also estimated. They were very difficult to find and
Table 2. Description of cost centres and data sources.
[11] .
interviewed due to the nature of their professions and for that matter, a conscious effort was made to interview one of them, after which the total time spent on the CMAM programme was determined. This information was then used to estimate the indirect cost incurred by all volunteers on the CMAM intervention, using Ghana’s daily minimum wage rate.
2.7.5. Sensitivity Analysis
First, one way sensitivity test was conducted using the following parameters: A change of the discount rate from 3% to 5%, a change in the estimated useful life of vehicles from 5 years to 8 years and also the use of the national daily minimum wage rate instead of the local daily wage rate. Next, a multi-way sensitivity test was conducted using the following scenarios as shown in Table 3.
2.7.6. Testing Relationships between Variables
Statistical test (t-test) was performed to determine the strength of the mean difference that exist between the age groups of SAM children in terms of total direct and total indirect household cost. The same was done for the sex of SAM children. Pearson correlation analysis was also done to test the type and strength of the relationship that exist between the total direct and total indirect household cost.
2.8. Ethical Considerations
The study received ethical approval from the Ethics Committee of the Ghana Health Service. The consent of FANTA and the District Health Management Team of the Agona West municipality were also sought for approval before conducting this study. Caregivers also gave their voluntary consent to be involved in the study.
3. Results
About 41% of caregivers were Junior High School leavers, whiles 3% of them had completed tertiary education. About 80% of the SAM children who benefitted from the programme in 2012 were between 0 - 23 months of age, and about 20% of them were between the ages of 24 - 59 months. The average household monthly income was estimated as $129.84.
3.1. Programme Cost of CMAM
The estimated total financial cost of the CMAM programme for 2012 was US $21158.73. Recurrent cost accounted for about 95% of this cost, with the remaining 5% constituting capital costs. It is important to note that this financial cost represented only direct costs. The estimated total economic cost of the programme was US $27633.50. As shown in Figure 1, recurrent and capital costs respectively accounted for 96% and 4% of the total economic cost of CMAM. Table 4 shows the various constituents of the programme cost of CMAM: refresher training (33.5%), vehicle operation (8.1%), personnel cost (23.3%), monitoring (13.8%), building rental (4.0%) and RUTF (12.6%).
3.2. Total Household Cost
Table 5 shows that about 78.6% household cost was direct cost and the remaining 21.4% was the indirect cost of CMAM (shown in Figure 2). Over 33% of household costs constituted value for work done for caregivers (the cost of engaging people to take care of some activities whiles seeking care) and about 30% constituted the cost of preparing special food for SAM cases to facilitate their speedy recovery. The rest were: productivity loss (21.4%), transportation cost (4.8%), and cost of food for caregivers (6.4%).
Table 3. Parameters used in the multi-way sensitivity analysis.
Table 4. Programme cost of CMAM in the Agona West Municipality.
Table 5. Household cost (economic) of CMAM.
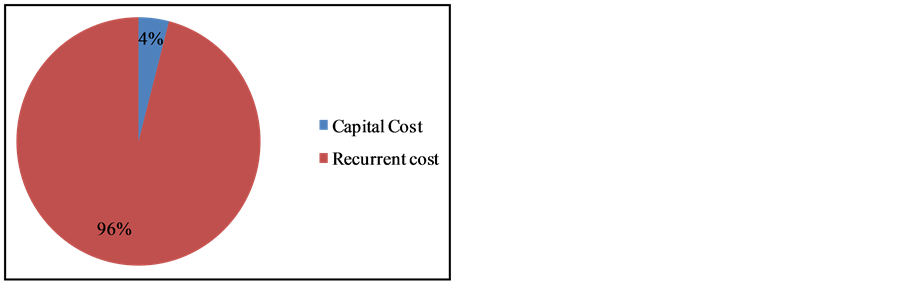
Figure 1. Total programme economic cost.
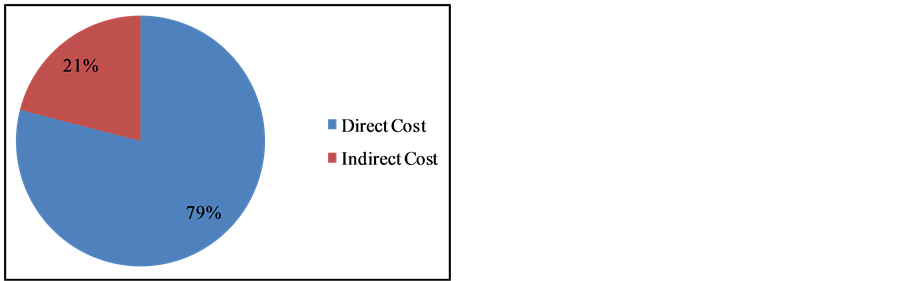
Figure 2. Economic (household) cost of CMAM.
The estimated total household cost (economic) of the intervention was US $1905.32 (for all the 40 cases treated in 2012) and this brought the average household economic cost to US $47.63. CMAM cost to community volunteers was also estimated as US $2675.75 (Table 6).
Table 7 shows the results of a t-test that was performed to determine the strength of the mean difference that exist between age groups of SAM children in terms of total direct and indirect cost. The mean difference of the total direct cost between the ages 0 - 23 months and 24 - 59 months was recorded as US $12.47 and this is significant: P-value of 0.04 (<0.05). However, the mean difference of the total indirect cost (US $−0.71) between the two age groups is insignificant (P-value of 0.81). In terms of the sex of the SAM children, the mean difference of the total direct cost between males and females was recorded as US $−5.55, with a P-value of 0.05, which is not significant. That for total indirect cost was recorded as US $−0.17, which is also not significant (P-value of 0.94).
Table 6. Indirect cost of CMAM to community volunteers.
Table 7. Results of t-test between direct and indirect household cost in terms of age and sex.
*DMW: Daily minimum wage.
Table 8 shows 0.58 as the Pearson correlation coefficient that exists between the total direct household cost and the total indirect household cost. This figure shows that there is a very strong positive relationship between these costs and this means that, the total direct household cost increases with an increase in the indirect cost and vice versa.
3.3. Total Economic Cost of CMAM
The estimated total financial and economic cost of the CMAM intervention in the Agona west municipality was US $22655.54 and US $32214.56 respectively (Table 9). Figure 3 shows that about 86% of the total economic cost of the CMAM programme was attributed to programme cost, with 6% constituting household cost and the remaining 8% was the cost to community volunteers. Table 9 also shows that personnel cost constituted 20% of the total economic cost, vehicle operation (7%), refresher training (29%), monitoring (12%), building rental (3%) and RUTF (11%).
3.4. Sensitivity Analysis of the Cost Estimates
Table 10 shows that an increase in the discount rate from 3% to 5% led to an increase in the total economic cost (TEC) by 0.1%. However, an increase in the useful life of the vehicles that were used in the CMAM programme, from 5 years to 8 years, led to a reduction in TEC by 0.4%.
Further, the use of the national daily minimum wage in place of the local daily wage for the analysis, led to a reduction in the total economic cost by 0.6%. Again, a reduction (from 21 to 18 pieces) in the number of RUTF given to SAM cases per week, led to a reduction in the total estimated economic cost by 1.4%.
Scenario 1 effected a reduction in the total estimated economic cost by 2.3% and that of scenario 2 was also a reduction (2.2%). Scenario 3 and 4 also presented a reduction in the estimated TEC by 4.6% and 4.5% respectively. Comparative to the one-way sensitivity analysis, the results indicate that the multi-way sensitivity analysis is more effective. The results of multi-way sensitivity analysis are shown in Table 11.
Table 8. Correlations analysis between total direct and total indirect household cost.
Table 9. Total economic cost of CMAM.
Table 10. One way sensitivity analysis of costs estimates.
Table 11. Multi-way sensitivity analysis of costs estimates.
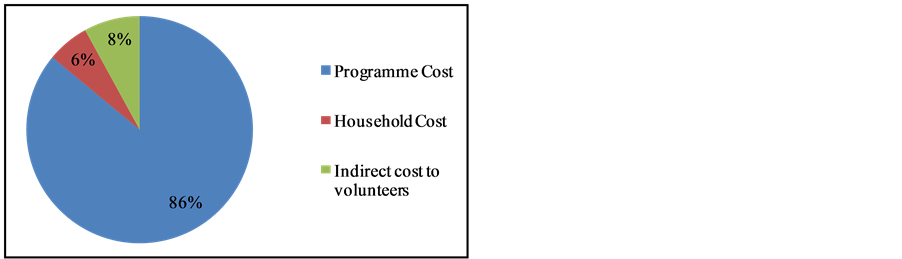
Figure 3. Total economic cost of CMAM.
4. Discussion
This is the first study in Ghana that has attempted to estimate the economic cost of the CMAM programme. The study employed a societal perspective in order to bring forth the cost of SAM imposed on programme managers and households. This is to guide policy makers to factor in household costs into subsequent planning and implementation of interventions not only on malnutrition but also other childhood conditions.
The results of the study indicate that about 95% of the total financial cost was recurrent. This observation was expected because more recurrent resources went into the programme than capital for that particular year. CMAM is part of an integrated programme of the Ghana Health Service that uses capital items that are shared with other programmes. The results of a Malawian study in 2011 [9] corroborates this observation as the study reported 97% as the proportion of the overall financial cost attributable to recurrent cost. However, a study in Northern Ghana on the economic cost of an intervention on bed net impregnation [19] indicates that over 60% of the total financial cost represented capital costs and much of this was spent on the procurement of impregnated bed nets. This is in sharp contrast to the results of the Wilford study and this very study. It is important to note that, the cost profile of the capital costs of any intervention depends on the type of intervention under evaluation and therefore a preventive study is likely to have a higher capital costs than an intervention based on treatment [18] . The bed net intervention was a preventive one and for that matter the target population included all at risk groups thereby increasing the number of participants and that might have contributed to the increased proportion of the capital costs relative to the overall financial cost. Besides, the entire capital cost was incurred on bed nets, which were treated as capital costs having a useful life of more than one year.
Refresher training costs accounted for the highest percentage (44%) of the overall financial cost of the programme, and this was expected because personnel and volunteers require adequate training to manage SAM cases and a lot of resources go into it. This figure is a representation of the cost of only refresher training even though the benefits of the startup training that was conducted for these personnel during the start up phase of the CMAM programme is still enormous. Had the start up cost of training been included in the cost analysis, the proportion of the overall cost constituted by training and subsequently the total financial cost of the programme would have been overwhelming.
Regarding the programme economic cost of CMAM, recurrent costs made up 96% of the total cost. Again capital costs were very low because CMAM vehicle operation was quite minimal compared to the vehicle usage of the other projects in the integrated programmes of the Ghana Health Service. Personnel cost, to an extent, contributed to the rise in the recurrent cost from 95% of the overall financial cost to 96% of the overall economic cost. These figures correspond with the findings of a study conducted in the Nias Island of Indonesia [12] which reported recurrent costs to constitute 93% of programme cost. Another study in Ethiopia [9] also reported 86% as the proportion of programme cost attributable to recurrent costs.
The costs attributed to personnel and refresher training together constituted the highest proportion (about 57%) of all recurrent costs. Of this percentage, about 23% was attributed to personnel cost and the rest (34%) was that for refresher training. The 23% recorded for personnel cost was expected because of the high number of CHNs directly or indirectly involved in the CMAM programme as against the relatively small number of cases recorded in the year of the evaluation (2012). This evidence has again been corroborated by an Indonesian study [12] , which reported staff salaries (for weekly programmes) as the highest expense (85%) of recurrent costs to the programme managers. Another study in Bangladesh [16] shows that staff salaries constitutes 35% of the total programme cost of domiciliary care. Though this type of treatment is somehow different from CMAM, some commonalities exist between the two interventions and therefore comparisons of their cost outcomes can be done.
The cost of RUTF constituted 13% of the programme cost and that was not surprising because of the small number (40) of cases treated. Moreover, the recovery rates were very high because it took on average eight weeks to have a case completely cured and this meant that far less RUTF was utilised. Again, this has been demonstrated by [16] and [12] who have reported RUTF and food supplement to respectively account for 4% and 5% of programme costs. But these studies were not clear whether this component included the cost of importation of the RUTF. The plausible explanation to this relatively high cost component of RUTF is therefore due to the inclusion of the cost component of its importation.
However some studies done elsewhere found high programme (economic) cost profile of 43% and 24% for RUTF respectively in Ethiopia [7] and Bangladesh [11] . It is important to note that the proportion of programme cost attributed to RUTF is heavily influenced by the type of RUTF used in the intervention. This is because some of the studies reviewed used locally made RUTF-Nias biscuit for the management of SAM cases [12] , whiles others used RUTF and milk based formular [7] . Further, the number of cases treated also plays a major role in determining this proportion. Perhaps the following figures will explain this point vividly: 157 cases treated [7] , 101 cases for [12] and 665 [11] .
This study has also shown that the average household cost of CMAM (US $47.63) cannot be ignored due to its significant contribution to the overall economic cost of the programme. The estimated cost represent about 37% of the average household income of caregivers and for that matter should be an integral part of the planning of health interventions, since this high household costs may deter mothers from taking advantage of the CMAM programme. Therefore, if the millennium development goal relating to the reduction in child mortality (MDG 4) is to be met in 2015, there will be the need to take the CMAM programme far closer to the door step of beneficiaries instead of meeting them half way.
Household costs accounted for 6% of the overall economic cost of the CMAM programme when considered vis-à-vis the programme cost and cost to community volunteers. This proportion is not so different from the SAM community treatment Bangladesh study [11] , which reported household costs to account for 5% of the overall economic cost and that for [7] is reported as 7%. The results of another study in Indonesia [12] further corroborate the findings of our study. In their study, the cost profile of social costs was reported as 23%, and therefore singling out the caregiver’s cost from the social costs puts the figure to 10%, which is closer to the estimated figure in our study (6%). Further, the mean productivity loss (opportunity cost) to caregivers was estimated as (US $10.2), which is close to twice as much as US $5.87 [7] . Differences in the demographic characteristics of study sites may explain these varying opportunity costs. This is because the demographic characteristics of an area, to a very large extent, determine where health facilities (treatment centre) are sited and the proximity or otherwise of a treatment centre has an influence on the travel time of caregivers. Moreover, differences in the occupation of caregivers also played a role in determining the loss of productivity, hence the difference in the mean productivity loss reported. These figures, therefore, buttress claims that opportunity costs are lower for caretakers participating in CMAM [13] .
The mean cost of treating a SAM case using the CMAM protocol was estimated as US $805.36, which is high compared to those reported by other studies. Studies in Malawi, Ethiopia and Sudan [21] report this as US $200 and about US $203 is reported in Zambia [10] . The rest are: US $165 in Bangladesh [11] , US $135 in Ethiopia [7] and US $309 in Indonesia [12] . All these figures fall within the range of US $46 to US $453 [20] . The plausible explanation to these figures is the huge number of SAM cases that were enrolled and treated in these studies as compared to the low number of cases (40) in our study. The mean economic cost per case treated reported in our study would have been close to the other studies reviewed if the number of cases treated in the year of review was in the hundreds. Certainly, the cost contribution of RUTF will definitely increase but to the extent of largely influencing the overall cost of the programme and for that matter the unit cost of treating a SAM case, is in doubt. To minimize the effect of this cost, the use of locally manufactured RUTF can be considered since studies have provided enough evidence to prove that the imported RUTF (foreign ones) are very expensive and typically constitutes about 30% to 40% of CMAM costs ([7] [9] [10] [21] ).
Case detection in the Agona West Municipality has been declining over the past few years and therefore was not surprising that only forty cases were recorded and treated in 2012. The declining number of cases, coupled with routine trainings and a more than necessary involvement of CHN’s is what, to a very large extent, accounted for the high mean cost per child treated. These activities may be very necessary during the first year of the implementation of CMAM, but it will be necessary to make adjustments and not maintain the status quo in a situation where there is a diseconomy of scale as time goes on.
Although some reasons have been adduced to the high cost recorded, it is evident that this poses a serious threat to the sustenance of the programme. It is therefore important to put in place relevant cost control strategies to drastically reduce the cost of implementing this intervention. For example, average cost will be significantly reduced once the number of involvement of CHNs in the CMAM programme is reduced to correspond with the rather low cases expected. Further, a reduction in the number of refresher training sessions and its corresponding costs components will also significantly reduce unit costs.
A limitation of our study is that, it was a retrospective one and for that matter some recall bias may have been introduced while collecting data from caregivers, community volunteers and programme staff, for the estimation of all relevant costs of the CMAM programme. Another limitation is the assumption that was made in the calculation of the productivity loss to caregivers, that all of them were employed and productive members of the society. As a result, a local daily wage of US $1.59 was used in the estimation, which may not be the case.
5. Conclusions
The results of this study have brought to bear the financial and economic cost of the implementation of the CMAM programme in the Agona West Municipality in 2012. The estimated costs are quite high and therefore, there is the need to implement several cost saving strategies to reduce the unit cost per SAM case treated. Training the frontline implementers of the CMAM policy in their communities through the Municipal Nutrition Officer is one way of reducing cost since this strategy will not require travel and lodging costs on the part of front line implementers. The frequency of refresher training and the number of days spent on it should be reduced since this activity constitutes a major cost component of the overall economic cost of the programme. Once the start up training for the programme is organised, mechanisms should be put in place to ensure constant transfer of knowledge of the CMAM principles from the old and experience CHNs to the new ones.
Although the CMAM programme has proven to be an effective tool for the management of SAM, its associated costs are quite enormous when coverage levels (geographic) are high yet small number of cases are detected and treated. Perhaps, the Bangladesh study [11] puts it best with the view that the management of SAM cases in large numbers at the community level in countries like Bangladesh is a feasible mechanism for delivering cost effective treatment. The CMAM programme in the Agona West Municipality may not be a cost effective alternative to the management of SAM cases if further analysis of the effectiveness of the programme is conducted in relation to its costs.
Acknowledgements
The study received financial support from the Institute of Infectious Diseases of Poverty (IIDP). We acknowledge the support and contributions from the Nutrition Department of the Ghana Health Service, staff of USAID/FANTA (especially Ms Alice Nkoroi), and the staff of the Agona West Municipal Health Directorate.
References
- World Health Organisation (2013) Global Nutrition Policy Review: What Does It Take to Scale up Nutrition Action? WHO Press, Geneva.
- Gibney, J.M., Margetts, B.M., Kearney, J.M., Arab, L., Guerrero, S., et al. (2004) Public Health Nutrition. Blackwell Science Ltd., Oxford.
- WHO Multicentre Growth Reference Study Group (2006) WHO Child Growth Standards: Methods and Development. http://www.who.int/childgrowth/standards/technical_report/en
- WHO/WFP/UNICEF/UNSCN (2007) A Joint Statement on Community-Based Management of Severe Acute Malnutrition. Geneva and New York.
- WHO (2013) World Health Statistics. Geneva.
- Bhutta, Z.A., Ahmed, T., Black, R.E., Cousens, S., Dewey, K., et al. (2008) Maternal and Child under Nutrition: Global and Regional Exposures and Health Consequences. The Lancet, 371, 243-260. http://dx.doi.org/10.1016/S0140-6736(07)61690-0
- Tekeste, A., Wondafrash, M., Azene, G. and Deribe, K. (2012) Cost Effectiveness of Community-Based and In-Patient Therapeutic Feeding Programs to Treat Severe Acute Malnutrition in Ethiopia. Cost Effectiveness and Resource Allocation, 10, 4. http://dx.doi.org/10.1186/1478-7547-10-4
- USAID/FANTA (2011) Report on the Review of the Integration of Community Based Management of Acute Malnutrition into the Ghana Health System. Food and Nutrition Technical Assistance II Project (FANTA-2), Washington DC, 74S-91S.
- Wilford, R., Golden, K. and Walker, D.G. (2012) Cost-Effectiveness of Community-Based Management of Acute Malnutrition in Malawi. Health Policy and Planning, 27, 127-137. http://dx.doi.org/10.1093/heapol/czr017
- Bachmann, M.O. (2009) Cost Effectiveness of Community-Based Therapeutic Care for Children with Severe Acute Malnutrition in Zambia: Decision Tree Model. Cost Effectiveness and Resource Allocation, 7, 2. http://www.resource-allocation.com/content/7/1/2 http://dx.doi.org/10.1186/1478-7547-7-2
- Puett, C., Sadler, K., Alderman, H., Coates, J., Fiedler, J.L., et al. (2012) Cost-Effectiveness of the Community-Based Management of Severe Acute Malnutrition by Community Health Workers in Southern Bangladesh. Health Policy and Planning, Oxford University Press, 1-14.
- Purwestri, R.C., Scherbaum, V., Inayati, D.A., Wirawan, N.N., Suryantan, J., et al. (2012) Cost Analysis of Community-Based Daily and Weekly Programs for Treatment of Moderate and Mild Wasting among Children on Nias Island, Indonesia. Food and Nutrition Bulletin, 33, 207-216.
- Collins, S., Sadler, K., Dent, N., Khara, T., Guerrero, S., et al. (2006) Key Issues in the Success of Community-Based Management of Severe Malnutrition. Food and Nutrition Bulletin-United Nations University, 27, 49.
- Hanson, K., Goodman, C., Lines, J., Meek, S., Bradley, D., et al. (2004) The Economics of Malaria Control Interventions. http://announcementsfiles.cohred.org/gfhr_pub/assoc/s14802e/s14802e.pdf
- Drummond, M.F., Sculpher, M.J., Torrance, G.W., O’Brien, B.J. and Stoddart, G.L. (2005) Methods for the Economic Evaluation of Health Care Programs. Oxford University Press.
- Ashworth, A. and Khanum, S. (1997) Cost-Effective Treatment for Severely Malnourished Children: What Is the Best Approach? Health Policy and Planning, 12, 115-121. http://dx.doi.org/10.1093/heapol/12.2.115
- Gold, M., Siegel, J., Russell, L. and Weinstein, M. (1996) Cost-Effectiveness in Health and Medicine. Oxford University Press, New York.
- Nonvignon, J., Chinbuah, M.A., Gyapong, M., Abbey, M., Awuni, E., et al. (2012) Is Home Management of Fevers a Cost-Effective Way of Reducing Under-Five Mortality in Africa? The Case of a Rural Ghanaian District. Tropical Medicine and International Health. Blackwell Publishing Ltd.
- Binka, F.N., Mensah, O.A. and Mills, A. (1997) The Cost-Effectiveness of Permethrin Impregnated Bednets in Preventing Child Mortality in Kassena-Nankana District of Northern Ghana. Health Policy, 41, 229-239. http://dx.doi.org/10.1016/S0168-8510(97)00035-3
- Bachmann, M.O. (2010) Cost-Effectiveness of Community-Based Treatment of Severe Acute Malnutrition in Children. Expert Review of Pharmacoeconomics & Outcomes Research, 10, 605-612. http://dx.doi.org/10.1586/erp.10.54
NOTES

*Economic Cost of CMAM.