Health
Vol.5 No.8C(2013), Article ID:35789,11 pages DOI:10.4236/health.2013.58A3005
Obesity and leptin resistance: The role of growth hormone
![]()
Laboratory of Biotechnology and Genomics, Department of Swine and Small Ruminant Breeding, Agricultural University, Krakow, Poland; *Corresponding Author: rzzieba@cyf-kr.edu.pl
Copyright © 2013 Malgorzata Szczesna et al. This is an open access article distributed under the Creative Commons Attribution License, which permits unrestricted use, distribution, and reproduction in any medium, provided the original work is properly cited.
Received 12 June 2013; revised 15 July 2013; accepted 31 July 2013
Keywords: GH; Leptin Resistance; Obesity; SOCS-3
ABSTRACT
Decreased growth hormone (GH) function in obese patients might contribute to associated metabolic abnormalities. This study aimed to investigate the effect of leptin, GH and periods of leptin sensitivity or/and insensitivity on the expression of the SOCS-3 gene in the ovine pituitary and to examine the influence of centrally administered leptin on GH release in sheep. Our first experiment investigated the periods of leptin resistance and leptin sensitivity, which are known as the long day (LD) and the short day (SD) periods, respectively, using ewes that were surgically fitted with third ventricular cannulae. The ewes were assigned randomly to one of three treatments and were centrally infused at 0, 1 and 2 h, beginning at sunset. The treatments consisted of central infusions of either RingerLocke buffer or leptin (0.5 or 1.0 μg/kg body weight (BW), respectively). Our next experiment examined the pituitaries isolated from ewes decapitated in either May or November. The explants were treated with control or GH (100 or 300 ng/ml) or leptin (50 or 100 ng/ml)—containing media and incubated for one of four different time intervals. The in vivo experiments demonstrated variable effects of leptin on GH release depending on the period of leptin sensitivity/ insensitivity. The in vitro experiments demonstrated that leptin significantly influenced the expression of the SOCS-3 gene during that SD compared to that during the LD. During the SD, we observed that significantly low or high doses of GH affected the expression of SOCS-3. These results indicated a strong correlation between leptin or GH and SOCS-3, which might explain leptin resistance and the associated perturbations in GH signaling.
1. INTRODUCTION
Hyperinsulinemia, hypoadiponectinemia and leptin resistance associated with obesity can suppress the secretion of growth hormone (GH), which results in increased fat accumulation that might represent an important factor in the pathogenesis of obesity [1]. GH is an anabolic hormone that exhibits important functions in the regulation of somatic growth, either directly or indirectly via effectors such as insulin-like growth factor-1 (IGF-1). However, another facet of the biological effects elicited by GH includes its ability to modulate metabolism and energy homeostasis [2]. GH secretion is consistently reduced in obesity [1,2]. In fact, in a study that examined healthy volunteers, 2 weeks of over-eating resulted in significantly reduced serum concentrations of GH, despite a lack of changes in body weight, suggesting that reduced GH secretion occurs prior to the onset of obesity [3]. Furthermore, local GH resistance within the adipose tissue might further mediate fat accumulation, exacerbating the pathogenesis of obesity [4]. Leptin, a hormone that is synthesized by adipocytes, regulates the secretion of several pituitary hormones in humans, rats, or ruminant animal species [5-8]. The expression of leptin receptor mRNA has been detected within the anterior pituitary gland and the hypothalamus by RT-PCR [9], and leptin appears to exhibit an important role in the control of GH release [7,10,11].
Although it was originally referred to as an anti-obesity hormone in humans, leptin elicits effects are counteracted in some individuals by a natural resistance that is associated with hyperleptinemia, which is attributed to changes in hypothalamic/pituitary sensitivity to leptin. Such leptin sensitivity can be associated with conditions including, for example, pregnancy and lactation, or obesity. It appears that an intracellular protein that is induced by leptin receptor activation, suppressor of cytokine signaling-3 (SOCS-3), might mediate leptin resistance at the molecular level, as it can effectively block leptin signaling [12]. The critical mechanisms underlying this process remain unclear. The down-regulation of GH receptor (GHR) activation is also mediated by the suppressor of cytokine signaling (SOCS) family of proteins, which includes SOCS-1, -2, -3, -6 and cytokine-inducible, SH2-containing protein (CIS), which are induced by the Janus kinase (Jak) and Signal Transducer and Activator of Transcription (Jak/STAT) pathway. GH itself has been shown to induce SOCS-2 and -3 [13]. There is evidence implying that SOCS-3 exhibits an important function within the pituitary. Recent studies have indicated that the level of SOCS-3 expression is also dependent on environmental factors, such as photoperiodic conditions and nutritional status.
Despite the provision of unlimited food, sheep exhibit increased appetite and body weight during long days (LD, spring-summer) and decreased appetite and body weight in response to short days (SD, autumn-winter). Much of the body-weight change is attributable to changes in adipose tissue mass, and the photoperiod-induced changes in nutritional status exhibit predictable consequences in terms of leptin secretion. Thus, the seasonal pattern of circulating leptin concentrations reflects the pattern of adiposity and matches the seasonal pattern of appetite drive. This situation appears to be paradoxical in view of the purported anorectic role of leptin. However, seasonal animals appear to adjust their sensitivity to the leptin signals accordingly [14]. An anorectic response to high endogenous leptin levels during LD periods would counteract the photoperiodic drive to increase food intake, and a reduction in leptin sensitivity during the LD periods would be required to maintain the seasonal appetite and body-weight cycles.
Seasonal animals such as sheep exhibit the unique potential to serve as an elegant research model for the etiological study of obesity, showing bi-annual reversible leptin insensitivity [14]. SOCS-3 proteins are important regulators that play a key role in feeding-induced or genetic-origin-related obesity, as well as in leptin and GH resistance, leading to the hypothesis that therapy aimed at reducing the levels of these proteins within the hypothalamus/pituitary might aid in the treatment of obesity that is associated with reduced leptin sensitivity or GH levels.
The specific aims of this paper are as follows: 1) Characterization of the GH secretion profile after leptin treatment during leptin resistant and sensitive periods; 2) Determine the direct effects of leptin and GH on the mRNA expression levels of SOCS-3 within the pituitary and investigate whether the effects of these hormones are subject to modification during periods of leptin sensitivity and insensitivity.
2. MATERIALS AND METHODS
All of the animal-related procedures were approved by the Local Agricultural Animal Care and Use Committee of Krakow.
2.1. Animal Model
The studies were performed at the Experiment Station in the Department of Swine and Small Ruminant Breeding, Agricultural University of Krakow (longitude: 19˚ 57ʹ E, latitude: 50˚04ʹ N). This study included 20 female Polish Longwool sheep, which is a breed that exhibits strong reproductive seasonality. The animals were 2 - 3 year of age, weighed an average of 60 ± 5 kg and were housed in individual pens that were subject to natural photoperiodic and thermoperiodic conditions. The sheep were in optimal physical condition (Body Condition Score [BCS] = 3 on a scale of 1-5, as previously described [15]) and were fed a diet formulated to provide 100% of the National Research Institute of Animal Production [16] recommendations for maintenance, twice daily at 0700 and 1400. Water was provided ad libitum.
In the current experiment, estradiol-implanted and ovariectomized females were used, as described in our previous leptin studies [11,17,18]. This is a widely accepted neuroendocrine model, which is commonly used to avoid the confounding effects of the ovarian cycle on hormonal interactions and to provide a model with constant physiological concentrations of gonadal steroid feedback.
2.1.1. Experiment I—Effect of icv Leptin Infusion on GH Release—An in Vivo Study
1) Procedures and Treatments Twelve ovariectomized, mature female sheep, each bearing an estradiol implant to maintain circulating concentrations of estradiol at 2 - 4 pg/ml, were fasted for 24 h and fitted surgically with intracerebroventricular (icv) cannulae, as previously described by Traczyk and Przekop [19]. The location and function of the cannulae were verified by the continuous flow of cerebrospinal fluid. A recovery period of at least 3 weeks was allowed for the sheep after the neurosurgeries.
Prior to the beginning of the study, the ewes were placed frequently into individual carts to familiarize them with the experimental conditions. All of the experiments began at dusk—the beginning of darkness in the evening—during the LD (March, April and May) and SD (September, October and November) seasons.
In the morning on the day of each experiment, four randomly chosen sheep were fitted with jugular catheters for intensive blood sampling. Polyethylene tubing (70 mm; 0.58 i.d., 0.96 mm o.d.; Intramedic Clay Adams Brand, Becton Dickinson, Sparks, MD, USA) was inserted using an aseptic technique through each icv guide cannula so that the distal end projected 3 - 5 mm past the end of the cannula and into the ventricle. The proximal end of the tubing extended approximately 5 - 10 mm beyond the tip of the guide cannula. The tubing was adjusted until the cerebrospinal fluid flowed readily using a blunt 22 G-needle and a tuberculin syringe. The tubing was plugged until later use.
Recombinant ovine leptin used in our experiments was obtained from Ray Biotech, Inc. (Norcross, GA, USA). We designated three treatment groups as follows: 1) Control, Ringer-Locke buffer (pH 7.4); 2) Leptin 1—a lower dose of exogenous leptin (0.5 μg/kg of body weight [BW]); and 3) Leptin 2—a higher dose of leptin (1.0 μg/kg BW). The experiment was performed in a switchback design, such that four ewes from each group received one of the three treatments (control, L1, or L2) centrally in a random order, approximately 2 weeks apart (Figure 1A). The use of 12 ewes per season resulted in four replicates for each treatment. The doses of leptin used in the icv study were determined based on our previous experience [11,17,20] and on the theoretical calculations found in a previous icv injection study using sheep [21]. Exogenous leptin was administered centrally at the following three times: 0, 1 and 2 h after the beginning of the experiment. Blood samples (5 ml) were collected at 15-minute intervals for 6 h, beginning immediately prior to the first infusion at dusk and continuing later under red lights (Figure 1B). The blood samples were dispensed into tubes containing 150 ml of a heparin-containing solution (10,000 IU/ml) and 5% (w/v) ethylenediaminetetraacetic acid (EDTA) and were immediately placed on ice. Plasma was separated by centrifugation and stored at −20˚C until subsequent analysis of GH and estradiol levels was performed.
2) RIA for GH Plasma concentrations of GH were assayed by a radioimmunological, double antibody method using antibovine GH and anti-rabbit-γ-globulin antisera, as previously described by Dvorak, et al. [22]. Bovine GH (NIDDK-GH-B-1003A) served as a reference standard. The assay sensitivity was 0.4 ng/ml, and the intraand inter-assay coefficients of variation were 6.12% and 11.40%, respectively.
3) EIA for Estradiol The concentrations of estradiol were determined by EIA using commercially available kits (DRG Instruments
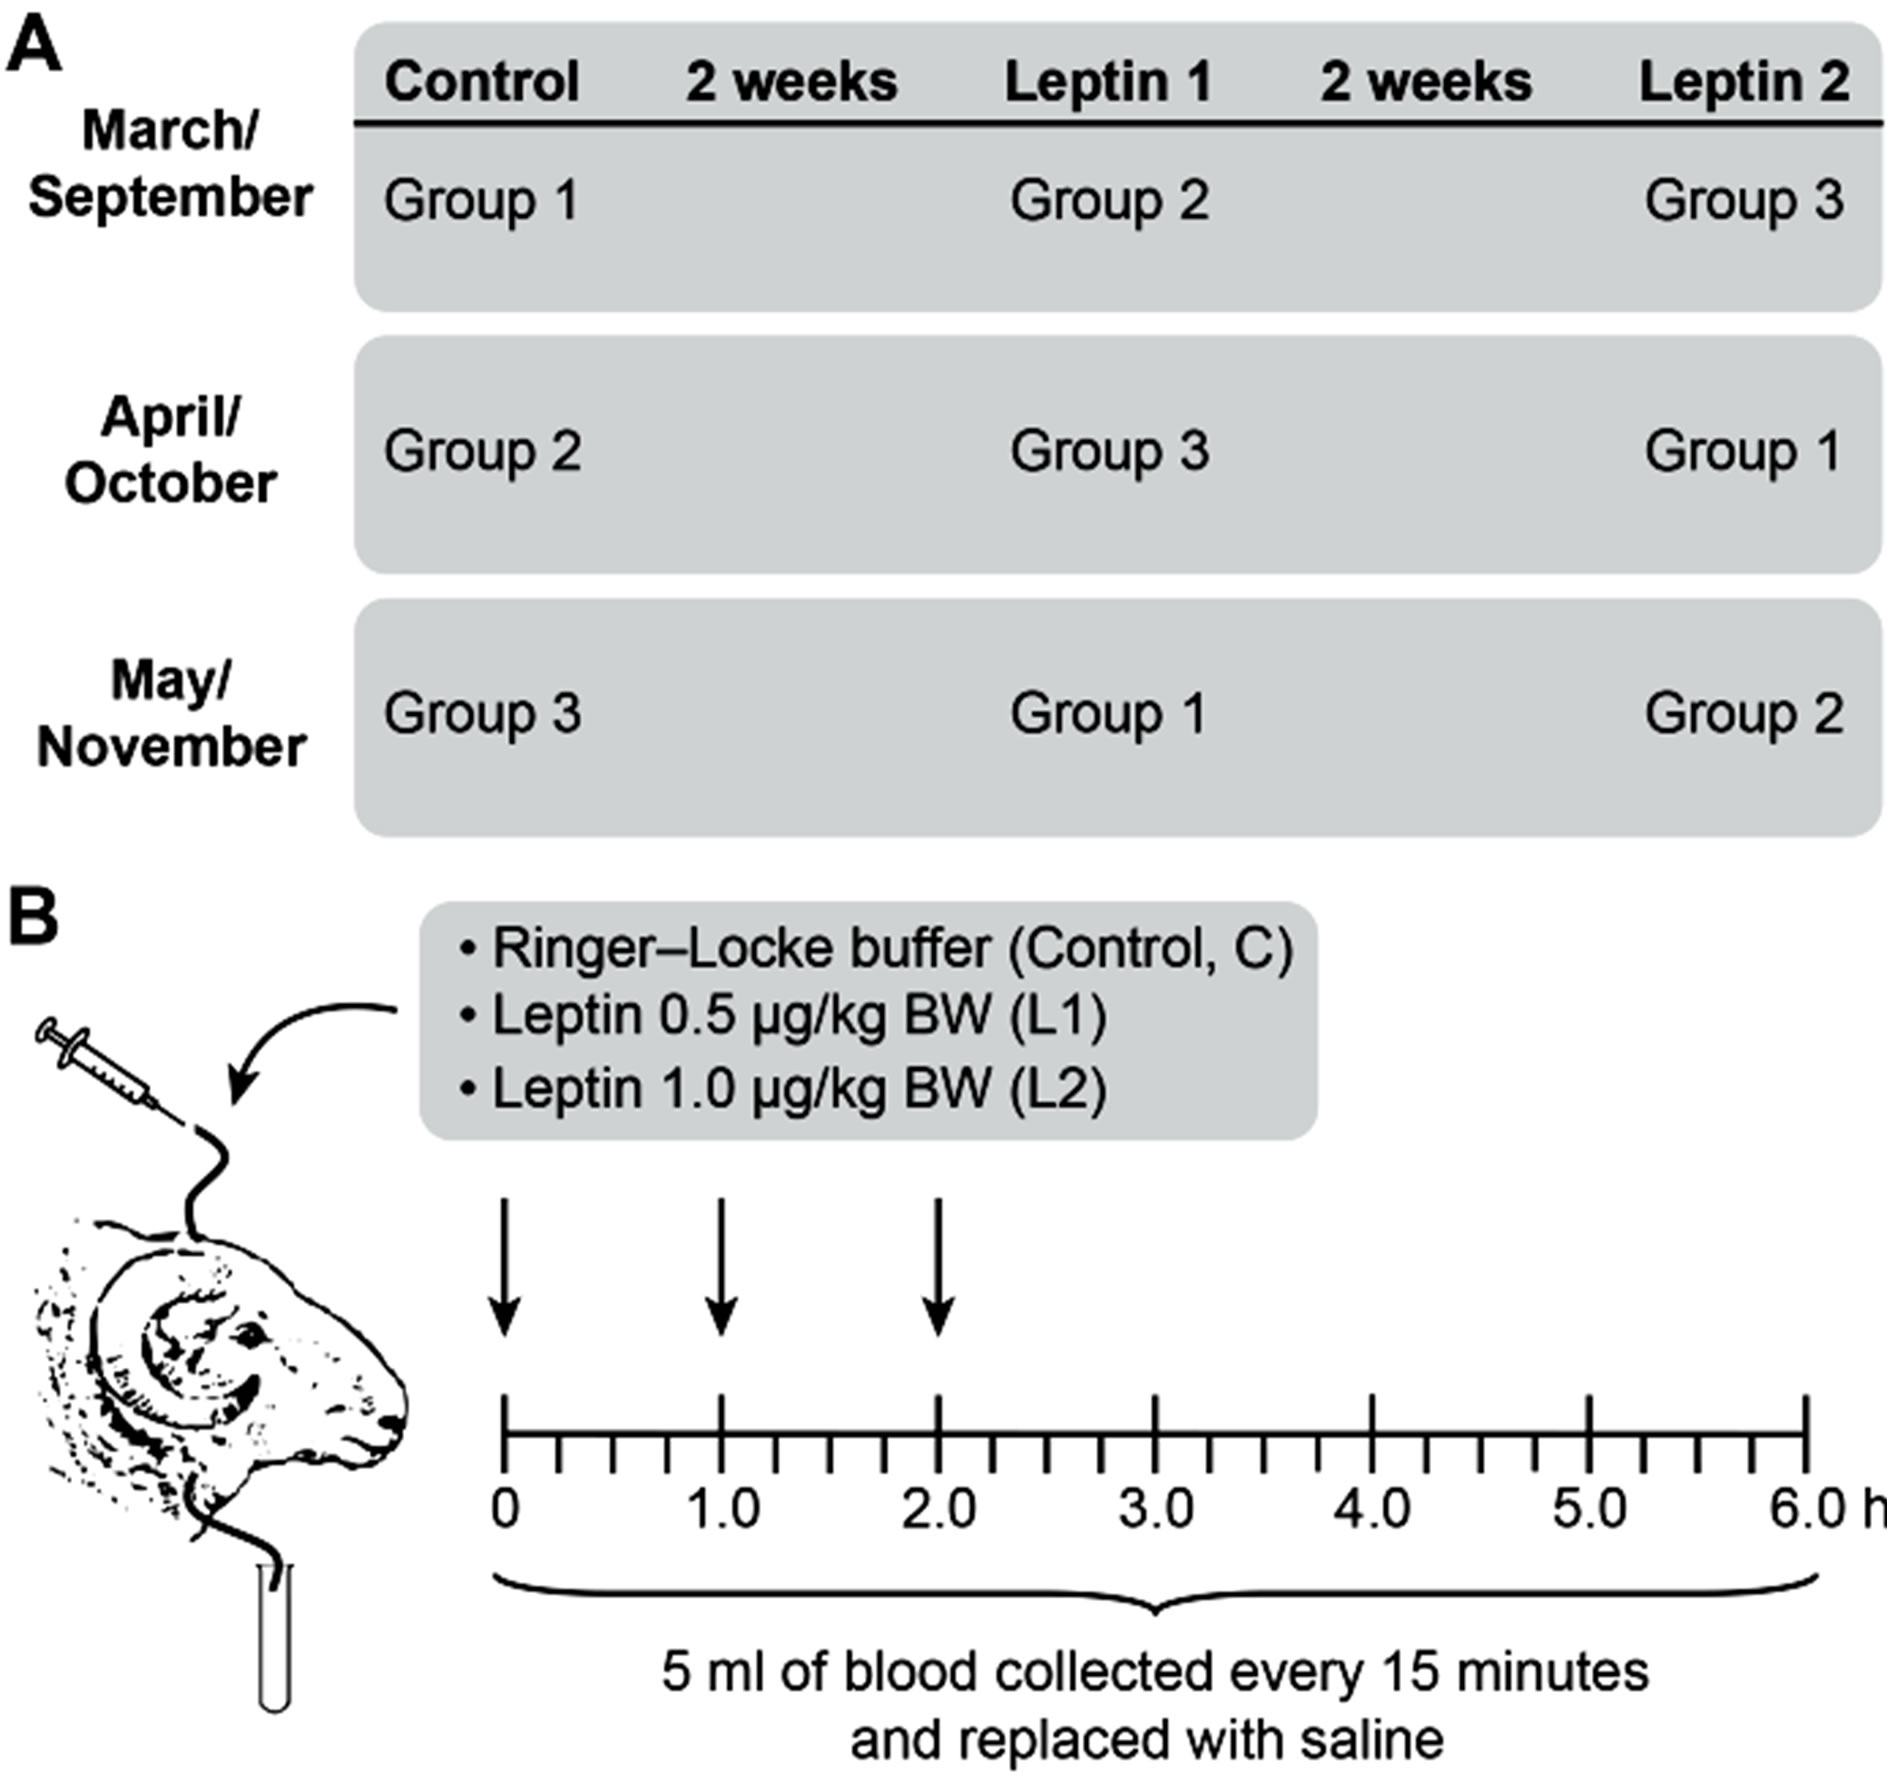
Figure 1. Timeline for experimental procedures. 12 ewes were assigned randomly to one of three groups (n = 4/group) during long-day (LD; March, April, May) and short-day (SD; September, October, and November) photoperiods—panel A. Treatments consisted of 1) control, Ringer-Locke buffer; 2) L1, a low dose of exogenous leptin (0.5 mg/kg BW); and 3) L2, a high dose of leptin (1.0 mg/kg BW)—panel B. Arrows indicate central treatments with leptin or Ringer-Locke buffer at 0, 1, and 2 h of the 6-hour experiment.
GmbH, Marburg, Germany), according to the manufacturer’s protocols. All of the samples were processed in duplicate within the same assay. Interand intra-run precision exhibited coefficients of variation of 6.72% and 6.72%, respectively. The sensitivity of assay was 1.71 pg/ml.
4) Statistical Analysis The hormone data were analyzed using the general linear models (GLM) procedure (PROC GLM) of the Statistical Analysis System (SAS 8.1; SAS Institute Inc., Cary, NC, USA). For the hormone comparisons, the overall ANOVA included the treatment, season, replicate within the season, time within the season and all of the twoand three-way interactions, for the repeated measures in the switchback design. Significant treatment × season interactions resulted in a within-season model that included the treatment, time and the treatment × time. Following a significant F-test, the Pdiff procedure of SAS was used to contrast the mean values. After determining a significant F-value, the means were contrasted using Duncan’s multiple-range test. Differences with p < 0.05 were considered statistically significant. The data are expressed as the means ± S.E.M.
2.1.2. Experiment II—Effect of Leptin and GH on SOCS-3 Expression—An in Vitro Study
1) Procedures and Treatments Eight ewes were used in this experiment. The sheep were sacrificed by exsanguination following captive bolt stunning and decapitation. The diencephalons were removed after the disconnection of the infundibuli from the adenohypophyses (AP). The adenohypophyses were removed from the sella turcica and maintained on ice until subsequent tissue processing.
The APs from four ewes were used in each experimental season within the LD season (May-spring), and an additional four ewes were randomly selected during the SD season (November—fall). Adenohypophyses collected from each ewe were dissected and sagittally sliced into approximately 0.5 - 2 mm strips. Four AP strips from each adenohypophysis were randomly selected, placed on a stainless steel grid covered with lens paper and incubated in a gas-liquid interface in 2.5 ml of Medium 199. The incubation was performed in a 95% humidified air and 5% CO2 atmosphere at 37˚C. The explants were treated with control, GH (100 ng/ml or 300 ng/ml; SIGMA-Aldrich Corporation, St. Louis, MO, USA)—containing, leptin (50 ng/ml or 100 ng/ml)— containing media. Each treatment group consisted of 3 replicates. One milliliter of culture medium was harvested every hour from each experimental group and replaced with fresh medium. The explants were incubated for the following 4 different time intervals: 0, 30, 60 and 120 minutes. The explants were rinsed in a phosphate buffered saline solution (PBS; Laboratory of Vaccines, Lublin, Poland), frozen in liquid nitrogen and stored at 80˚C.
2) Molecular Analysis Real-Time PCR was used to measure the SOCS-3 mRNA levels. Total RNA was prepared using TRIzol® Reagent (Invitrogen Corporation, Carlsbad, CA, USA), according to the manufacturer’s protocols. RNA (0.5 µg) was reverse transcribed to cDNA using the Quantiscript Reverse Transcriptase and RT Primer Mix (QuantiTect® Reverse Transcription Kit, Qiagen, Hilden, Germany) by incubating the samples at 42˚C for 15 minutes. The reactions were terminated by heating to 94˚C for 3 minutes. Genomic DNA was eliminated by adding gDNA Wipeout Buffer (QuantiTect® Reverse Transcription Kit) and incubating the samples at 42˚C for 2 minutes. The cDNA was amplified using the TaqMan® Gene Expression Master Mix (Applied Biosystems, Foster City, CA, USA) on an Applied Biosystems 7300 Real-Time PCR System. The primers and probes were designed using Primer Express software v.3.0 (Applied Biosystems). The products were amplified using 250 nM of the following primers: 5’-CCTCAAGACCTTCAGCTCCAA-3’ and 5’-CTTGCGCACTGCGTTCAC-3’ (corresponding to the bovine SOCS-3 gene; GenBank accession number NM_174466; Sequence Detection Primers, Applied Biosystems, Foster City, CA, USA) or 5’-CGGCTCCCAGTTCTTCATCA-3’ and 5’-ACTACGTGCTTCCCATCCAAA-3’ (corresponding to bovine cyclophilin; GenBank accession number D14074; Sequence Detection Primers, Applied Biosystems, Foster City, CA, USA). The probe sequences were FAM™-AGCGAGTACCAGCTGG-MGB (corresponding to the SOCS-3 gene; TaqMan MGB Probes; Applied Biosystems, Foster City, CA, USA) and FAM™-CGTTCCGACTCCGC-MGB (corresponding to the cyclophilin gene; TaqMan MGB Probes; Applied Bio-systems, Foster City, CA, USA). Each gene assay was run in a singleplex reaction in triplicate for each cDNA sample. Amplification was performed under the following conditions: an initial incubation at 50˚C for 2 minutes, polymerase activation at 95˚C for 10 minutes, followed by 40 cycles of denaturation (95˚C for 15 seconds) and annealing/elongation (60˚C for 60 seconds) steps. The data were collected and recorded using the Applied Bio-systems 7300 Real-Time PCR System SDS Software and expressed as a function of the threshold cycle (Ct). Using diluted samples, the amplification efficacies for the genes of interest and the reference gene were found to be identical.
3) Statistical Analysis Expression levels were calculated by RQ (Relative Quantification) analysis. In brief, the amplification plot is a plot of fluorescence versus PCR number. The threshold cycle value (Ct) is the fractional PCR cycle number at which the fluorescent signal reaches the detection threshold. Therefore, the input cDNA copy number and Ct are inversely related. The data were analyzed using the 2-ΔΔCt method, and the Ct value was converted to a fold-change (RQ) value. The RQ = 2 − ΔΔCt, where ΔΔCt = ΔCt sample − ΔCt calibrator = (Cttarget gene − Ctreference gene) sample—(Cttarget gene − Ctreference gene) calibrator. The RQ values from each gene were then used to compare the target gene expression levels across all of the groups.
The mean mRNA expression level for the SOCS-3 gene of each sample was normalized to the expression level of the reference gene (cyclophilin) and expressed relative to the indicated calibrator. As a calibrator, we used the mean ΔCt value of the control group for the indicated time of incubation to compare changes in the expression levels during the incubation periods. To determine the basal expression level of SOCS-3, depending on the season, we considered the ΔCT values of the samples that were not incubated and used the mean ΔCt values for the non-incubated samples isolated during a LD period. After determining a significant F-value, the means were contrasted using Student’s t-test. Differences with p < 0.05 were considered statistically significant.
3. RESULTS
3.1. Experiment I—Effect of icv Leptin Infusion on GH Release—An in Vivo Study We observed seasonal variations in the basal secretion of GH; the serum concentration of GH was increased in the control group (p < 0.001) during the LD season compared to during the SD season (5.05 ± 0.86 ng/ml and 3.47 ± 0.56 ng/ml, respectively, Figure 2).
The effect of the icv infusion of leptin was also seasonally dependent (Figures 3 (A) and (B)). During the SD season, leptin elicited a stimulatory effect on GH (p < 0.001, Figure 3(B)), whereas it reduced the serum GH levels during the LD season (p < 0.001, Figure 3(A)). During the SD season, we also observed a dose-dependent effect of leptin; the serum concentrations of GH were significantly increased (p < 0.001) when the ewes were administered an increased dose of leptin (1.0 mg/kg BW) compared with those receiving a lower dose (0.5 mg/kg BW, Figure 3(B)).
3.2. Experiment II—The Effect of Leptin and GH on SOCS-3 Expression—An in Vitro Study In this experiment, both exogenous leptin and GH affected the expression levels of SOCS-3 within the ovine AP, and the nature of their effects was dependent on the incubation time, hormone dosage and the season in which the explants were collected. The basal endogenous expression levels of SOCS-3 in untreated APs that were frozen immediately after tissue isolation were similar to that in the APs obtained during both the LD and SD seasons (Figure 4).
3.2.1. Leptin Effects on SOCS-3 Expression
The results of the leptin treatment for the entire experiment are shown in Figure 5. During the LD season, the lower leptin dose significantly (p < 0.01) increased the SOCS-3 mRNA expression levels, whereas during the SD season, leptin only significantly affected the explants that were incubated with a higher hormone concentration (p < 0.01). The effect of the hormone was dependent on the incubation time. During the LD season, the lower dose of leptin significantly stimulated SOCS-3 mRNA expression in the explants incubated for 30 (p < 0.001) and 120 minutes (p < 0.01), but not in the explants incubated for 60 minutes (Figure 6(A)). For the higher leptin concentration (100 ng/ml), we did not observe significant differences compared to the control samples for any of the incubation times. However, significant differences (p < 0.05) were observed in SOCS-3 expression levels in response to different leptin concentrations after an incubation for 120 minutes.
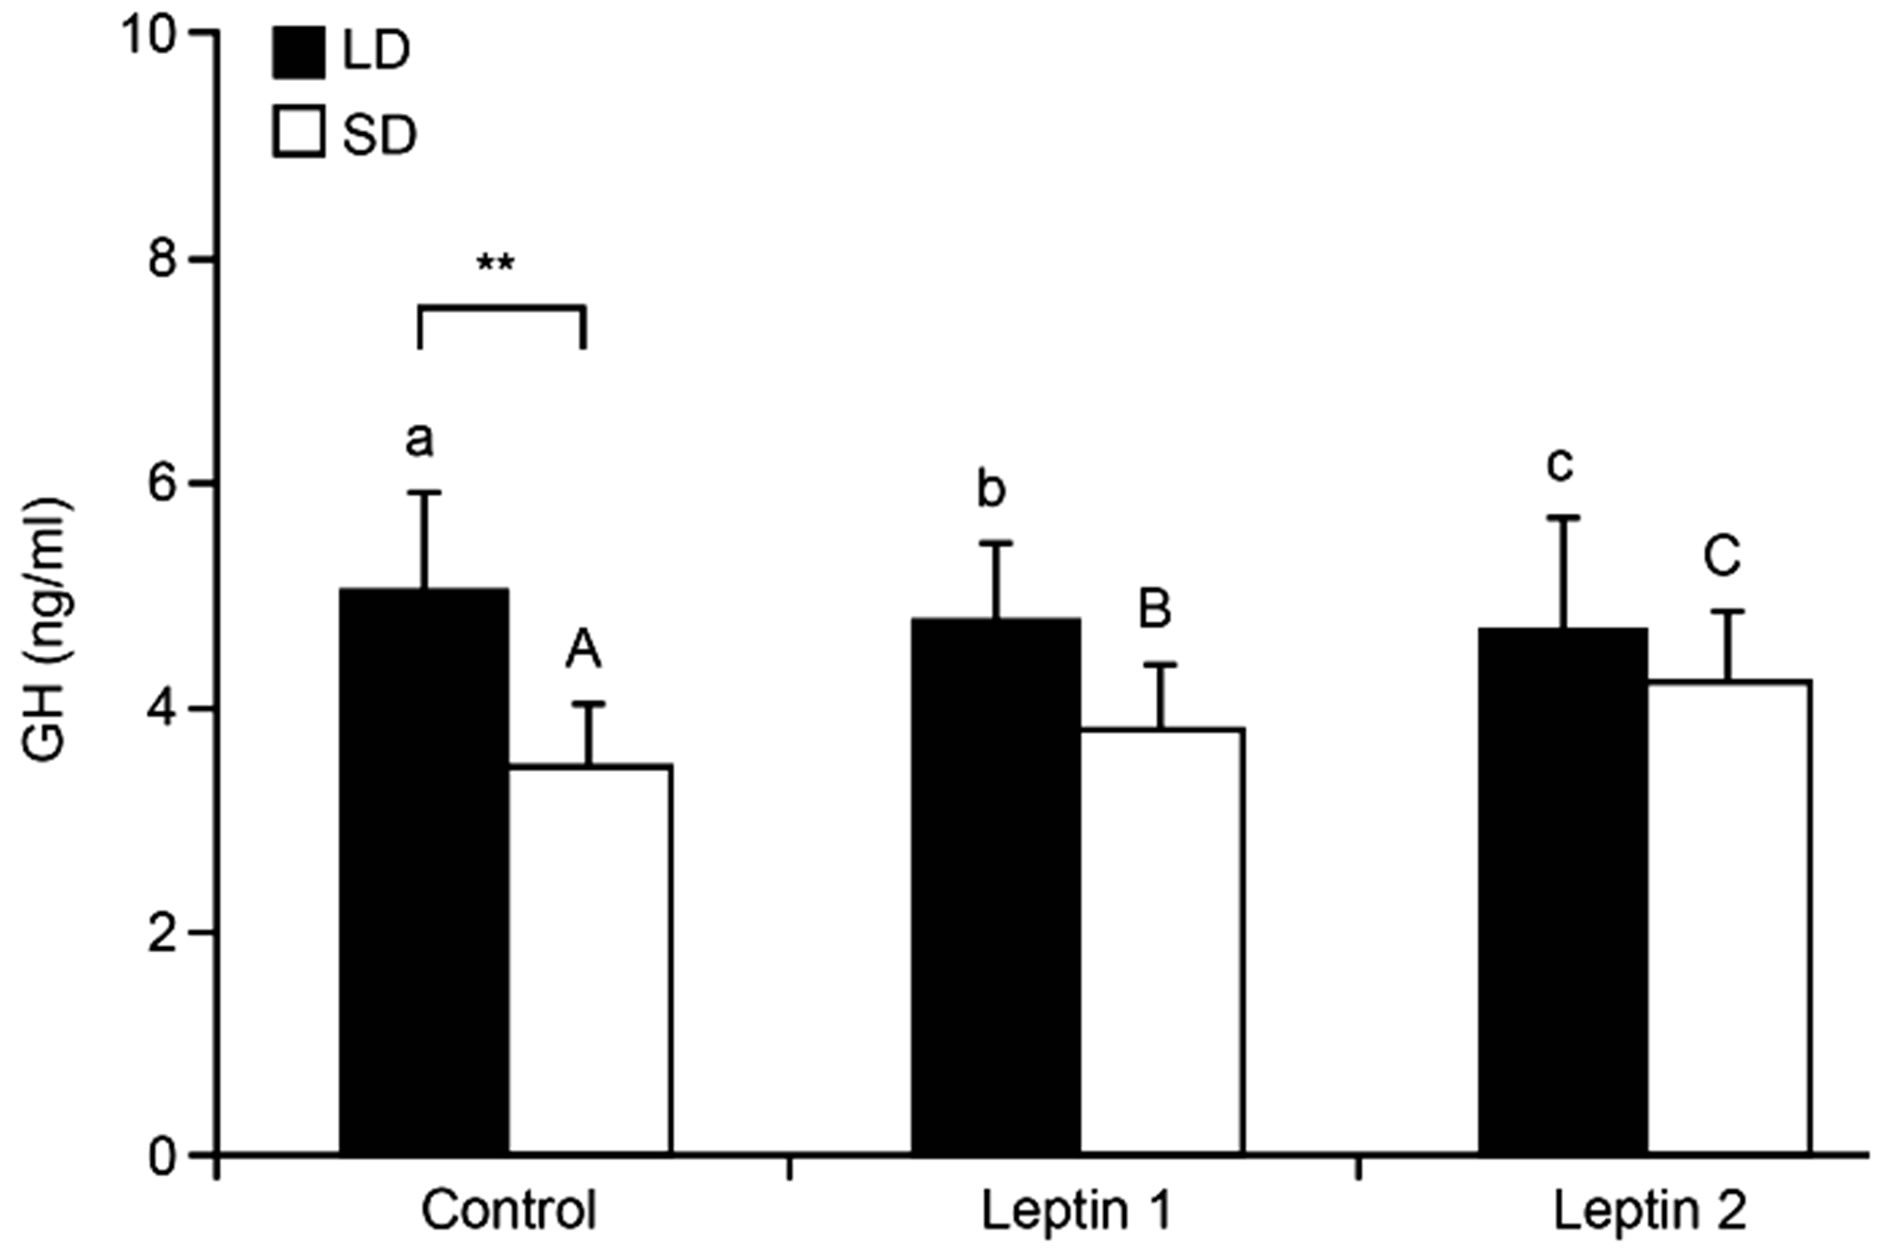
Figure 2. Mean (±S.E.M.) plasma concentrations of GH in sheep treated centrally with Ringer-Locke buffer (Control), leptin in a dose of 0.5 mg/kg BW (Leptin 1) or 1.0 mg/kg BW (Leptin 2) during long-day (LD) and short-day (SD) photoperiods. Differences are depicted with A,B,C (p < 0.01) and a,b,c (p < 0.05) or **(p < 0.01).
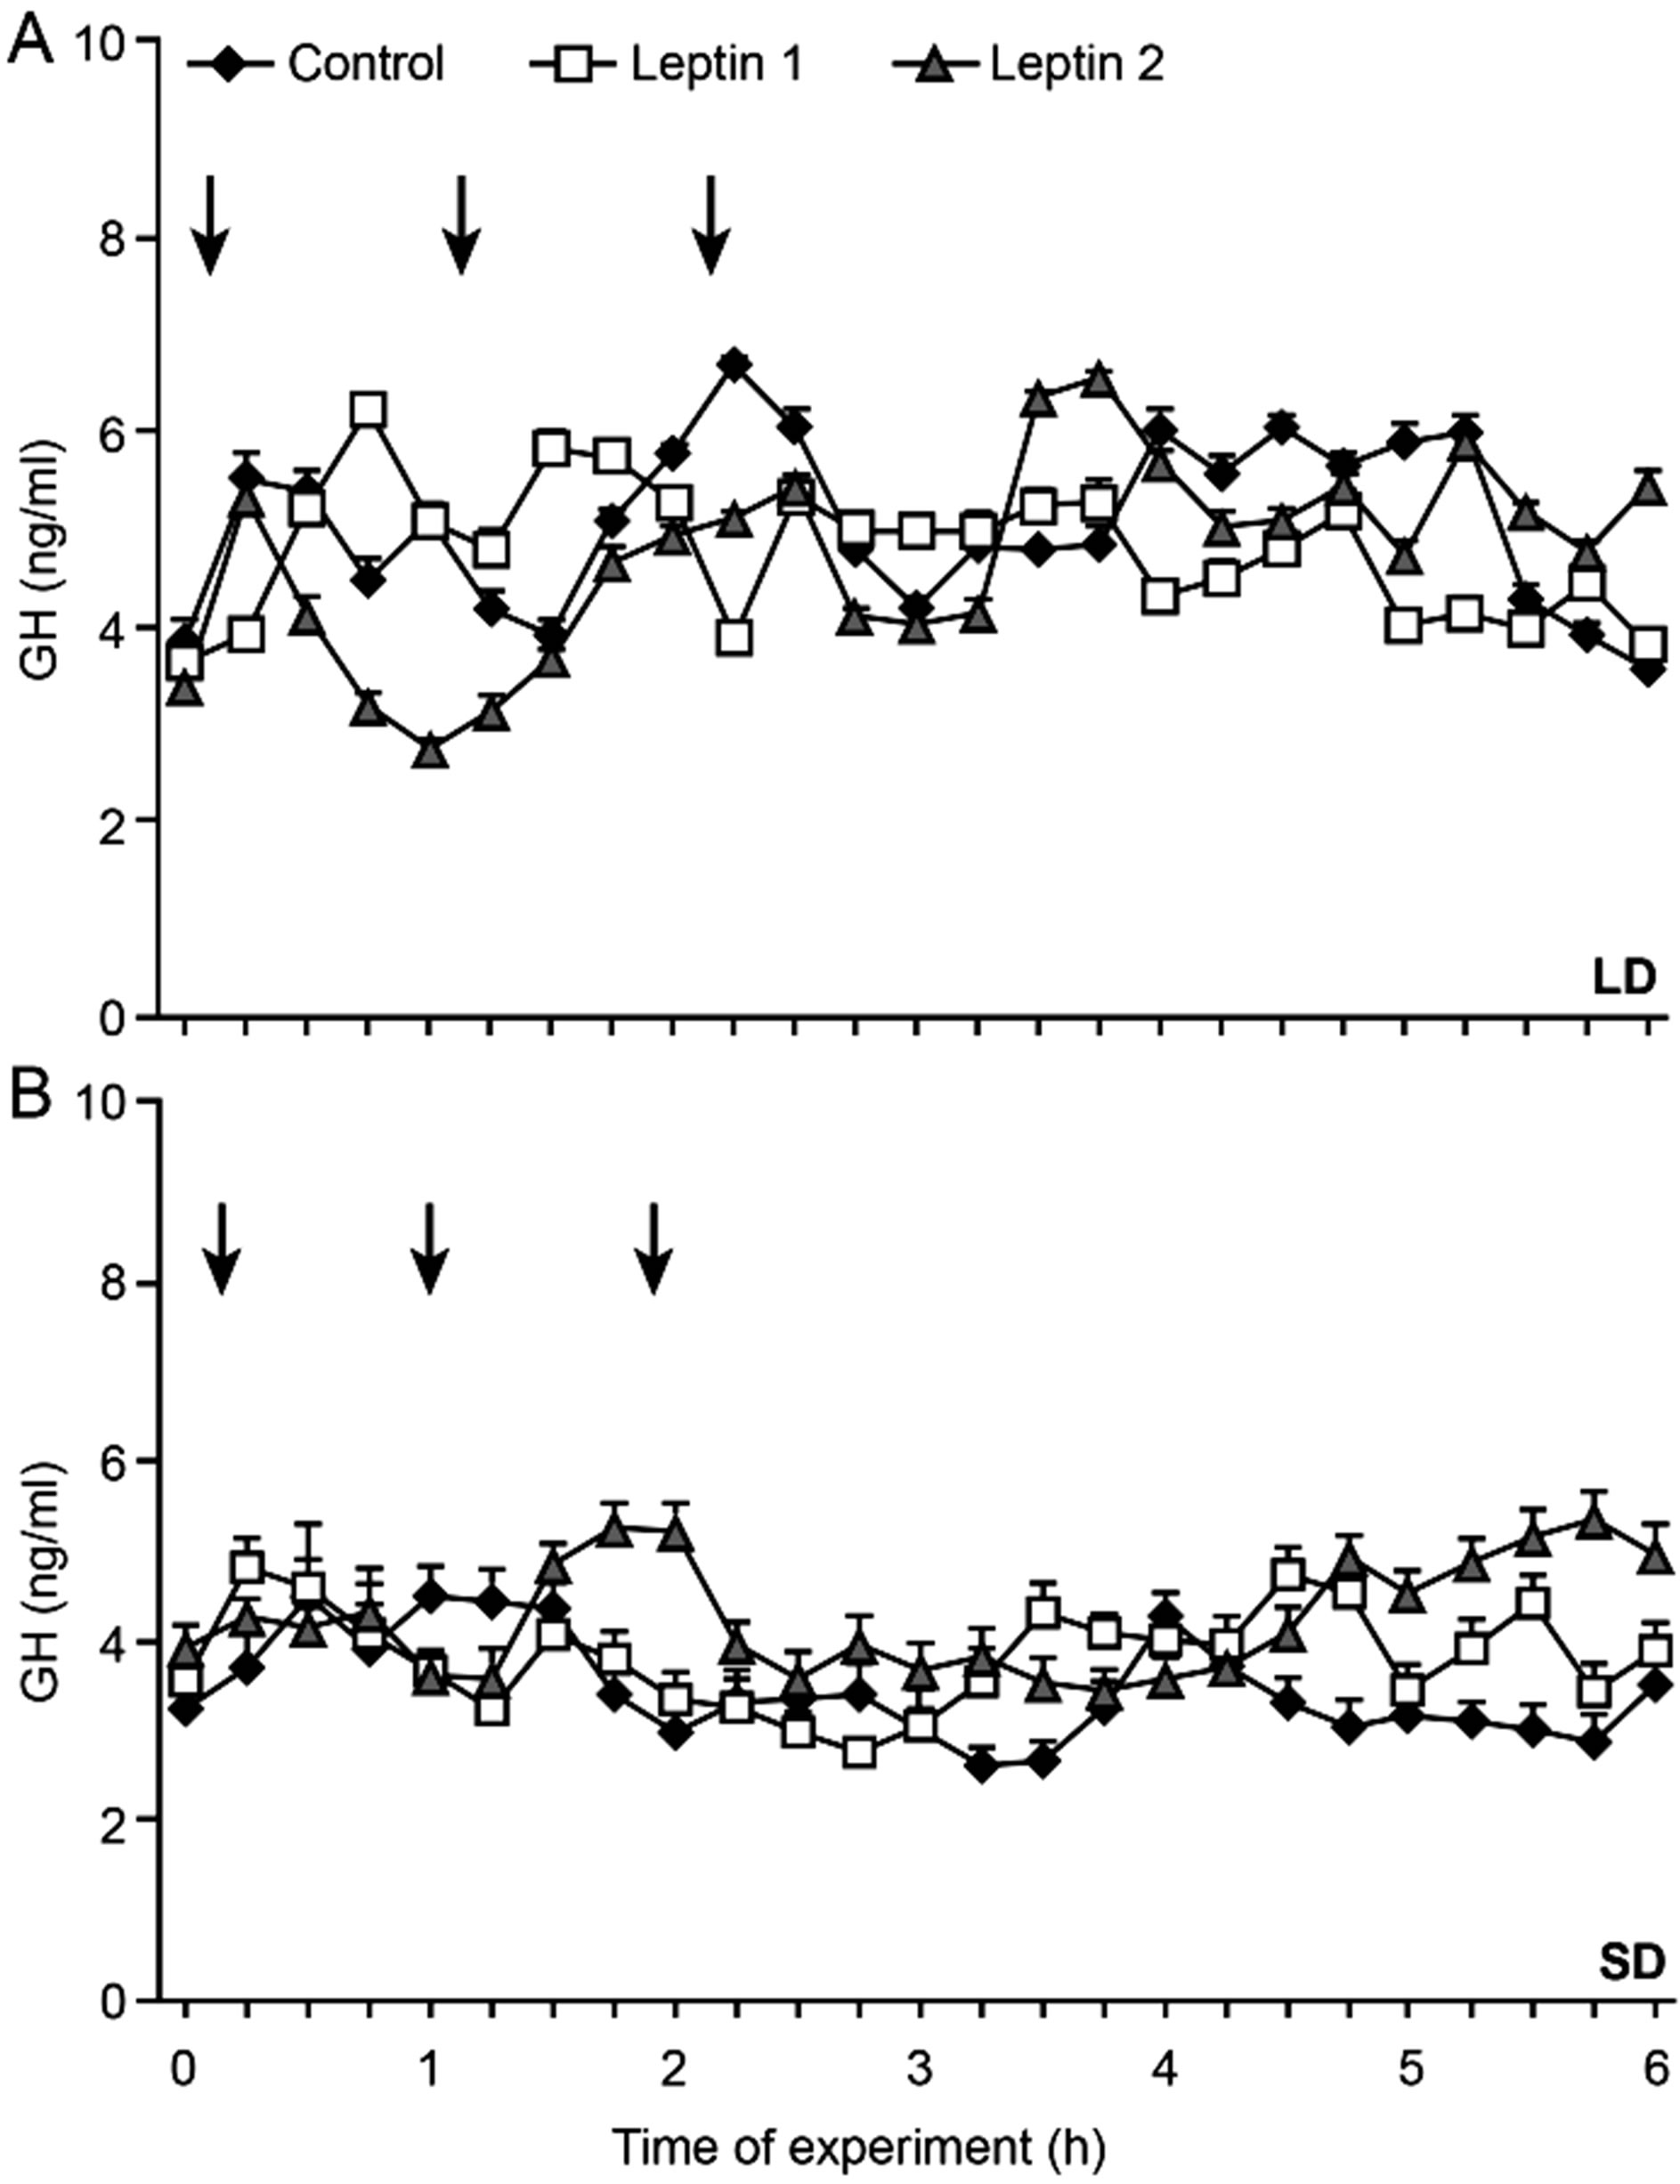
Figure 3. Mean concentrations of circulating GH in 15-min samples collected after centall infusion of Ringer-Locke buffer (Control), leptin in a dose of 0.5 mg/kg BW (Leptin 1) or 1.0 mg/kg BW (Leptin 2) during long-day (LD)—panel A and short-day (SD)—panel B, photoperiod. Arrows indicate Ringer-Locke buffer or leptin treatments.
In contrast, during the SD season, the higher dose of leptin (100 ng/ml) stimulated SOCS-3 expression in a more significant manner, which was particularly evident in the samples incubated in the presence of the hormone
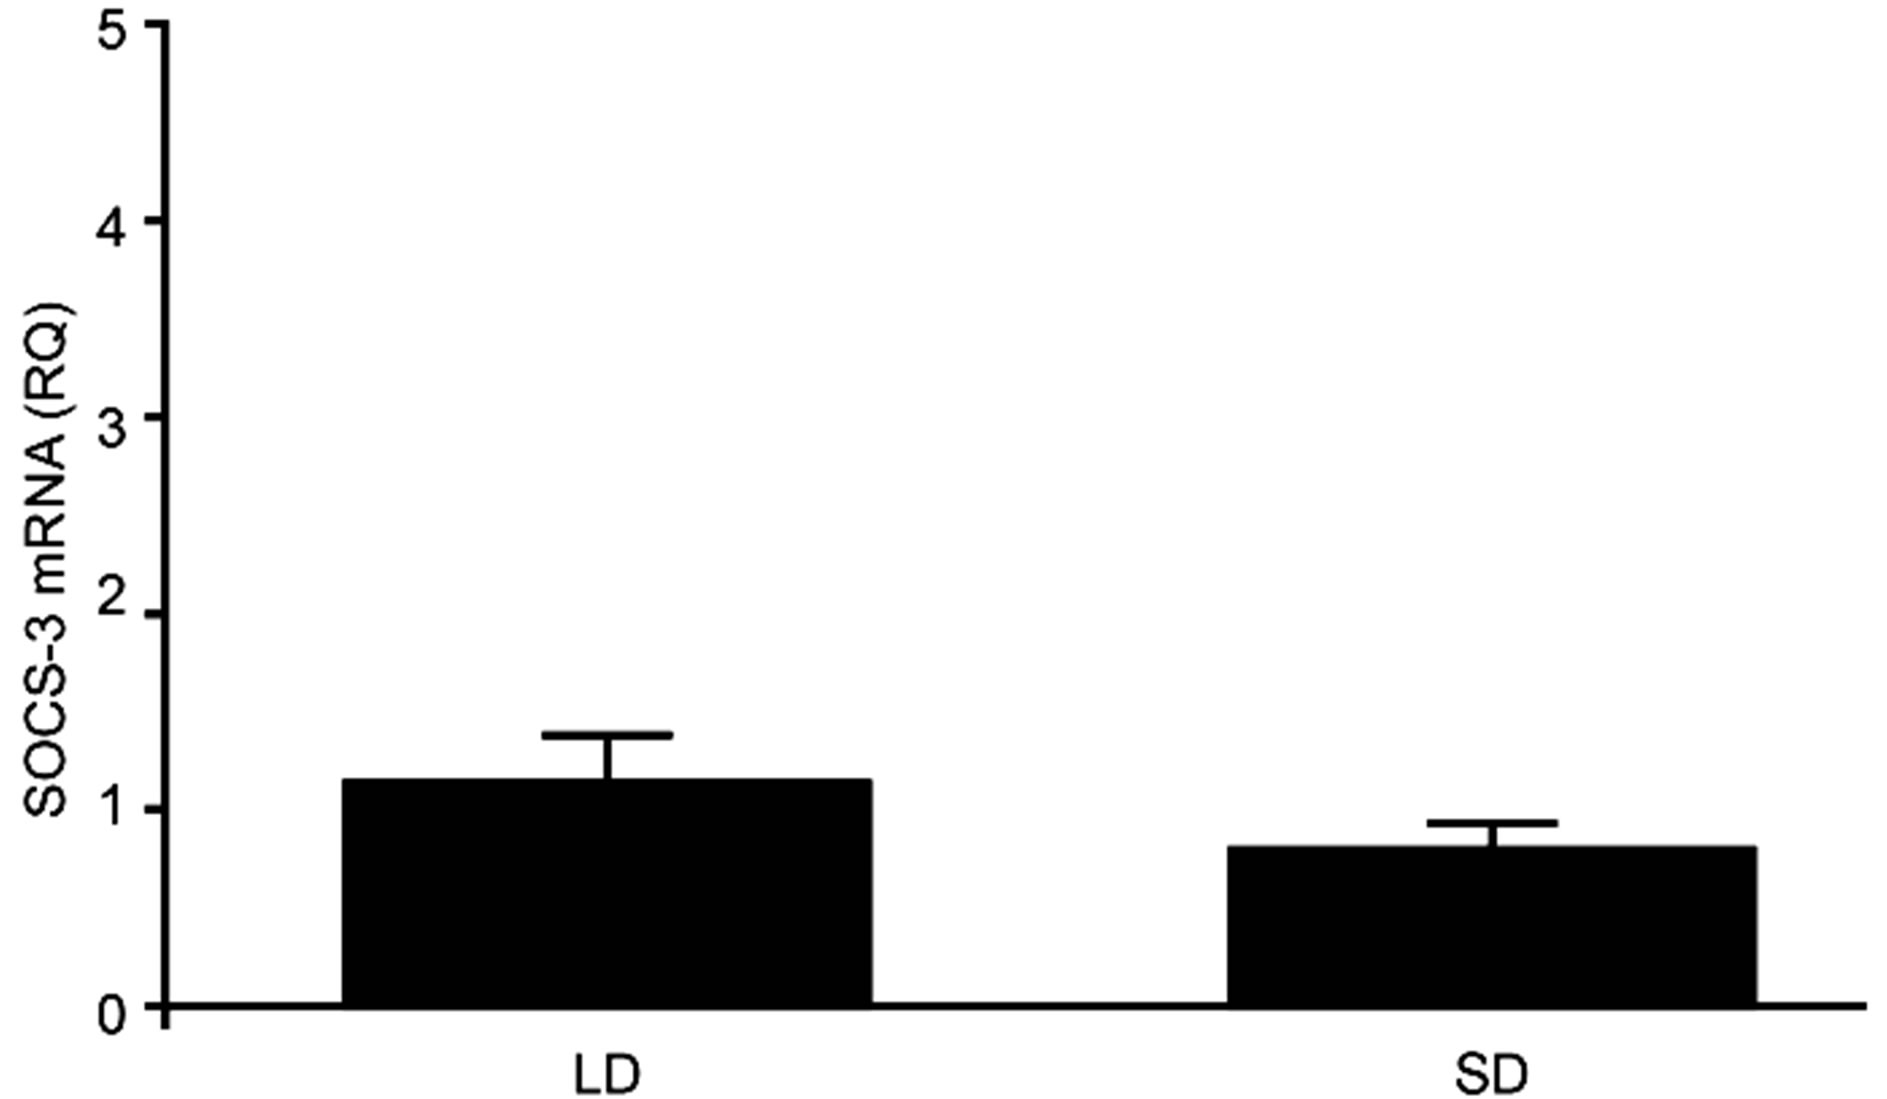
Figure 4. The mean basal expression of SOCS-3 mRNA (± SE) in ovine pituitaries collected in long-day (LD) and short-day (SD) season. Expression of SOCS-3 mRNA was reported in arbitrary units relative to cyclophiline mRNA expression. The mean value for the pituitary isolated in LD was used as the calibrator.
Figure 5. The mean expression of SOCS-3 mRNA (± SE) in the ovine pituitary explants in the presence of leptin at a concentration of 50 ng/ml (LEP 1) or 100 ng/ml (LEP 2) for tests carried out during long-day (LD) and short-day (SD) season. The mean value calculated for the control group was used as a calibrator. **p < 0.01 compared with control.
for 120 minutes (Figure 6(B)). The effect of the higher dose of exogenous hormone more significant compared to the lower dose (p < 0.001). In explants incubated for 120 minutes, we observed approximately 3-fold (Leptin 1, p < 0.001) and 4-fold (Leptin 2, p < 0.001) increases in the expression of the SOCS-3 gene compared to the control. After 60 minutes of incubation, the levels of the transcripts examined were slightly increased at the lower dose of leptin compared to the controls, whereas the transcript levels were significantly reduced in the presence of higher concentrations of the hormone (p < 0.01). Interestingly, a lower dose of leptin significantly reduced the expression of SOCS-3 (p < 0.001) by approximately 10-fold compared with the control at the 30-minute incubation.
3.2.2. GH Effects on SOCS-3 Expression
In the samples from the SD season, we observed a
Figure 6. The mean expression of SOCS-3 mRNA (± SE) in ovine pituitary explants incubated for indicated time with leptin at a concentration of 50 ng/ml (LEP 1) or 100 ng/ml (LEP 2) for experiments carried out in long-day (LD)—panel A and short-day (SD)—panel B season. The mean value calculated for the group that was not exposed to exogenous hormone (Control) was used as a calibrator. *p < 0.05 and **p < 0.01 denote differences compared with control or between indicated group.
dose-dependent (p < 0.05) stimulation of SOCS-3 expression by GH at both low (100 ng/ml, p < 0.05) and high (300 ng/ml, p < 0.001) doses compared with the control (Figure 7).
The lower dose of GH initially, at 30 (p < 0.01) and 60 (p < 0.01) minutes of incubation, decreased the levels of SOCS-3. However, after 120 minutes, the lower dose significantly (p < 0.001) stimulated SOCS-3 expression (Figure 8(B)).
A stimulating effect was also observed for explants incubated in the presence of GH at a concentration of 300 ng/ml, and this effect increased in a time-dependent manner. We observed a 30% increase in SOCS-3 mRNA levels after 60 minutes of incubation (p < 0.05) and an approximately 5-fold enhanced expression after 120 minutes of GH treatment (p < 0.001). For each time point, the SOCS-3 expression levels were higher when the tissue was incubated with the higher dose of GH compared to the lower dose, and these differences were significant (p < 0.01).
In the samples from the LD season (Figure 7), both
Figure 7. The mean expression of SOCS-3 mRNA (± SE) in the ovine pituitary explants in the presence of GH at a concentration of 100 ng/ml (GH 1) or 300 ng/ml (GH 2) for tests carried out during long-day (LD) and short-day (SD) season. Expression of SOCS-3 mRNA was reported in arbitrary units relative to cyclophiline mRNA expression. The mean value calculated for the control group was used as a calibrator. *p < 0.05, **p < 0.01 and ***p < 0.001 denote differences compared with control or between indicated group.
doses of GH significantly (p < 0.001) inhibited the expression of SOCS-3. GH elicited a significant (p < 0.001) inhibitory effect on the level of the SOCS-3 transcripts after 30 and 60 minutes of treatment, at both doses of GH (Figure 8(A)). Moreover, after 60 and 120 minutes of incubation, we observed significant (p < 0.01) differences between the effects induced by the different doses of GH. The higher dose of the hormone elicited a less significant inhibitory effect on the expression of SOCS-3 mRNA.
4. DISCUSSION
Obesity is associated with hypoadiponectinemia and leptin resistance, both of which have been implicated in the regulation of GH secretion [23]. Leptin resistance is considered to be a negative development in obesity. Obese patients not only have low basal GH output but also exhibit severely blunted responses or loss of responses to all known GH stimuli, including leptin [11]. The results of this study confirm this phenomenon by the icv infusion of leptin during the LD season, a period when sheep are leptin-insensitive and represents a state that is similar to that of obesity, with decreased GH concentrations. We have observed similar findings in a previous in vitro study (unpublished data). Several hypotheses have posited how obesity-associated leptin insensitivity might suppress GH production. These possibilities include direct pituitary actions on GH synthesis and release and/or indirect action via the modulation of hypothalamic functions or the suppression of circulating ghrelin levels—the suppressive effects of leptin on ghrelin levels was recently observed by our laboratory [24].
Figure 8. The mean expression of SOCS-3 mRNA (± SE) in ovine pituitary explants incubated for indicated time with GH at a concentration of 100 ng/ml (GH 1) or 300 ng/ml (GH 2) for experiments carried out in long-day (LD)—panel A and short-day (SD)—panel B seasons. Expression of SOCS-3 mRNA was reported in arbitrary units relative to cyclophiline mRNA expression. The mean value calculated for the group that was not exposed to exogenous hormone (Control) was used as a calibrator. **p < 0.01 and ***p < 0.001 denote differences compared with control or between indicated group.
The majority of studies investigating the effects of leptin on the secretion of hormones from the pituitary gland have focused on nutritional status as the main factor that modulates these interactions [25-28]. One of the main reasons for this focus is that the restrictive feeding of sheep increases the expression of leptin and its receptor, both in the hypothalamus and in the pituitary, suggesting that dietary restriction can increase the sensitivity of these tissues to leptin [29].
The results of these experiments demonstrated the influence of leptin infusions on GH secretion in sheep that were fed ad libitum. During the natural LD period of leptin resistance in sheep, leptin inhibited the release of GH, whereas it stimulated GH secretion during the SD period. The same effect of leptin on GH release was observed by Henry, et al. [26] in the study conducted on fed sheep. Considering the phenomenon of autosuppression in leptin signaling, the dose of leptin used in experiments appears to play an important role in determining the effect of leptin. This view is supported by our earlier experiments that were conducted in cattle, which not only showed an inhibitory effect of leptin on the secretion of GH in fed animals but also demonstrated that the effect of leptin is dose-dependent [11]. The results of that study supported the contribution of hyperleptinemia as negatively connected with GH secretion. The selective deletion of leptin receptors from somatotropic cells in mice did not affect the total cell number of the somatotroph, although there were the reduced number of GH-expressing cells and consequently GH secretion, suggesting that leptin affects GH expression and secretion but not somatotroph development [30]. A study by Luque and Kineman [31] supported the idea that a pituitary defect is a key component in the GH deficiency observed during obese states.
In addition to reduced GH secretion, the reduced expression of GH receptors in the adipose tissue of obese individuals has also been observed [4,32]. The biological activity of GH is dependent, inter alia, on the efficiency of intracellular signal transduction, which is predominantly facilitated by the Jak-2/STAT-5 signaling pathway. The effectiveness of this signaling pathway is, to a large extent, dependent on the levels of SOCS factors. GH induces the expression of multiple proteins from the SOCS family, predominantly CIS, SOCS-1, SOCS-2 and SOCS-3. The type of SOCS protein induced depends on the tissue studied. However, each of the mentioned SOCS family proteins can interact with the GHR, and when over-expressed, they can affect the Jak/STAT pathway. Thus, the role of the SOCS-3 protein in GH signaling regulation has become the subject of increasing investigation, and the results of our experiments confirm a close relationship between GH and the expression of SOCS-3 within the pituitary gland. Other studies have demonstrated the effects of GH on the expression of SOCS proteins. One year after the discovery and elucidation of the SOCS family proteins, Adams, et al. [33] demonstrated that GH can induce the expression of the SOCS-3 gene in a fibroblast cell line (F442). GH also rapidly induced SOCS-3 synthesis in mouse hepatocytes [33]. Erman, et al. [32] hypothesized that in obese patients, GHR desensitization might occur. Thus, localized GH resistance in the adipose tissue might also contribute to reduced GH-mediated signaling in obesity. The inhibition of the GHR by the SOCS-3 protein has also been demonstrated in studies that have examined the effects of GH in the mouse liver [34]. It can therefore be assumed, with a high probability, that the GH-induced increase in SOCS-3 expression within the ovine pituitary gland observed in our study might result in similar consequences.
Notably, GH can alter the expression level of SOCS-3 within a short period of time. The results of this study showed that the incubation of pituitary explants in the presence of exogenous GH was associated with changes in the expression levels of SOCS-3 that could be observed as early as 30 minutes after the addition of the hormone into the medium. These results confirm previous findings, which stated that the GH-induced expression of the SOCS-3 gene is rapid and short-lived [33].
The observations mentioned above clearly indicate a stimulating role of GH in the expression of SOCS-3 factors. The results of the experiments from our study show, however, that the precise effects of GH might not be as simple as previously thought. Interestingly, in samples collected and incubated during the season of leptin insensitivity, a clear inhibitory effect of GH on SOCS-3 mRNA levels, was observed. These unexpected results can be applied to similar situations observed in experiments in regards to the role of prolactin in the regulation of SOCS-3 expression in the sheep pituitary [4]. Interestingly, the adaptive inhibition of SOCS-3 expression observed during GH treatment, which is associated with periods of leptin sensitivity/insensitivity, was also demonstrated in studies that investigated the seasonal effects of leptin in Siberian hamsters [35].
SOCS-3 has been suggested to play one of the most significant roles in the modulation of cytokine interactions. The basal expression levels of SOCS proteins is generally low but can change rapidly under the influence of various factors, both endogenous (e.g., the influence of cytokines, hormones or growth factors) and exogenous (e.g., the influence of light [35,26] or the availability of food [36]). Interestingly, in addition to their stimulatory activity, cytokines have also been demonstrated to inhibit the transcription of genes encoding SOCS proteins. One of the most important findings in terms of the involvement of SOCS-3 in the regulation of leptin signaling was shown in a study by Bjørbæk, et al. [37]. The results of that study showed that an injection of leptin into 7-to-8-wk-old mice lacking functional genes encoding this hormone (ob/ob mice) was associated with a sudden increase in the level of SOCS-3 in the hypothalamus. In contrast, no such increase was observed for other proteins of the SOCS family, including CIS, SOCS-1 and SOCS-2 [37]. Importantly, exogenous leptin did not induce the expression of the SOCS-3 gene in db/db mice, which lack leptin receptors. These results suggested that SOCS-3, which can act as a potent inhibitor of leptin signaling, blocks leptin-induced signal transduction and might represent a potential mediator of the leptin resistance that occurs in obesity [37].
The results of this study demonstrate that the effects of leptin on the expression of SOCS-3 are more significant during the period when sheep are sensitive to leptin. During the SD season, the higher dose of hormone resulted in a doubling of the SOCS-3 expression level, whereas the lower dose resulted in a 38% increase, although this increase was not statistically significant, which is likely attributed to a significant reduction in the SOCS-3 expression levels observed in the early stages of the experiment. The nature of the effects of leptin on SOCS-3 expression might depend on the species and tissues examined and the nutritional status of the individual on which the experiment was performed. Our results are consistent with earlier work and the current state of knowledge. The direct, inducing effects of leptin on the expression of the SOCS-3 gene in the ovine pituitary were confirmed. In addition, leptin has been observed to elicit more potent effects during the SD compared to the LD season. The effects of the hormone have been detected as early as 30 minutes after its administration. These results indicate a significant correlation between leptin and SOCS-3 expression, which might explain the phenomenon of leptin resistance. These observations might contribute to our understanding of the different mechanisms responsible for the plasticity of the body’s response to various factors.
From a cognitive perspective, an important issue concerning the activities of both leptin and GH is the interaction that occurs between these hormones, as well as the expression of SOCS-3. These relationships elicit a significant impact not only on proper growth, development and reproductive processes but also for the maintenance of energy homeostasis.
Previous studies that found a relationship between nutritional status and the expression of SOCS-3 in brain regions that control food intake have indicated a close relationship among energy balance, leptin and SOCS-3 expression. Amstalden, et al. [38] examined the impact of nutritional status on the expression level of SOCS-3 in the bovine pituitary and showed that the SOCS-3 expression was increased in the adenohypophysis of animals subjected to dietary restriction [38]. Studies on the influence of both leptin and nutritional status on the SOCS-3 expression between the hypothalamus and the pituitary have indicated that these tissues might differ in their leptin sensitivity in response to the energy status of the body (Zieba, et al., 2008).
Other studies have reported different effects of leptin than those found in our experiments in terms of the SOCS-3 expression levels within the pituitary and hypothalamus of sheep that were treated with icv leptin infusions [4,14]. In addition, these experiments demonstrated that the nature of these interactions is season-dependent. Although the icv infusions of leptin affected SOCS-3 expression within both the hypothalamus and the pituitary gland of sheep, the ability of leptin to change SOCS-3 expression levels within the pituitary was detected only when the sheep were leptin-sensitive [4]. In contrast, during the LD period of leptin resistance, this activity was exclusively observed within the hypothalamus [14].
SOCS-3 induced by particular hormones likely modulates the relationship between other hormones that act through the Jak/STAT pathway. Thus, it can be concluded that the nature of the influence of a particular cytokine on SOCS-3 expression is also dependent on the presence of other compounds and that the endocrine status of the organism is another factor that can modulate this complex relationship.
5. CONCLUSION
Maintaining energy homeostasis requires the participation of a number of processes and interactions among multiple systems, including the nervous, endocrine, digestive and metabolic systems. Energy homeostasis is influenced by numerous substances, including hormones (such as leptin and GH) and factors involved in cell signaling (such as SOCS-3). Factors influencing this relationship might be of various origins, both exogenous and endogenous, and their common interactions were demonstrated in this study. Thus, a cyclical feedback loop, beginning with hypoadiponectinemia, leptin resistance and GH resistance, is associated with obesity, which suppresses GH secretion and further results in fat accumulation, might represent an important factor in the pathogenesis of obesity. The decreased action of GH in obesity might contribute to the associated metabolic abnormalities. Understanding the role of GH in physio= logical and pathological states might contribute to the development of new therapeutic strategies.
6. ACKNOWLEDGEMENTS
The authors would like to sincerely thank to Dr. Katarzyna Romanowicz for GH determination. The study was supported by BM/4232/2013.
REFERENCES
- Makimura, H., Stanley, T., Mun, D., You, S.M. and Grinspoon, S. (2008) The effects of central adiposity on growth hormone (GH) response to GH-releasing hormone-arginine stimulation testing in men. Journal of Clinical Endocrinology and Metabolism, 93, 4254-4260. doi:10.1210/jc.2008-1333
- Weltman, A., Weltman, J.Y., Watson, et al. (2008) Effects of continuous versus intermittent exercise, obesity, and gender on growth hormone secretion. Journal of Clinical Endocrinology and Metabolism, 93, 4711-4720. doi:10.1210/jc.2008-0998
- Cornford A.S., Barkan A.L. and Horowitz J.F. (2011) Rapid suppression of growth hormone concentration by overeating: Potential mediation by hyperinsulinemia. Journal of Clinical Endocrinology and Metabolism, 96, 824-830. doi:10.1210/jc.2010-1895
- Szczesna, M., Zieba, D.A., Klocek-Gorka, B., Misztal, T. and Stepien, E. (2011) Seasonal effects of central leptin infusion and prolactin treatment on pituitary SOCS-3 gene expression in ewes. Journal of Endocrinology, 208, 81-88. doi:10.1677/JOE-10-0282
- Yu, W.H., Kimura, M., Walczewska, A., Karanath, S. and McCann, S.M. (1997) Role of leptin in hypothalamicpituitary function. Proceedings of National Academy of Sciences USA, 94, 1023-1028. doi:10.1073/pnas.94.3.1023
- Yu, W.H., Walczewska, A., Karanath, S. and McCann, S.M. (1997) Nitric oxide mediates leptin-induced luteinizing hormone-releasing hormone (LHRH) and LHRH and leptin-induced LH release from the pituitary gland. Endocrinology, 138, 5055-5058. doi:10.1210/en.138.11.5055
- Roh, S., Clarke, I.J., Xu, R., et al. (1998) The effect of leptin on basal and growth hormone-releasing hormone-stimulated growth hormone secretion from the ovine pituitary gland. Neuroendocrinology, 68, 361-364. doi:10.1159/000054385
- Amstalden, M., Garcia, M.R., Stanko, R.L., et al. (2002) Central infusion of recombinant ovine leptin normalizes plasma insulin and stimulates a novel hypersecretion of luteinizing hormone after short-term fasting in mature beef cows. Biology of Reproduction, 66, 1555-1561. doi:10.1095/biolreprod66.5.1555
- Zamorano, P.L., Mahesh, V.B., De Sevilla, L.M., et al. (1997) Expression and localization of the leptin receptor in endocrine and neuroendocrine tissues of the rat. Neuroendocrinology, 65, 223-228. doi:10.1159/000127276
- Iqbal, J., Pompolo, S., Considine, R.V. and Clarke, I.J. (2000) Localization of leptin receptor-like immunoreactivity in the corticotropes, somatotropes, and gonadotropes in the ovine anterior pituitary. Endocrinology, 141, 1515-1520. doi:10.1210/en.141.4.1515
- Zieba, D.A., Amstalden, M., Morton, S., et al. (2003) Effects of leptin on basal and GHRH-stimulated GH secretion from the bovine adenohypophysis are dependent upon nutritional status. Journal of Endocrinology, 178, 83-89. doi:10.1677/joe.0.1780083
- Bjorbaek, C., Lavery, H.J. and Bates, S.H. (2000) SOCS- 3 mediates feedback inhibition of the leptin receptor via Tyr 985. Journal of Biological Chemistry, 275, 40649- 40657. doi:10.1074/jbc.M007577200
- Greenhalgh, C.J., Metcalf, D., Thaus, A.L., et al. (2005) Biological evidence that SOCS-2 can act either as an enhancer or suppressor of growth hormone signaling. Journal of Biological Chemistry, 277, 40181-40184. doi:10.1074/jbc.C200450200
- Zieba, D.A., Szczesna, M., Klocek-Gorka, B., et al. (2008) Seasonal effects of central leptin infusion on secretion of melatonin and prolactin and on SOCS-3 gene expression in ewes. Journal of Endocrinology, 198, 147-155. doi:10.1677/JOE-07-0602
- Russel, A.J.F., Doney, J.M. and Gunn, R.G. (1969) Subjective assessment of body fat in live sheep. Journal of Agricultural Science, 72, 451-454. doi:10.1017/S0021859600024874
- Norms. (1993) Nutrient requirements for cattle and sheep in the traditional system. Krakow, (in Polish).
- Zieba, D.A., Amstalden, M., Morton, S., Keisler, D.H. and Williams, G.L. (2004) Regulatory roles of leptin at the hypothalamic-hypophyseal axis before and after sexual maturation in cattle. Biology of Reproduction, 71, 804-812. doi:10.1095/biolreprod.104.028548
- Zieba, D.A., Kirsz, K., Molik, E., Romanowicz, K. and Wojtowicz, A.K. (2011) Effects of orexigenic peptides and leptin on melatonin secretion during different photoperiods in seasonal breeding ewes. An in vitro study. Domestic Animal Endocrinology, 40, 139-146. doi:10.1016/j.domaniend.2010.09.008
- Traczyk, W. and Przekop, F. (1963) Methods of investigation of the function of the hypothalamus and hypophysis in chronic experiment in sheep. Acta Physiologica Polonica, 14, 217-226.
- Zieba, D.A., Amstalden, M., Maciel, M.N., et al. (2003) Divergent effects of leptin on luteinizing hormone and insulin secretion are dose dependent. Experimental Biology and Medicine, 228, 325-330. http://ebm.sagepub.com/content/228/3/325
- Adam, C.L., Findlay, P.A. and Miller, D.W. (2006) Blood-brain leptin transport and appetite and reproductive neuroendocrine responses to intracerebroventricular leptin injection in sheep: Influence of photoperiod. Endocrinology, 147, 4589-4598. doi:10.1210/en.2006-0576
- Dvorak, P., Becka, S., Krejci, P. and Chrpova, M. (1978) Radioimmunoassay of bovine growth hormone. Radiochemical and Radioanalytical Letters, 34, 160-166.
- Myers, M.G., Jr, Leibel, R.L., Seeley, R.J. and Schwartz, M.W. (2010) Review: Obesity and leptin resistance: Distinguishing cause from effect. Trends in Endocrinology and Metabolism, 11, 643-651. doi:10.1016/j.tem.2010.08.002
- Kirsz, K., Szczesna, M., Molik, E., et al. (2012) Seasonal changes in the interactions between leptin, ghrelin and orexin in sheep. Journal of Animal Science, 90, 2524- 2531. doi:10.2527/jas.2011-4463
- Henry, B.A., Goding, J.W., Alexander, W.S., et al. (1999) Central administration of leptin to ovariectomised ewes inhibits food intake without affecting the secretion of hormones from pituitary gland: Evidence for a dissociation of effects on appetite and neuroendocrine function. Endocrinology, 140, 1175-1182. doi:10.1210/en.140.3.1175
- Henry, B.A., Goding, J.W., Tilbrook, A.J., Dunshea, F. and Clarke, I.J. (2001) Intracerbroventicular infusion of leptin elevates the secretion of luteinizing hormone without affecting food intake in long-term food-restricted sheep, but increases growth hormone irrespective of body weight. Journal of Endocrinology, 168, 67-77. doi:10.1677/joe.0.1680067
- Nagatani, S., Zeng, Y., Keisler, D.H., Foster, D.L. and Jaffe C.A. (2000) Leptin regulates pulsatile luteinizing hormone and growth hormone secretion in sheep. Endocrinology, 141, 3965-3975. doi:10.1210/en.141.11.3965
- Morrison, C.D., Daniel, J.A., Holmberg, B.J., et al. (2001) Central infusion of leptin into well-fed and undernourished ewe lambs: Effects on feed intake and serum concentrations of growth hormone and luteinizing hormone. Journal of Endocrinology, 168, 317-323. doi:10.1677/joe.0.1680317
- Dyer, C.J., Simmons, J.M., Matteri, R.L. and Keisler, D.H. (1997) Leptin receptor mRNA is expressed in ewe anterior pituitary and adipose tissues and is differentially expressed in hypothalamic regions of well-fed and feedrestricted ewes. Domestic Animal Endocrinology, 14, 119-128. doi:10.1016/S0739-7240(96)00119-1
- Childs, G.V., Akhter, N., Haney, A., et al. (2011) The somatotrope as a metabolic sensor: Deletion of leptin receptors causes obesity. Endocrinology, 152, 69-81. doi:10.1210/en.2010-0498
- Luque, R.M. and Kineman, R.D. (2006) Impact of obesity on the growth hormone axis: Evidence for a direct inhibitory effect of hiperinsulinemia on pituitary function. Endocrinology, 147, 2754-2763. doi:10.1210/en.2005-1549
- Erman, A., Veilleux, A., Tchernof, A. and Goodyer, C.G. (2011) Human growth hormone receptor (GHR) expression in obesity: I. GHR mRNA expression in omental and subcutaneous adipose tissues of obese women. International Journal of Obesity, 35, 1511-1119. doi:10.1038/ijo.2011.23
- Adams, T.E, Hansen, J.A, Starr, R., et al. (1998) Growth hormone preferentially induces the rapid, transient expression of SOCS-3, a novel inhibitor of cytokine recaptor signaling. Journal of Biological Chemistry, 273, 1285-1287. doi:10.1074/jbc.273.3.1285
- Paul, C., Seiliez, I., Thissen, J.P. and Le Cam, A. (2000) Regulation of expression of the rat SOCS-3 gene in hepatocytes by growth hormone, interleukin-6 and glucocorticoids mRNA analysis and promoter characterization. European Journal of Biochemistry, 267, 5849-5857. doi:10.1046/j.1432-1327.2000.01395.x
- Tups, A., Ellis, C., Moar, K.M., et al. (2004) Photoperiodic regulation of leptin sensitivity in the Siberian hamster, Phodopus sungorus, is reflected in arcuate nucleus SOCS-3 (Suppressor of Cytokine Signaling) gene expression. Endocrinology, 145, 1185-1193. doi:10.1210/en.2003-1382
- Denis, R.P.G., Bing, C., Brocklehurst, S., et al. (2004) Diurnal changes in hypothalamic neuropeptide and SOCS-3 expression: Effects of lactation and relationship with serum leptin and food intake. Journal of Endocrinology, 183, 173-181. doi:10.1677/joe.1.05659
- Bjorbaek, C., Elmquist, J., Frantz, J., Shoelson, S. and Flier, J. (1998). Identification of SOCS-3 as a potential mediator of central leptin resistance. Molecular Cell, 1, 619-625. doi:10.1016/S1097-2765(00)80062-3
- Amstalden, M., Spencer, T.E., Harms, P.G. and Williams, G.L. (2005) Expression of leptin receptor and suppressor of cytokine signaling-3 genes in adenohypophysis of normal-fed and fasted cows. Reproductive Biology, 5, 237- 245.