Health
Vol.4 No.12A(2012), Article ID:26073,7 pages DOI:10.4236/health.2012.412A204
Health production and risk of obesity among Chilean adolescents: Understanding health related behaviors in youth
![]()
1Department of Applied Economics II, Rey Juan Carlos University, Madrid, Spain; *Corresponding Author: paulina.correa.burrows@urjc.es
2Institute of Nutrition and Food Technology, University of Chile, Santiago de Chile, Chile
3Department of Population Health, London School of Hygiene and Tropical Medicine, London, UK
Received 13 September 2012; revised 21 October 2012; accepted 28 October 2012
Keywords: Adolescent Health; Adolescent Obesity; Health Behavior; Health Promotion; Non-Communicable Diseases; Chile
ABSTRACT
Background: Adolescent obesity is associated with high cardiovascular and metabolic risk. Western diet and reduced physical activity are strong environmental determinants. The “Health Production” model posits that individuals born with a certain amount of health stock, which depreciates over life, but can be augmented by individual behaviors, including exercise and dieting. Objective: To study the association between health production and obesity in a random sample of 1692 Chilean adolescents (14.8 ± 0.7 years old), and to study the effect of gender and socioeconomic characteristics on health production. Method: We used an indicator that considered the quality of food intake and physical activity, establishing three categories: good (GHP), intermediate (IHP) and poor health producers (PHP). Multivariate analysis was used to study the odds of obesity and good health production. Results: There was 31% of GHP, 32% of IHP and 38% of PHP. Obesity (Adj. OR: 1.59; 95%CI: 1.04 - 2.42) and abdominal obesity (Adj. OR: 2.24; 95%CI: 1.35 - 3.40) were significantly higher in the PHP group, compared to the GHP and IHP group. Health production was significantly associated with socioeconomic factors and gender. Female sex and coming from a less wealthy household significantly reduced the odds of good health production. Conclusions: Poor health production in adolescence, as defined by food intake and physical activity, depreciates individuals’ “health stock”, increasing the risk of obesity. In our sample, health production was strongly associated with socioeconomic factors and gender.
1. INTRODUCTION
In the last two decades, Chile has undergone a remarkable nutritional and epidemiological transition, with a significant increase of obesity and related co-morbidities, as a result of Western dietary patterns and reduced physical activity [1,2]. It ranks fourth among OECD countries with the highest prevalence of obesity (25%), after the US (34%), Mexico (30%) and New Zealand (27%) [3]. Relying on data from the last National Health Survey [4], prevalence of obesity is higher in women of all age groups (average rate of 30.7%), and in low education level groups (35.5%). Since obesity and overweight rate rose from 61% in 2003 to 67% in 2010, so did the prevalence of T2DM (from 6.3% to 9.4%), while 3.6 million (or 27%) suffered from HTA [4]. The burden of diseases could increase in coming years since obesity at early stages-especially central obesity, is associated with insulin resistance as well as high cardiovascular and metabolic risk [5-8]. Indeed, the prevalence of obesity in Chilean children and adolescents grown from 4.5% to 20% over the time period 1985-2004 [9,10].
As obesity and related co-morbidities pave the way for significant additional healthcare costs as well as social and individual welfare losses, they have become major public health concerns in both developed and developing countries [11,12]. While efforts have focused on medical treatment of obesity and associated diseases, encouraging behaviors that increase the stock of health in young populations have been persistently put off as a public policy strategy.
It is possible to approach differences in health status using the “Health Production” model, developed in the early 1970s [13,14]. The level of health depends on the amount of inputs and time individuals allocate to the production of health. Initially, an individual is born with a certain amount of “health stock”, which is affected by genes and environment. This stock depreciates over life, but can be augmented by individual behaviors, including exercise and dieting. The model identifies returns on the accumulation of “health capital”, i.e. an increase in the amount of productive time (or “healthy days”), and greater efficiency in combining goods and time in order to produce health.
While this model is foremost a tool for economic analysis, it has clear public health implications. On the one hand, overweight and obesity would be, to some extent, the result of individual behavioral choices, since individuals make consumption choices that may have either positive or negative effects on their net “health stock”. On the other hand, “health stock” is built up over the life course; therefore, the development of “health capital” might be encouraged from early stages. In fact, both the seminal model and subsequent updates underscore the importance of education and the role of family. While the lack of education and poverty are associated with a higher prevalence of non-communicable chronic diseases [15-19], investment in children’s health depends on parental time as well as parental decisions concerning the demand of goods and services that affect their children’s health [20,21].
Whereas past empirical research on the “health production” model have focused on medical care, less attention has been devoted to the role of non-medical goods, like physical activity and food intake. Similarly, there is a lack of evidence concerning the production of health among children and adolescents. This paper aims at improving the understanding on how adolescents produce health through non-medical goods. To do so, we first studied the association between nutritional status and central obesity with the quality of health production, as defined by food intake and physical activity. Then, we examined the relation between health production and gender and socioeconomic characteristics. Particular emphasis was devoted to examining the odds of good health production as we understand that the achievement of such a profile should be a public health goal.
2. METHOD
2.1. Population
The Research Ethics Committee of the Institute of Nutrition and Food Technology (INTA) at the University of Chile approved this study. A random sample of 1692 high-school students (14.8 ± 0.7 years old) from urban Santiago was taken to study the production of health using an indicator that considered the quality of food intake and physical activity, and established three categories of health producers. Data were collected in 2003-2004, in publicly funded, partially subsidized and privately funded schools.
2.2. Measurements
Standardized procedures were used to measure weight to the closest 0.1 Kg, using a SECA scale, and height to the closest 0.1 cm, using a Holtain stadiometer. Body Mass Index (BMI = Kg/m2) was calculated from body weight and height. Waist circumference (WC) was measured with non-elastic flexible tape at the high point of the iliac crest around the abdomen and recorded to 0.1 cm. All measurements were taken twice, with a third measurement if the difference between the first two exceeded 0.3 kg for weight and 0.5 cm for height and waist. Obesity (BMI ≥ 95th percentile) and abdominal obesity (WC ≥ 90th percentile and WC ≥ 80 cm in women or ≥ 94 cm in men) were diagnosed according to CDC/NCHS 2000, NHANES III/USA and IDF criteria, respectively.
Food intake (FI) and physical activity (PA) habits were assessed by two standardized tests made up of five items each. Every item ranged 0 - 2, so total score per test ranged 0 - 10, with higher scores denoting better quality of habits [22,23]. The quality of food intake was measured by the amount of saturated fat, fiber, sugars and salt in the food the individual consumed. The quality of physical activity was measured by the total amount of time spent per activity. In order to measure the production of health, our indicator considered a total of 8 items: 5 from the FI test and 3 from the PA test, in a scale from 0 to 8 points, according to the following score pattern: 1) Number of daily meals (<4 = 0 and ≥4 = 1); 2) Nutritional quality of breakfast (<1.5 points = 0 and ≥1.5 points = 1); 3) Nutritional quality of lunch (<1.5 points = 0 and ≥1.5 points = 1); 4) Nutritional quality of dinner (<1.5 points = 0 and ≥1.5 points = 1); 5) Nutritional quality of snacks (<1.5 points = 0 and ≥1.5 points = 1); 6) Time spent in class, studying and screen-based entertainment (≥10 h = 0 and <10 h = 1); 7) Hours of daily recreational activity (<1 h = 0 and ≥1 h = 1); 8) Hours of weekly scheduled exercise (<4 h = 0 and ≥4 h = 1). Finally, three categories of health production were defined according to the percentile distribution of this health production indicator; p25th, p50th and p75th were used as thresholds denoting poor health producers (PHP), intermediate health producers (IHP), and good health producers (GHP).
Information concerning socioeconomic characteristics was collected by standardized interviews administered by a physician and measured through 3 items (educational level and labor activity of parents, and household equipment), each rating in a 0 to 5 scale (1 = High level; 2 = Mid-high level; 3 = Middle level; 4 = Mid-low level and 5 = Low level).
2.3. Statistical Analysis
Variables with normal distribution were expressed as mean and standard deviation, while those with nonnormal distribution as median and interquartile range. Kruskal-Wallis rank sum test was performed to compare them, according to categories of “health production”. Chi2 test (Pearson) was used to study the association between health production and obesity and abdominal obesity. Logistic regression models were used to estimate the odds of obesity and abdominal obesity (outcomes) after adjusting for selected covariates denoting health production, gender, type of school and socioeconomic characteristics (exposures). To estimate the odds of behaving as GHP we used binary outcome models. Gender, type of school and socioeconomic characteristics of household were used as covariates. Overall signifycance, goodness of fit and sensitivity/specificity were tested. Statistical analysis was performed in Stata for Windows version 10.0 (Lakeway Drive College Station, TX, US). A p value of ≤0.05 denoted statistical significance.
3. RESULTS
There was 31% of GHP, 32% of IHP and 38% of PHP, while 98% of the whole sample had 4 points or less (score ranging 0 - 8). Table 1 describes the general characteristics of the sample according to the production of health. Adolescents behaving as GHP (≥3 points) showed significantly higher values in height z-score, and lower values in BMI z-score and WC than adolescents behaveing as IHP (2 points) and PHP (≤1 point). On the other hand, there was a significantly higher prevalence of obesity and abdominal obesity (ATP III and IDF) to lower health production (p < 0.001; p < 0.001; p < 0.01) (Table 2).
Percentage of PHP was significantly higher at lower SES, education and activity of household head as well as among women and adolescents attending public schools (Table 3).
After adjusting for gender and socioeconomic characteristics, adolescents behaving as PHP showed a significantly higher risk of obesity compared to adolescents behaving as GHP (OR: 1.59; 95%CI: 1.04 - 2.42). Similarly, poor health production and intermediate health production significantly increased the odds of abdominal obesity in comparison to good health production (Table 4).
Odds of GHP significantly reduced at lower SES (adjusted OR: 0.46; 95%CI: 0.26 - 0.82 for Low SES), education level of household head (OR: 0.39; 95%CI: 0.22 - 0.71 for the lowest instruction level), and activity of household head (OR: 0.43; 95%CI: 0.25 - 0.74 for the
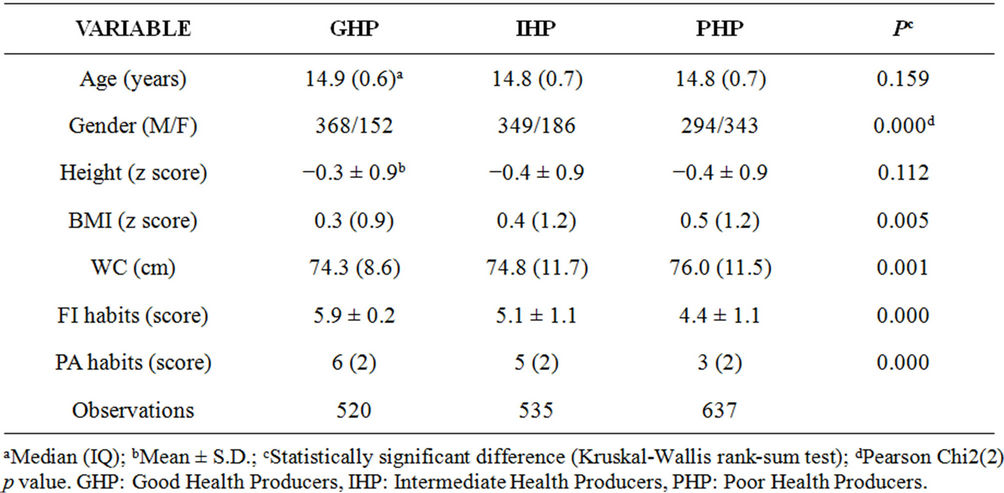
Table 1. Descriptive statistics (n = 1692).
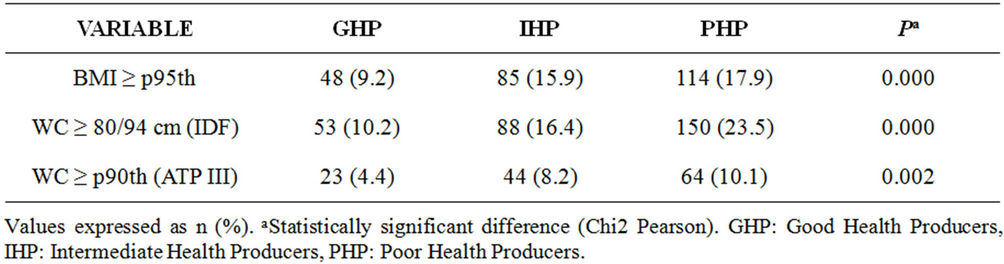
Table 2. Prevalence of obesity and abdominal obesity by health production profile.
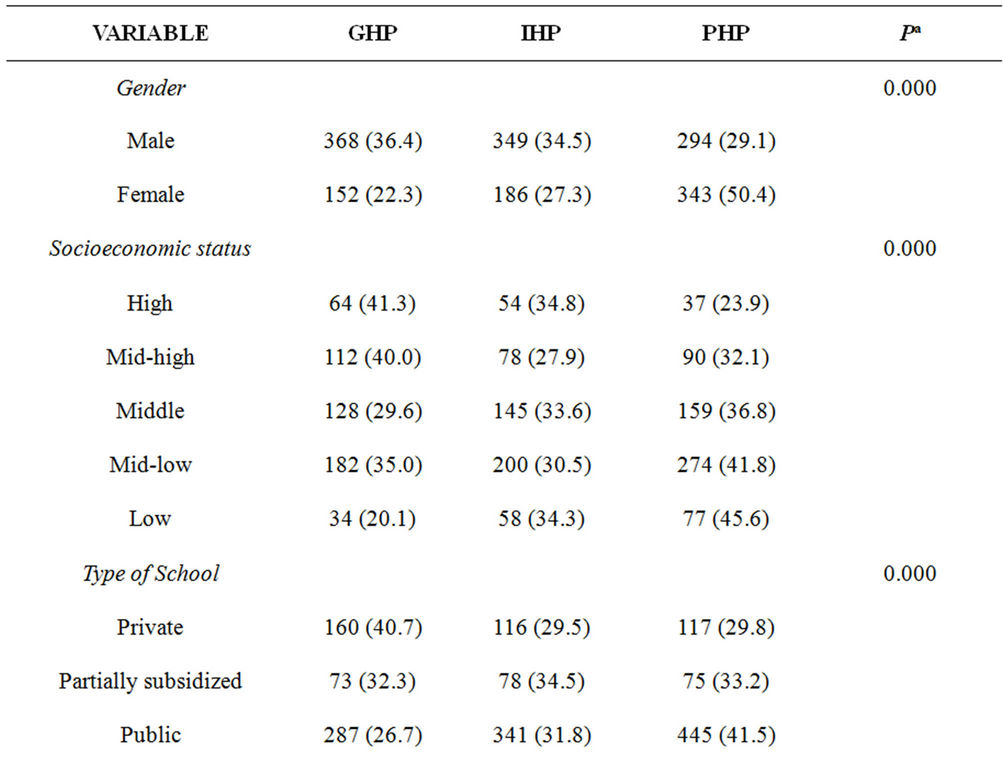

Table 3. Health Production Profile by gender and SES charac-teristics.
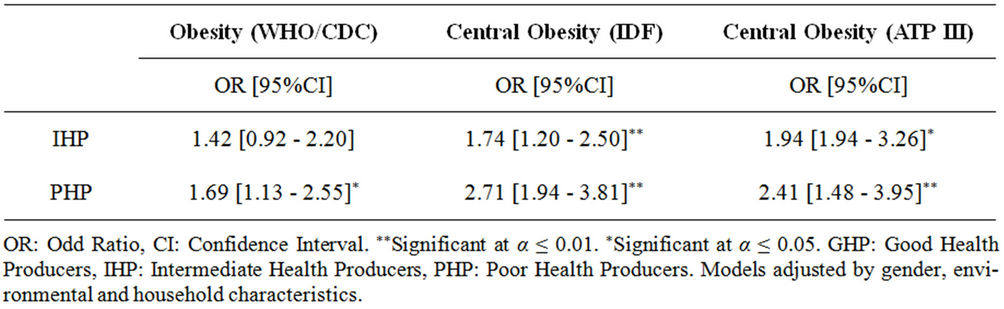
Table 4. Risk of suffering from obesity according to different standards (n = 1692).
unskilled group). The association between type of school and the likelihood of behaving as GHP was also significant.
Adolescents attending publicly funded schools showed the lowest probability of behaving as GHP. In those adolescents, the odds were 48% of that in adolescents attending private schools (95%CI: 0.34 - 0.66).
While in adolescents attending partially subsidized schools, the odds of GHP were 61% that of adolescents attending privately-controlled centers (95%CI: 0.36 - 0.57) (Table 5). Finally, in female adolescents the likelihood of behaving as GHP was significantly lower than male adolescent. In fact, that probability was less than half that of males (OR: 0.47; 95%CI: 0.37 - 0.59).
4. DISCUSSION
4.1. Findings and Implications
Our results support the association between obesity and the quality of health production as defined by food intake and physical activity. Incentives to increase the
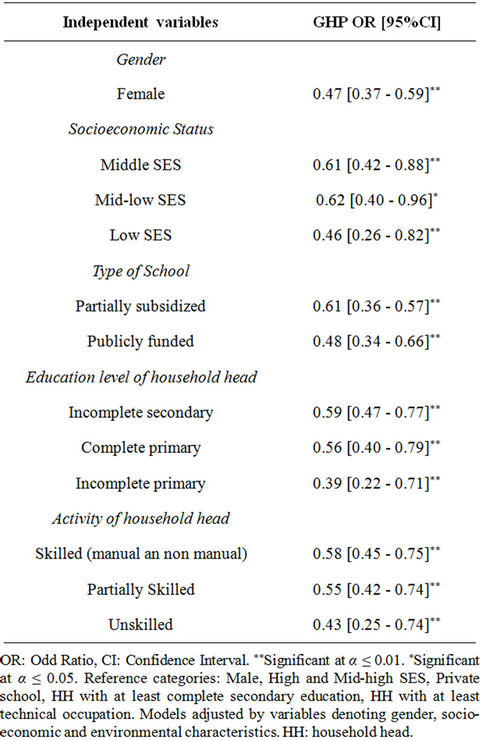
Table 5. Relation between GHP and gender and socioeconomic characteristics in adolescents (n = 1692).
amount of “health stock” since early stages may be a useful strategy to address overweight and obesity. As this would be the source of several positive outcomes, to what extent should government institutions play an enabling role in “health production”? Our results show that young individuals seem not to be aware about the effects of unhealthy behaviors, so they are less likely to engage in health promoting activities. On the other hand, a high prevalence of poor health production means that the provision of health capital in adolescents is far from socially optimal, when decisions are made at the individual level. And last but not least, these trends appear to be quite general in countries undertaking nutritional and epidemiological transitions [24,25].
In the current context, several other reasons support the case for “health production” through healthy dieting and exercise. First, life expectancy reached nearly 80 years in 2009 across OECD countries. Secondly, health spending in these countries tends to rise faster than the economic growth, and is expected to keep this trend as aging population and non-communicable chronic diseases remain increasing at the current rates. In addition, the growing burden of out-of-pocket health spending (i.e. over 40% of total Chilean health spending in the 2000s) creates important disparities in health financial protecttion [26,27]. Finally, government budget constraints will keep getting harder as deficit and debt control remain major economic goals.
Another interesting finding from our research has to do with the socioeconomic and gender disparities in the production of health through non-medical consumption goods. Indeed, socioeconomic factors and gender would be strongly associated in young populations with the quality of this kind of health production. Chilean adolescents are at a disadvantage in the production of health when they are women, attend public schools, come from less wealthy households or when their parents have low and mid-low instruction and labor activity levels.
These findings strongly support the conclusions reached by investigations based on the “Health Production” model concerning the link of education and poverty with the prevalence of non-communicable chronic disorders [15-19].
4.2. Limitations and Strengths
This study has several limitations. First, data was collected in schools from urban Santiago, so our sample is not nationally representative. However, the city of Santiago concentrates more than 40% of Chilean high school students. On the other hand, it is in urban areas where young people are more exposed to unhealthy way of lives. Secondly, we assessed health production based on data collected almost a decade ago. Yet, the latest National Health Survey showed that obesity keeps growing while lifestyles have worsened in all age groups. Third, and due to data constraint, we were unable to link the production of health as defined by food intake and physical activity good in adolescents with cardiovascular risk factors. In order to associate the production of health and the risk of certain chronic diseases, this might be the aim of subsequent research.
Yet this paper provides new insights into the production of health, focusing on inputs over which individuals are able to have control, such as food intake and physical activity. On the other hand, these non-medical inputs enable to delay the onset of a range of non-communicable chronic diseases at a relatively lower cost in comparison to medical care. Thus, in the current situation, the “health production” model remains a useful research and policymaking tool for designing, analyzing and assessing public health strategies to prevent and control overweight and obesity. Since our results support the role of socioeconomic factors and provides some evidence concerning the role of gender in the production of health, focused policies are needed to encourage healthy behaveiors in adolescent women and students coming from less wealthy households. Relying on our results, we believe that such policies should be carried out within the scholar system, mostly when incentives to commit time and resources in health promotion at the household level appear not to be enough. In addition to promote equity in “health production”, this would improve adherence and reduce administrative costs.
5. ACKNOWLEDGEMENTS
This research received financial support from the Children Health Programme (DID-SAL-2003), University of Chile, and the Spanish Commission of Science and Technology under grant ECO-2010-21668- C03-01.
REFERENCES
- Vio, F., Albala, C. and Kain, J. (2008) Nutrition transition in Chile revisited. Mid-term evaluation of obesity goals for period 2000-2010. Public Health Nutrition, 11, 405- 412. doi:10.1017/S136898000700050X
- Cecchini, M., Sassi, F., Lauer, J., Lee, Y., Guajardo-Barron, V. and Chisholm, D. (2010) Tackling of unhealthy diets, physical inactivity, and obesity: Health effects and cost-effectiveness, The Lancet, 376, 1775-1784. doi:10.1016/S0140-6736(10)61514-0
- OECD Health Data (2011) Organization for Economic Cooperation and Development, Paris.
- National Health Survey (2010) Ministry of health, Santiago de Chile.
- Levy-Marchal, C., Arslanian, S., Cutfield, W., Sinaiko, A., Druet, C., Marcovecchio, M.L., et al. (2010) Insulin Resistance in children: Consensus, perspective and future directions. Journal of Clinical Endocrinology and Metabolism, 95, 189-198. doi:10.1210/jc.2010-1047
- Burrows, R., Leiva, L., Weisstaub, G., Lera, L., Albala, C., Blanco, E. and Gahagan, S. (2011) High HOMA-IR, adjusted for puberty, relates to the metabolic syndrome in overweight and obese chilean youths. Pediatrics Diabetes, 12, 212-218. doi:10.1111/j.1399-5448.2010.00685.x
- Reilly, J. and Kelly, J. (2011) Long-term impact of overweight and obesity in childhood and adolescence on morbidity and premature mortality in adulthood: A systematic review. International Journal of Obesity, 35, 891-898. doi:10.1038/ijo.2010.222
- Sun, S.S., Liang, R., Huang, J.J.K., Daniels, S.R., Arsanian, S., Liu, K., Grone, G. and Siervogel, R. (2008) Childhood obesity predicts adult metabolic syndrome: The Fels Longitudinal Study. Journal of Pediatrics 152, 191-200. doi:10.1016/j.jpeds.2007.07.055
- Muzzo, S., Cordero, J., Ramírez, I. and Burrows, R. (2004) Trends in nutritional status and stature among school age children in Chile. Nutrition, 20, 867-973. doi:10.1016/j.nut.2004.06.007
- Kain, J., Uauy, R., Lera, L., Taibo, M. and Albala, C. (2005) Trends in height and BMI of 6-year-old children during the nutrition transition in Chile. Obesity Research, 13, 2178-2186. doi:10.1038/oby.2005.270
- Guzmán, J., Lyra, R., Aguilar-Salinas, C., et al. (2010) Treatment of type 2 diabetes in Latin America: A consensus statement by the medical associations of 17 Latin American countries. Revista Panamericana de Salud Pública, 28, 463-471. doi:10.1590/S1020-49892010001200008
- Sassi, F. (Ed.) (2010) Obesity and the economics of prevention. Organization for Economic Cooperation and Development, Paris.
- Grossman, M. (1972) The demand for health: A theoretical and empirical investigation. National Bureau of Economic Research, New York.
- Grossman, M. (1972) On the concept of health capital and the demand for health. Journal of Political Economy, 80, 223-255. doi:10.1086/259880
- Winkleby, M., Jatulis, D., Frank, E. and Fortman, S. (1992) Socioeconomic status and health: How education, income and occupation contribute to risk factors for cardiovascular disease. American Journal of Public Health, 82, 816. doi:10.2105/AJPH.82.6.816
- Wagstaff, A. (1993) The demand for health: An empirical reformulation of the Grossman model. Journal of Health Economics, 2, 189-198. doi:10.1002/hec.4730020211
- Grossman, M. (1999) The human capital model of the demand for health. Working Paper 7078, National Bureau of Economic Research, New York.
- Wilson, J. (2003) The crucial link between literacy and health. Annals of Internal Medicine, 139, 875-878.
- Levine, J. (2011) Poverty and obesity in the US. Diabetes, 60, 2667-2668.
- De Vanzo, J. and Gertler, P. (1990) Household production of health. A microeconomic perspective. RAND Corporation, Santa Monica.
- Anderson, P., Butcher, K. and Levine, P. (2003). Maternal employment and overweight children. Journal of Health Economics, 22, 477-504. doi:10.1016/S0167-6296(03)00022-5
- Burrows, R., Montoya, A., Gattas, V., Díaz, E., Sciaraffia, V. and Lera, L. (2008). Intake and physical activity habits among elementary and high school children by type of school attended. Revista Médica de Chile, 136, 53-63.
- Godard, C., Rodríguez, M.P., Díaz, N., Lera, L., Salazar, G. and Burrows, R. (2008). Evaluation of a test to assess physical activity habits in school children. Revista Médica de Chile, 136, 1155-1162.
- Chillón, P., Ortega, F., Ruiz, J., Pérez, I., Martín-Matilla, M., Valtueña, J., et al. (2009). Socio-economic factors and active commuting to school in urban Spanish adolescents: The AVENA Study. European Journal of Public Health, 19, 470-476. doi:10.1093/eurpub/ckp048
- Martínez-Gómez, D., Veiga, O., Gómez-Martínez, S., Zapatera, B., Calle, M. and Marcos, A. (2011). Behavioural correlates of active commuting to school in Spanish adolescents: The AFINOS Study. Public Health Nutrition, 14, 1779-1786.
- Xu, K., Evans, D.B., Kawabata, K., Zeramdini, R., Klavus, J. and Murray, C.J. (2003) Household catastrophic health expenditure: A multicountry analysis. The Lancet, 362, 111-117. doi:10.1016/S0140-6736(03)13861-5
- World Health Organization (2010) The World Health Report. Health systems financing: The path to universal coverage. WHO, Geneva.