Health
Vol. 4 No. 9 (2012) , Article ID: 23045 , 4 pages DOI:10.4236/health.2012.49091
Comparison of two statistical models in predicting the outcome of female systemic lupus erythematosus patients in China
![]()
1Department of Epidemiology and Health Statistics, School of Public Health, Anhui Medical University, Hefei, China; *Corresponding Author: ydq@ahmu.edu.cn
2Anhui Provincial Laboratory of Population Health & Major Disease Screening and Diagnosis, Anhui Medical University, Hefei, China
3Department of Rheumatology, Anhui Provincial Hospital, Hefei, China
4Division of Rheumatology, The First Ancillary Hospital, Anhui Medical University, Hefei, China
Received 19 July 2012; revised 16 August 2012; accepted 27 August 2012
Keywords: Statistical Methods; Public Health; Epidemiology; Systemic Lupus Erythematosus
ABSTRACT
Objectives: Comparing two different statistical models to predict female SLE patients’ outcome and analyze some related factors. Methods: 1072 female SLE patients were from the Provincial Hospital of Anhui Province and The First Ancillary Hospital of Anhui Medical University from 1990 to 2000. Two types of statistical models including loglinear and Cox proportional hazard model were performed according to this data. Results: Marriage situation, family place, admission situation, whether coming from a different division, nosocomial infection, first occurrent or not and number of drug types had significant effects on LOS after fitting of a loglinear model. Related factors from Cox proportional hazard model were little more than those selected from loglinear model. Based on the former model, a female SLE patient could be predicted that how long she would stay in hospital. But from the latter model, we could predict the ratio of the probability of improvement between different groups of female SLE patients with different individual or clinical characteristics. Conclusions: Factors affecting the length of stay of female SLE patients could be selected from either loglinear model or Cox model. But these two models would be used to do different predictions.
1. INTRODUCTION
Systemic lupus erythematosus (SLE) was a multisystem autoimmune disease involving both humoral and cellular aspects of the innate and acquired immune systems [1]. It occurred worldwide and affected females more commonly than males (about 10:1). The incidence and prevalence of SLE varied among racial and ethnic groups with multisystemic manifestations of mucocutaneous, renal, neurology, serositis, etc. [2]. It would shorten life expectancy, create significant morbidity and mortality with causes of renal failure, infection and impairment of central nervous system [1].
Although exact aetiopathogenesis of SLE remained not clear, standard medical therapy for active lupus was successful and should be used as the primary regimen in most SLE patients. In the past 40 years, prognosis for patients with SLE had improved with 10-year survival approximately 90%, which partly due to these therapies [3].
In medicine, not only the therapeutic outcomes of SLE but also the length of stay (LOS) in hospital would be paid attention on. Because studying LOS would be helpful to find its significance and benefit to our local community such as reducing economic burden of patients, using hospital beds efficiently etc. For the administrators of the hospital, predicted LOS of patients could help them manage the hospital or make some adjustment about the scale of hospital. For individual patient, a hospital LOS outside the expected range may suggest the need for further investigation to identify any complicating factors [4]. From the statistical viewpoint, LOS about diseases was not only dependent on treatment, but also related with other factors that probably were patients’ individual features and clinical characteristics. So it was important to develop statistical models to indicate the relationship between LOS of SLE and those related factors. Several studies about some other diseases were found to apply statistical models which included proportional hazards model, logistic and poisson models, generalized linear model and survival model to analyze their therapeutic outcomes or LOS, such as epilepsy, cerebral palsy, surgical patients and recurrent diarrhea [4-7]. Some studies [8-10] were found in predicting therapeutic outcomes of SLE using method of random forests or generalized estimating equation, other studies [11,12] in discussing the relationship of SLE’s mortality with LOS or in assessing factors influencing LOS of rheumatic diseases patients discharged over 12-month period, but we want to focus on exploring the factors of LOS of SLE patients and predicting it.
When investigating LOS in relation to any one factor, it was often desirable to adjust for the impact of the others. Application of a statistical model was improved by allowing LOS to be assessed with respect to several factors simultaneously. Many of statistical models mainly rely on variance techniques to quantify the portion of variance in LOS which was explanatory by its related factors [13]. The variability explained that using statistical models would be useful for experimental studies in controlled environment, such as clinical studies. We would gain the robust estimation of strength of effect and error for each constituent factor to perfectly predict LOS.
From the general viewpoint, patients’ individual and clinical characteristics possibly affected the therapeutic outcomes or LOS. Therapeutic outcomes were mainly relied on clinical characteristics, such as the admission situation, acute complication, treatment, SLE disease activity index score (SLEDAI), etc.; while LOS mainly relied on individual characteristics, such as age, socioeconomic status, etc.
Our study was designed to develop statistical models to predict SLE patients’ LOS and analyze some related prognostic factors. Due to the complexity of SLE, there might be no uniformly agreed upon statistical framework; neither was it known which method is optimal. When concentrated on LOS, we could try linear or loglinear model; when simultaneously concentrated on therapeutic outcomes and LOS treated as status and survival time respectively, we could consider the survival analysis with Cox proportional hazards model. The purpose of the present study was to compare two different statistical models in predicting LOS and (or) therapeutic outcomes and exploring the related factors; then one of them would be selected and used by administrators or physicians of the hospital and individual patients according to different aspects.
2. PATIENTS AND METHODS
2.1. Data Source
We only discussed the female patients with SLE in our study because the number of them was too much more than male patients and some of questionnaire terms were restricted to female.
Based on the revised criteria of the American College of Rheumatology (ACR) of 1982 and the updated contemporary criteria of 1997 [14,15] in the classification of SLE and the requirement of at least four criteria in the diagnosis, 1087 female patients were collected from the inpatient medical records of the Provincial Hospital of Anhui Province and The First Ancillary Hospital of Anhui Medical University from the year of 1990 to 2000. Under the re-check of the symptoms and the values of antibodies of these patients by an experienced physician, patients with platal lupus erythematosus (n = 5) and other types (n = 10) were excluded and the final sample consisted of 1072 female SLE patients. Data were obtained on: age at admission; occupation; family place; smoking habit and drinking habit; admission situation; course of disease; whether coming from a different medical division (DMD), nosocomial infection (NI), whether being first occurring (FO), whether being corticosteroids therapy before admission (CBA); the number of drug types (NDT) and SLEDAI.
Therapeutic outcomes were that: 5 patients were cured, 1030 improved and 37 unchanged among these 1072 patients. These 1072 female SLE patients were analyzed.
2.2. Data Analysis
Preliminary examination of data was performed preceding the fitness of statistical models. First, we descripted all of the individual and clinical characteristics listed in Table 1.
The dependent variable of LOS was continuous dependent variable with days of unit. There were also some continuous or non-continuous of independent variables. Some variables, such as smoking hobby, drinking hobby, chronic complication and family history, were discarded due to the little frequencies of their one category. Because a major part of patients were treated with corticosteroids and immunosuppressive, so we focused on the different effects of single or combi-ned type(s) of drugs treated.
The relationship between each individual factor and dependent variables was examined using students’ t test, ANOVA and Mann-Whitney test for ordinal variables before multivariate analysis was attempted. If factors have little or no effect on the dependent variable, they could be excluded from the multivariate analysis. Those variables, significant in the univariate analyses (P ≤ 0.05) or felt to be clinically relevant, were selected to build a model. All candidate variables were included in the model; the variable that made the least contribution was omitted and the models re-run.


Table 1. Description of individual and clinical characteristics.
2.3. Description of Two Types of Statistical Models Was as Follows
2.3.1. Loglinear Model
The dependent variable for linear regression was LOS with independent variables initial selected. Since the LOS was left-skewed distribution, linear regression with the logarithm of LOS as dependent variable y, satisfied the normally distributional assumption of ordinary least squares regression (Figure 1), was selected.
The expression of loglinear model was  . y was actual value of lgLOS,
  predict value.
  were individual characteristics and clinical characte-ristics selected from univariate analysis with their partial regression coefficients of
 ; ε was residual term. These regression coefficients were obtained after the least squares estimation of
  was minimum. It was required that the relationship of lgLOS with xp were linear [16]. The interpretation of
  was that the increasing one unit of xi could let LOS change
  days averagedly. Based on this model, a patient could be predicted how long she would stay in hospital.

Figure 1. Histogram of lgLOS of 1072 female SLE patients: to illustrate the frequency distribution of lgLOS of 1072 female SLE patients.
2.3.2. Cox Proportional Hazards Model
In clinics, that whether a SLE patient was cured, improved or unimproved when discharged would be considered with LOS. From the specialty point, SLE patients improved could discharge from hospital among the survivors in clinics. So, patients improved and cured were regarded as achieving end-point; while those unimproved were regarded as censored. LOS was treated as survival time t.
Accordingly, the expression was 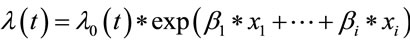 where
where  was the hazard function of improvement after treatment and λ0(t) baseline hazard function with the assumption of proportional hazards. The survival time was not assumed to follow a particular statistical distribution. But the affected variables on improvement could be obtained. The coefficients’ values could be known under maximizing the partial likelihood function
 . βi was interpreted that the increasing one unit of
  could let the probability of improvement increase
  times averagedly. Based on this model, two patients with different situations of affected variables could be predicted the ratio of the probability of improvement.
Cox proportional hazards model possesses the property that different individuals have hazard functions that are proportional, that is to say, the ratio of the hazard functions for two individuals with prognostic factors or covariates is a constant (does not vary with time t). This proportionality assumption was often appropriate for survival time data but it was important to verify if it held [17].
Statistical significance was defined as P ≤ 0.05 for all analysis. Analyses were performed using SPSS and Stata/SE 9.0 version.
3. RESULTS
3.1. General Description
LOS of 1072 patients was varied from 1 day to 204 days with left-skewed distribution (Figure 2), whose average was 19 ± 18 days [median ± (interval of quartiles]. Seen from Table 1, information concerning variables described in the medical literature included individual characteristics which were age, family place, marriage situation, occupation, smoking, drinking, menstrual period history, childbearing history and clinical characteristics which were admission situation, whether coming from a different medical division, acute complication, chronic complication, nosocomial infection, number of used drug types and SLEDAI.
The frequency distribution of acute complication in hospitalization was as follows: 11 patients had nephritis of glomerulonephritis, 8 metabolic dysfunction, four respiratory infections, 3 infection of the other parts, 3 lupus brain disease or cerebrovascular accident, 2 pericardial or pleural effusions and 1 fever blister around lips.

Figure 2. Histogram of LOS of 1072 female SLE patients: to illustrate the frequency distribution of LOS of 1072 female SLE patients.
The frequency distribution of related disease history was as follows: 70 patients had rheumatoid arthritis, 25 tuberculosis, 17 hypothyroid disease, 8 diabetes, 6 muscardine, 3 rheumatoid arthritis and tuberculosis, 2 hypothyroid disease and tuberculosis, 1 myasthenia gravis, 1 diabetes and myasthenia gravis, 1 rheumatoid arthritis and hypothyroid disease, 1 diabetes and tuberculosis, 1 diabetes, rheumatoid arthritis and hypothyroid disease. Two patients had chronic complications of steroidal diabetes and pulmonary interstitial fibrosis during the period of hospitalization.
3.2. Univariate Analysis
Student’s t test and ANOVA were processed when lgLOS was treated as dependent variable with individual and clinical characteristics as independent variables respectively. Those factors including marriage situation (MS, 0 = unmarried, 1 = married), occupation (OC 1 = peasant, 2 = labor, 3 = others), family place (FP, 1 = city, 2 = county, 3 = rural), admission situation (AS, 1 = crisis, 2 = emergent, 3 = general), whether coming from a different medical division (DMD, 1 = yes, 0 = no), nosocomial infection (NI, 1 = have, 0 = haven’t), whether being first occurrence (FO, 1 = yes, 0 = no), whether being corticosteroids therapy before admission (CBA, 1 = yes, 0 = no) and the number of drug types (NDT) had statistical significant effect on lg(LOS) (P < 0.05). Only those variables with significance were listed in Table 2.
3.3. Multivariate Loglinear Regression Analysis
LgLOS was treated as a dependent variable y with independent variables of MS, OC, FP, AS, DMD, NI, FO, CBA and NDT. But the relationship of dependent variable with each of independent variables would be checked to be satisfied with condition of linear before multivariate linear regression analysis. The results were listed in Table 3. From Table 3, we found that all of the independent variables were linear with dependent variable.
Multivariate linear regression analysis was processed and MS, FP, AS, DMD, NI, FO and NDT were significant (P < 0.05), which was seen through the first model in Table 4. After removing the insignificant variables of OC, AS and CBA, the model of MS, FP, AS, DMD, NI, FO and NDT was fit on lgLOS (seen the second model in Table 4) and all of the independent variables were significant (P < 0.05).
So, the predicted model of lgLOS was: lgLOS = ŷ = 1.851 − 0.0738 * MS − 0.0553 * FP − 0.0431 * AS − 0.167 * DMD − 0.243 * NI − 0.123 * FO + 0.0423 * NDT. The Spearman correlation coefficient between the predicted and observed lgLOS of loglinear model was 0.413 (P < 0.05), which suggested the better prediction.
We could see from it that the average length of stay of unmarried female patients was estimated to be 18.52% (100.0738 = 1.1852) longer than the married female SLE
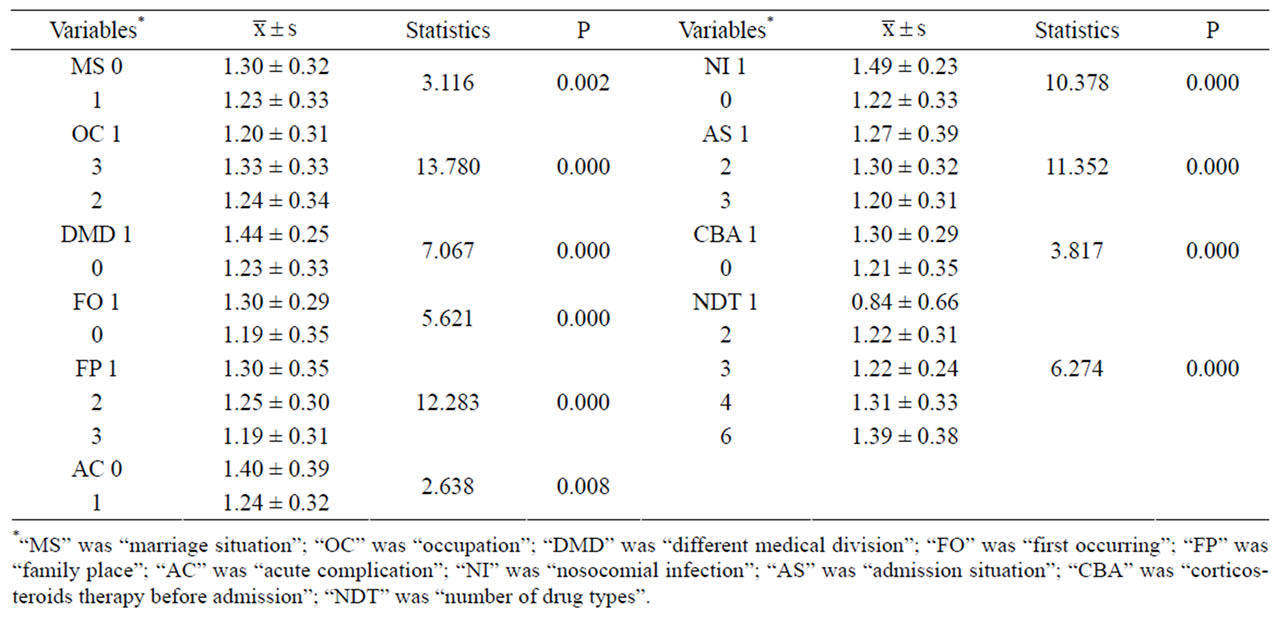
Table 2. Univaraite analyses of independent variables on lgLOS.

Table 3. Curve estimation of each independent variable on lgLOS.
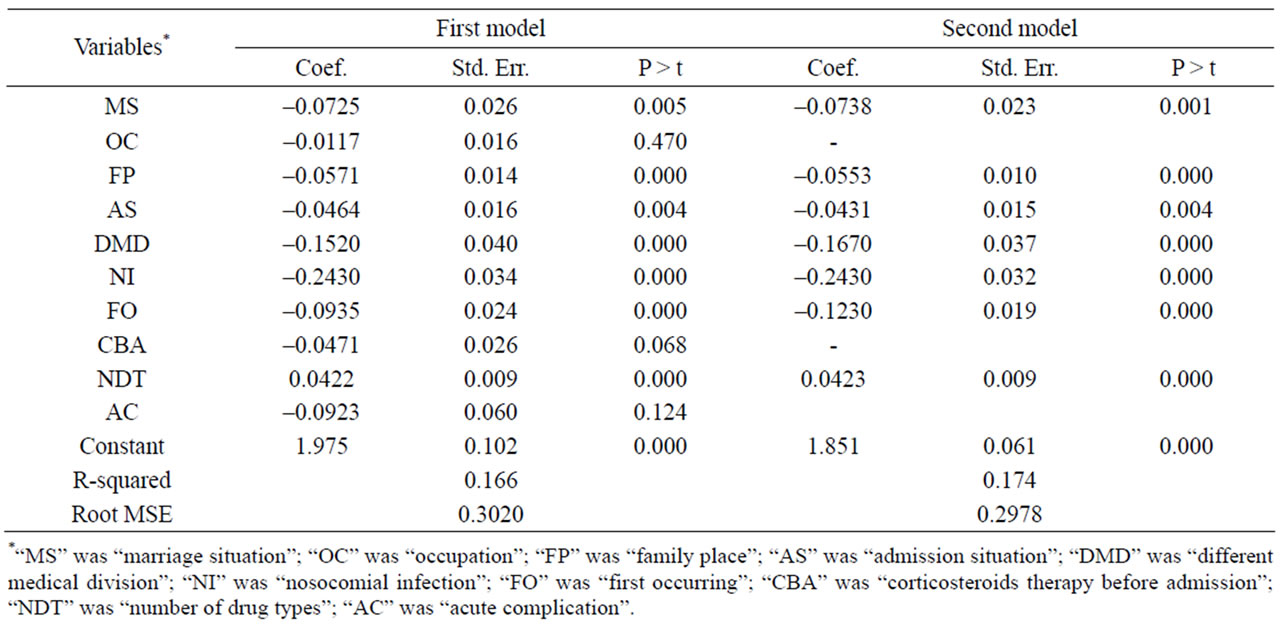
Table 4. Two steps’ results of multivariate linear regression analyses.
patients, of patients in city to be 13.58% (100.0553 = 1.1358) longer than those in county and 29.00% (100.0553×2 = 1.2900) longer than those in rural, of patients of crisis admission to be 10.43% (100.0431 = 1.1043) longer than those of emergent admission and 21.95% (100.0431×2 = 1.2195) longer than those of general admission, of patients having been come from a different division to be 46.89% (100.1670 = 1.4689) shorter than those haven’t, of patients having nosocomial infection to be 74.98% (100.2430 = 1.7498) shorter than those haven’t, of patients who were recurrent to be 32.74% (100.1230 = 1.3274) shorter than those first occurred; the more one type of drug used, the average length of stay was estimated to be 10.23% (100.0423 = 1.1023) longer.
3.4. Cox Proportional Hazard (PH) Model
Cox proportional hazard model was performed with LOS treated as survival time and the therapeutic outcomes as status in which the cured and improved were end-point events. Independent variables were same as before and their effects were observed in Table 5.
Then the proportional hazards assumption was checked with several graphs of Kaplan-Meier vs. predicted survival curves based on each independent variable. From Figure 3, we could see that the curves were roughly concordant in every graph. Accordingly, Cox proportional hazard model was applied to this data.
All the independent variables except CBA were significant (P < 0.05) in Cox model. It was found that: a married woman would have relative risk of being cured and improved 1.316 times of an unmarried woman, women with occupations of labor 0.821 times of those with other occupations, women who were located in city 0.724 times of those located in rural, women with crisis and emergent admission situation 0.686 and 0.764 times of those of general admission situation respectively, women coming from a different division 1.601 times of those not coming from a different division, patients with nosocomial infection 1.904 times of those without nosocomial infection, patients who were reoccurring 1.326 times of those first occurring, the relative risk of women patients having been cured and improved increased 0.151 (1/0.869 − 1) times along with decreasing one type of drug, patients with acute complication 1.606 times of those without acute complication.
3.5. Comparing the Results of Two Models
The comparison between two models was listed in Table 6.
Loglinear model was aimed to find factors of LOS.

Table 5. The result of Cox proportional hazard regression analysis.
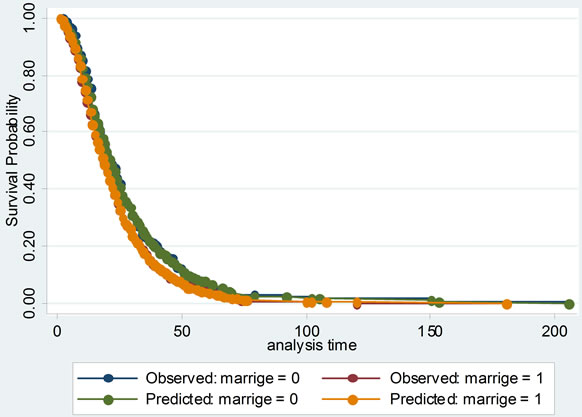
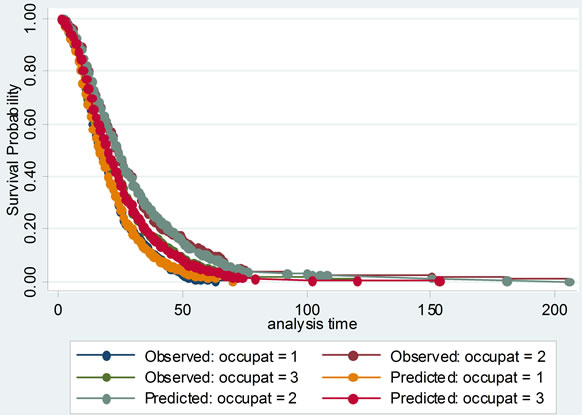
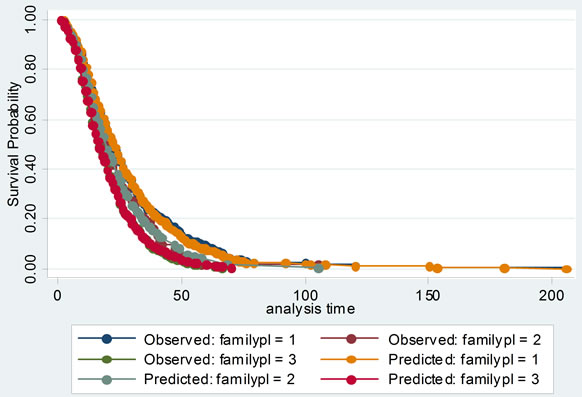
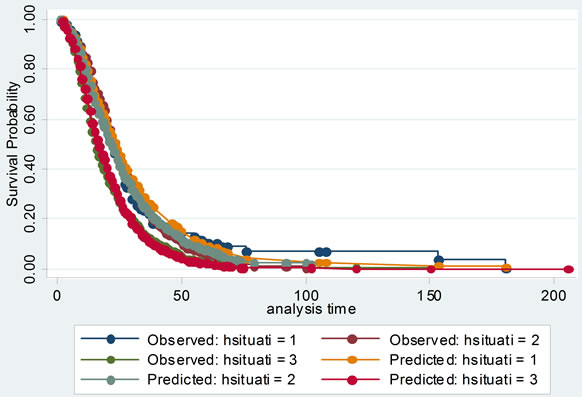
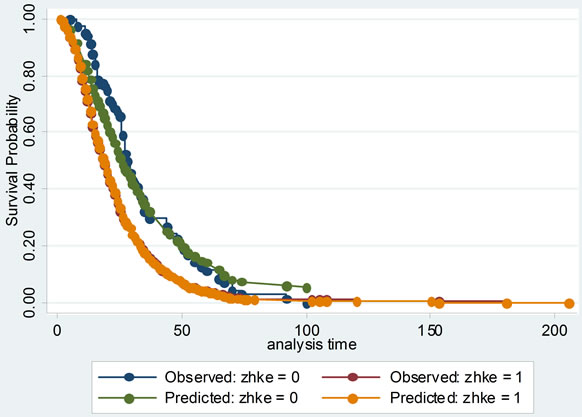
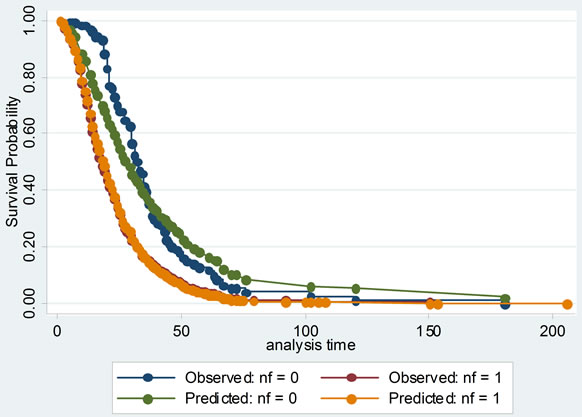
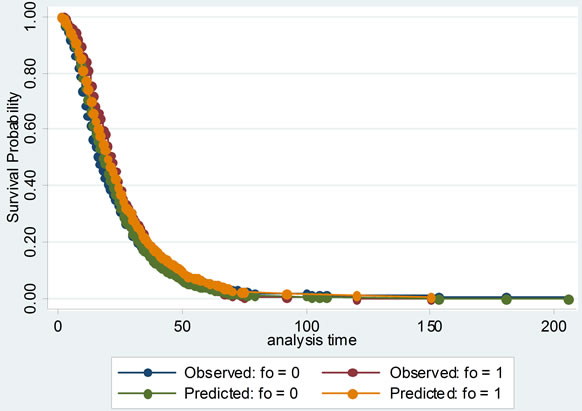
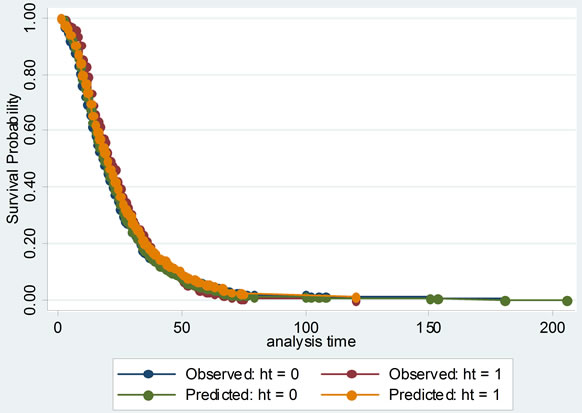
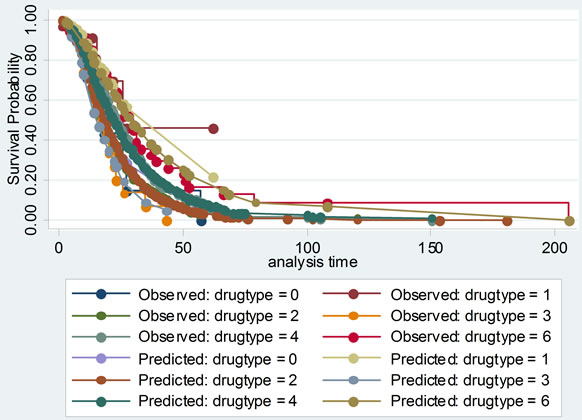
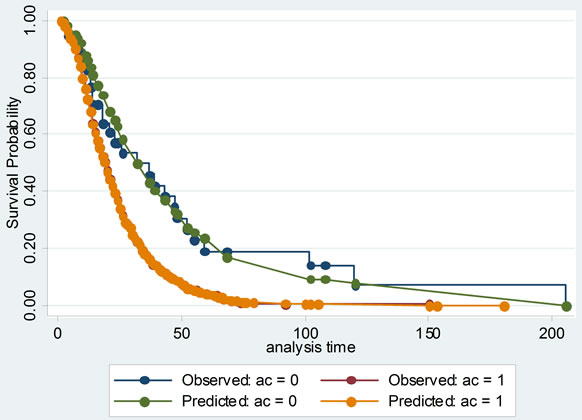
Figure 3. The comparisons of Kaplan-Meier vs predicted survival curves of each independent variable in cox proportional hazard model: to illustrate the fitness of two curves of each independent variable, this was in order to test the conditional hypothesis of cox proportional hazard model.
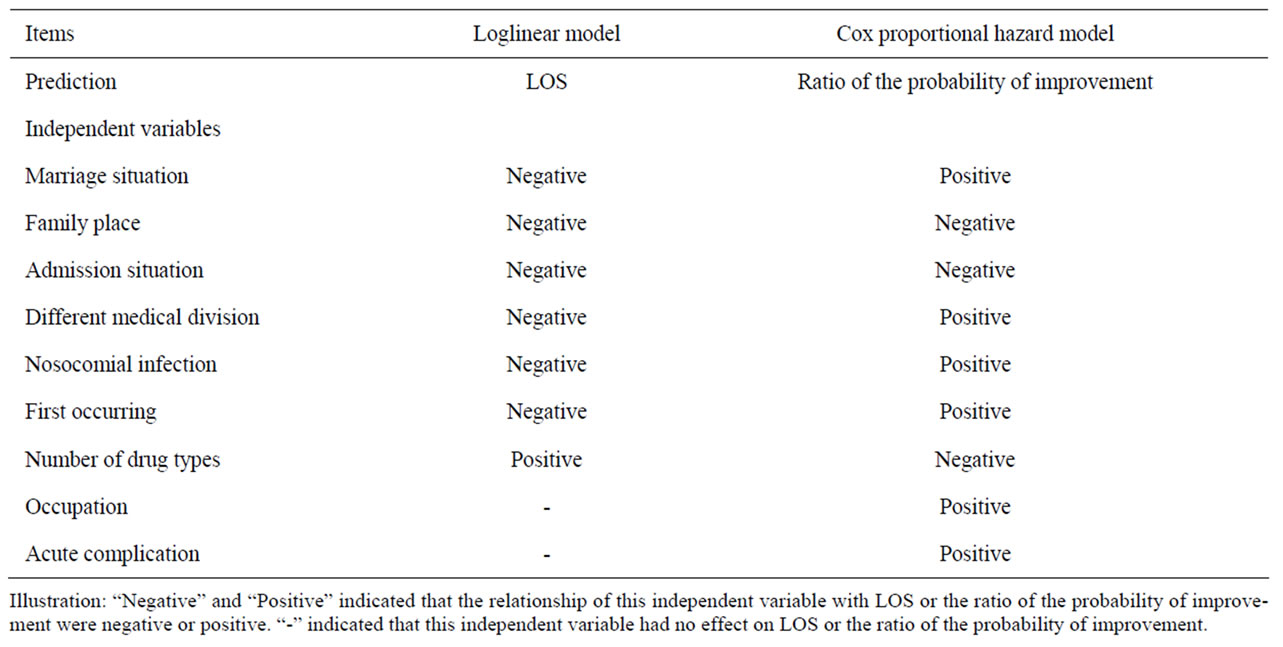
Table 6. Comparison of results of two models.
While in Cox model, factors were mainly explored to affect the probability of improvement when patients discharged from hospital.
At one hand, the factors including MS, FP, AS, DMD, NI, FO and NDT had effects on LOS and the probability of improvement from these two models. Additionally, the effects on them two were inversely. For an example, an unmarried woman would stay in hospital longer and have the probability of improvement lower than a married one. Patients with crisis admission would have longer LOS and lower probability of improvement than those with emergent and general admission. And so on. At the other hand, two other factors of OC and AC had effects only on the probability of improvement, not on LOS. Because the LOS and status when discharged were considered simultaneously in Cox model, all of these nine factors should be paid attention on for the physicians and relatives of female SLE patients.
Of course, two models could be used to make different predictions. Based on the loglinear model, a female SLE patient could be predicted that how long she would stay in hospital. But from the Cox model, we could predict the ratio of the probability of improvement between different groups of female SLE patients with different individual or clinical characteristics.
4. DISCUSSION
In the present study, two types of statistical models were developed to explore some factors to predict LOS and the probability of improvement. It was required that a great quantity of confident SLE data was necessary for establishing statistical models. These 1072 female SLE patients were diagnosed demandingly by experienced physicians from the Provincial Hospital of Anhui Province and The First Ancillary Hospital of Anhui Medical University. In addition, individual and clinical characteristics of SLE patients were measured exactly and objectively by experienced investigators with less systematic errors. To maximize the information extracted from the predictor variables, we replaced some missing values reasonably. All the variables in the data were described in details and initially selected with significance through univariate analyses before statistical modeling analyses.
From the results of different types of statistical models, it was undoubtedly that the number of drug types used on SLE patients affected the LOS and probability of improvement. Other factors such as marriage situation, family place, admission situation, whether coming from a different medical division, nosocomial infection and whether being first occurring, selected from loglinear model and Cox proportional hazard model, also had effects on both of them. Such as that, married women would stay in hospital about one day shorter and have 1.316 times higher probability of improvement than the unmarried. Patients in rural would stay in hospital little more than two days shorter and have 1.381 times higher probability of improvement than those in city. Patients with nosocomial infection would stay in hospital about two days longer and have 1.904 times higher probability of improvement than those without nosocomial infection. Occupation and acute complication had effects only on the probability of improvement.
As for loglinear model, it was aiming to predict LOS of SLE patients regardless of the status when discharged, which could enable hospital administrators to forecast the need for hospital resources more or less. Although the advantage of linear regression on log-transformed LOS was that the distribution of lgLOS tended to be normalized, a drawback to the method was that the regression coefficients were interpreted on a multiplicative scale as the logarithm of the proportional change in median LOS with a one-unit increased in a predictor variable and its variance increased as the mean increased [7]. Moreover, R-square of the predicted model was 0.174, which indicated that the proportion of explanatory variance was only 17.4% and 82.6% of variance was not interpreted by the predicted model. Maybe there existed some unknown reasons. The spearman correlation coefficient between the predicted and observed lgLOS was 0.413 (P < 0.0001).
Cox proportional hazard model accounted for not only the LOS, but also probability of improvement, which treated the hospitalization of SLE patients as survival data, and analyzed the probability of improvement of SLE completely to investigate its factors. Its model checking was important. Cox proportional hazard model was fit with χ2 equal to 149.945 and P less than 0.00001. Several graphs of Kaplan-Meier vs predicted survival curves based on each independent variable were roughly concordant, which was indicating that Cox proportional hazard model was satisfied with this data.
In summary, the decision about which method to choose and what coding scheme to use depended upon the research goals of a study, and the resources available to achieve them should be considered [18]. Factors affecting the LOS of female SLE patients could be selected from either loglinear model or Cox model. But these two models would be used to do different predictions. Based on the loglinear model, a female SLE patient could be predicted that how long she would stay in hospital. But from Cox model, we could predict the ratio of the probability of improvement between different groups of female SLE patients with different individual or clinical characteristics.
Limitations:
1) A limitation of our study was about the potential bias in SLE patient recruitment. These SLE patients were diagnosed by the 1982 revised American College of Rheumatology Criteria between the year of 1990 and 2000. But the 1997 revised criteria have been used and the diagnosed requirement was revised. The results of this study on female SLE patient would not represent the current situations entirely. Moreover, the diagnosis of SLE might be delayed when the initial manifestations were atypical, few in number, or when the manifestations present were not the ones included in the ACR criteria, even though they occurred frequently in patients with SLE [19]. This would relate with the outcomes of therapy and the LOS. Some patients died after 1 or little more days in hospital without treatment because they were critical when entered in hospital. But from our model, it was known in mistake that patients died due to non-treatment. 2) The other limitation of our study was that the data would not contain information on SLE disease activity and damage and other relevant descriptors of therapeutic outcome [20], thereby limiting the performance of those models in use. Some factors of low income, low educational attainment, public health insurance status, social support and social psychology [21] would be associated with therapeutic outcome of female SLE patients. 3) Furthermore, some factors of gene of SLE and corticosteroids level of female SLE body would not be tested.
In summary, our study focused on different statistical models to predict the LOS and explore the relative factors. On the other hand, it would require external validation by testing these statistical models on further female SLE hospitalization data. In the future, model reliability, the ability to obtain similar values for the same variable in specific patients at different times or in different locations, could be assessed.
5. ACKNOWLEDGEMENTS
Thanks to Dr. Feng Chen of Nan-jing Medical University in Jiang-su province for his revision in part time. This work was supported by grants from the key program of National Natural Science Foundation of China (30830089).
![]()
![]()
REFERENCES
- Kimberly, R. P. (2001) Research advances in systemic lupus erythematosus. Journal of American Medical Association, 285, 650-651. doi:10.1001/jama.285.5.650
- Van Vollenhoven, R. F. (2002) Dehydroepiandrosterone for the treatment of systemic lupus erythematosus. Expert Opinion Pharmacother, 3, 23-31. doi:10.1517/14656566.3.1.23
- McMurray, R. W. (2001) Nonstandard and adjunctive medical therapies for systemic lupus erythematosus. Arthritis Care & Research, 45, 86-100. doi:10.1002/1529-0131(200102)45:1<86::AID-ANR89>3.0.CO;2-A
- Anand, K. J. S., Hopkins, S. E., Wright, J. A., Ricketts, R. R. and Flanders, W. D. (2001) Statistical models to predict the need for postoperative intensive care and hospitalization in pediatric surgical patients. Intensive Care Medicine, 27, 873-883. doi:10.1007/s001340100929
- Kwong, G. P. S. and Hutton, J. L. (2003) Choice of parametric models in survival analysis: Applications to monotherapy for epilepsy and cerebral palsy. Royal Statistical Society (Applied Statistics), 52, 153-168.
- Austin, P. C., Rothwell, D. M. and Tu, J. V. (2002) A comparison of statistical modeling strategies for analyzing length of stay after CABF surgery. Health Services & Outcomes Research Methodology, 3, 107-133. doi:10.1023/A:1024260023851
- Yau, K. K. W., Lee, A. H. and Gracey, M. (2005) Multilevel modeling of hospitalizations for recurrent diarrhoeal disease in aboriginal and non-aboriginal infants and young children in Western Australia. Paediatric and Perinatal Epidemiology, 19, 165-172. doi:10.1111/j.1365-3016.2005.00638.x
- Ward, M. M., Pajevic, S., Dreyfuss, J. and Malley, J. D. (2006) Short-term prediction of mortality in patients with systemic lupus erythematosus: Classification of outcomes using random forests. Arthritis Care & Research, 55, 74- 80. doi:10.1002/art.21695
- Bertoli, A. M., Alarcon, G. S., McGwin Jr., G., Fernandez, M., Bastian, H. M., Fessler, B. J., et al. (2006) Systemic lupus erythematosus in a multiethnic US cohort (LUMINA) XXVII: Factors predictive of a decline to low levels of disease activity. Lupus, 15, 13-18. doi:10.1191/0961203306lu2256oa
- Alarcon, G. S., Calvo-Alen, J., McGwin, G., Uribe, A. G., Toloza, S. M., Roseman, J. M., et al. Systemic lupus erythematosus in a multiethnic cohort: LUMINA XXXV. Predictive factors of high disease activity over time. Annals of the Rheumatic Diseases, 65, 1168-1174. doi:10.1136/ard.2005.046896
- Krishnan, E. (2006) Hospitalization and mortality of patients with systemic lupus erythematosus. Journal of Rheumatology, 33, 1770-1774.
- Jones, E. and Jones, J. V. (1994) Factors affecting length of hospitalization in a rheumatic disease unit. Journal of Rheumatology, 21, 728-732.
- Peek, M. S., Leffler, A. J., Flint, S. D. and Ryel, R. J. (2003) How much variance is explained by ecologists? Additional perspectives. Oecologia, 137, 161-170. doi:10.1007/s00442-003-1328-y
- Tan, E. M., Cohen, A. S., Fries, J. F., Masi, A. T., McShane, D. J., Rothfield, N. F., et al. (1982) Special article: The 1982 revised criteria for the classification of systemic lupus erythematosus. Arthritis & Rheumatism, 25, 1271-1277. doi:10.1002/art.1780251101
- Hochberg, M. C. (1997) Updating the American College of Rheumatology revised criteria for the classification of systemic lupus erythematosus (letter). Arthritis & Rheumatism, 40, 1725. doi:10.1002/art.1780400928
- Chen, F. (2000) Multivariate Statistics Analysis Methods in Medicine. China Statistics Press, Beijing, 22-49.
- Lee, E. T. and Wang, J. W. (2003) Statistical methods for survival data analysis. John Wiley & Sons, Hoboken, 298. doi:10.1002/0471458546.ch12
- Irala-Estévez, J., Martínez-Concha, D., Díaz-Molina, C., Masa-Calles, J., Castillo, A. S. and Fernández-Crehuet, N. R. (2001) Comparison of different methodological approaches to identify risk factors of nosocomial infection in intensive care units. Intensive Care Medicine, 27, 1254-1262. doi:10.1007/s001340101007
- Alarcón, G. S., Gerald McGwin, J. R., Roseman, J. M., Uribe, A., Fessler, B. J., Bastian, H. M., et al. (2004) Systemic lupus erythematosus in three ethnic groups. XIX. Natural history of the accrual of the American College of Rheumatology Criteria prior to the occurrence of criteria diagnosis. Arthritis & Rheumatism, 51, 609-615. doi:10.1002/art.20548
- Clarke, A. E., Petri, M., Manzi, S., Isenberg, D. A., Gordon, C., Senecal, J. L., et al. (2004) The systemic lupus erythematosus tri-nation study: Absence of a link between health resource use and health outcome. Rheumatology, 43, 1016-1024. doi:10.1093/rheumatology/keh229
- Karlson, E. W., Liang, M. H., Eaton, H., Huang, J., Fitzgerald, L., Rogers, M. P., et al. (2004) A randomized clinical trial of a psychoeducational intervention to improve outcomes in systemic lupus erythematosus. Arthritis & Rheumatism, 50, 1832-1841. doi:10.1002/art.20279
ABBREVIATIONS
SLE: systemic lupus erythematosus;
LOS: length of stay;
SLEDAI: systemic lupus erythematosus disease activity index score;
ACR: American College of Rheumatology;
ANOVA: Analysis of Variance;
MS: marriage situation;
OC: occupation;
FP: family place;
AS: admission situation;
DMD: different medical division;
NI: nosocomial infection;
FO: first occurring;
CBA: corticosteroids therapy before admission;
NDT: number of drug types;
AC: acute complication;
PH: proportional hazard;
SPSS: Statistical Product and Service Solutions.