Health
Vol. 4 No. 9A (2012) , Article ID: 23257 , 8 pages DOI:10.4236/health.2012.429111
The tomography dementia rating scale (TDR)—The rating scale of Alzheimer’s disease stages
![]()
Clinic of Cardiovascular Diseases named after Most Holy John Tobolsky, Moscow, Russia; carvasc@yandex.ru
Received 19 July 2012; revised 18 August 2012; accepted 27 August 2012
Keywords: Alzheimer's Disease; AD Stage; TDR; CDR; Dementia; Hippocampus; Atrophy of the Temporal Lobes of the Brain
ABSTRACT
The purpose of this research is to develop a morphologically determined scale—the Tomography Dementia Rating scale (TDR) to diagnose AD stages, based on the measurement of the severity of voluminal atrophic changes of the temporal lobes of the brain detected among patients during CT and MRI at various stages of the disease. The research included 140 patients aged 28 - 79. Test Group comprised 81 patients aged 34 - 79 suffering from various AD stages. Control Group consisted of 59 patients aged 28 - 78 who had various types of brain lesions with manifestations of dementia and cognitive impairment but who did not suffer from AD. CT and MRI data obtained has made it possible to create a scale that allows determining the severity of atrophic changes in the temporal lobes at each stage of AD development: 1) Pre-clinical AD stage—TDR-0: temporal lobes atrophy with a 4% - 8% decrease in tissue mass (corresponds to 26 - 28 MMSE points); 2) Early AD Stage—mild dementia—TDR-1: temporal lobes atrophy with a 9% - 18% decrease in tissue mass (corresponds to CDR-1 and to 20 - 25 MMSE points); 3) Middle AD stage—moderate dementia—TDR-2: temporal lobes atrophy with a 19% - 32% decrease in tissue mass (corresponds to CDR-2 and to 12 - 19 MMSE points); 4) Late AD stage—heavy dementia—TDR-3: temporal lobes atrophy with a 33% - 62% decrease in tissue mass (corresponds to CDR-3 and to 7 - 11 MMSE points). Thereby, the developed Tomography Dementia Rating scale (TDR) complements the Clinical Dementia Rating scale (CDR) and allows a correct and objective determination of AD stages as well as an easy differentiation of existing lesions with neurodegenerative changes characteristic for other diseases accompanied by dementia and cognitive impairment.
1. INTRODUCTION
Each year Alzheimer’s disease (AD) is becoming more widespread among the population of countries with different levels of economic development. According to the Alzheimer’s Association, the number of reported cases in the United States increased from 5.1 million in 2007 to 5.4 million in 2011 [1,2]. It is assumed that by 2050 the number of American patients will increase to 13.5 million [3]. In 2010, there were 35.6 million patients worldwide; every 4 seconds a new patient suffering from AD appears on this planet [4]. It is estimated that by 2050 the number of patients worldwide will increase to 115.4 million [5]. Thus, AD is becoming a global problem of mankind, able to affect people of different economic and social status.
Full visualization of the processes and changes occurring in the brain during the development of the disease, its early diagnosis, as well as an objective and timely identification of the severity of dementia and, accordingly, of AD stages are important in solving this problem [6].
Particularly difficult to diagnose is the early AD stage characterized only by mild dementia and Mild Cognitive Impairment (MCI) [7-9]. Yet even more difficult is the diagnosis of the preclinical AD stage, when the symptoms have not yet developed or are mild and there are no symptoms of dementia but only a high probability of its development, due to the initial changes in brain tissue [10-12]. These people do not usually have genetically determined inherited AD, they are fairly young, have scarce complaints of memory impairment, do not go to hospitals, and therefore are not subject to examination and counting. According to the AAIC-2011, if this kind of patients is revealed, the number of potential patients and AD cases could increase by several times [13]. Taking into account the spread of the disease, the Congress and the President of the United States approved the “National Plan to Address Alzheimer’s Disease” in May 2012 [14].
The situation has led to the need to develop a fairly simple, objective, inexpensive method of diagnosing AD and its stages, which could be carried out in clinical practice for examining large groups of people.
For a long time the world of clinical practice had no means to determine lifetime morphological changes developing in the brain at each stage of the disease. “The Clinical Dementia Rating scale” (CDR) proposed by J.C. Morris in 1993 is widely used to determine the severity of dementia and AD stages [15]. The method is based on the clinical and psychological evaluation of the patient obtained during his or her visual contact with the doctor and the following, often quite subjective assessment of existing disorders.
A major step in AD diagnosis has been the introduction of tomographic methods such as CT and MRI allowing to visualize the brain and to detect changes developing in its tissue [7-9]. However, there hasn’t until recently been any specific data on the changes occurring in the cerebral tissue at each stage of the disease [16-19].
In earlier AD stages, the tissue of the temporal lobes of the brain and the hippocampus is affected to a greater extent [20]. In later stages, fronto-parietal brain regions suffer along with the temporal ones. It is interesting to note that hypotrophic changes in the temporal lobes of the brain are detected even among AD patients’ children and grandchildren [21]. During tomographic examination, temporal lobes are easily differentiated by bone marks, and that greatly facilitates the examination process [17- 19]. There has lately been a tendency to develop integrated tomographic techniques based on the combination of PET and MRI, the purpose of which was to differentiate the hippocampus tissue from the tissue of the temporal lobes of the brain [8,9,22]. These techniques were becoming quite complicated and time consuming and had large errors. It was later shown that the accuracy increases and the technique becomes simpler if atrophic changes are measured not in the hippocampus but in the tissue of the whole temporal lobe [10,17,19] which was confirmed by research of many authors [20,23].
As both temporo-parietal and temporal regions of the brain suffer simultaneously in the later AD stages, certain methods of atrophy measurement in all the cerebral tissue have been proposed [24]. However, neurodegenerative changes in fronto-parietal regions are observed in many other brain lesions, making difficult the interpretation of these changes in AD [10,18,19].
Further improvement of PET techniques and the introduction of biomarkers have allowed to visualize the presence of amyloid-beta in brain tissue directing research to the determination of the level of this protein. However, these studies are still under development, there is no common examination methodology yet, and it has been found out that high levels of amyloid-beta do not always indicate the development of dementia and AD and often occur among practically healthy people [25-29].
The purpose of this research is to develop a morphologically determined scale—the Tomography Dementia Rating scale (TDR) to diagnose the stages of AD, based on the measurement of the severity of voluminal atrophic changes of the temporal lobes of the brain detected among patients during CT and MRI at various stages of the disease.
2. METHODS
The whole research has been made with the approval of the Ethics Committee, as well as with the consent of the examined patients and their relatives.
Carrying out this research, to determine the stages of dementia in AD, in contrast to the method of J.C. Morris’ “The Clinical Dementia Rating scale” (CDR) [15], we have proposed a new rating scale based on the definition of objective morphological data obtained during visualization of the severity of atrophic changes developing in the temporal lobes of the brain. Since lifetime brain morphological changes can be obtained by applying x-ray diagnostic methods, CT and MRI have been used. This scale has been named “The Tomography Dementia Rating scale” (TDR) [30].
2.1. Patients
140 patients aged from 28 to 79 have been examined (average age 67.5).
2.1.1. The Test Group
The Test Group comprised 81 patients aged from 34 to 79 (average age 67), of whom 28 (34.57%) were male patients and 53 (65.43%) were female patients.
72 patients suffered from various stages of AD and were divided into the following groups in accordance with J.C. Morris’ classification:
• Group CDR-1: patients with mild dementia, mild cognitive impairment, had previously been diagnosed with AD, history of the disease did not exceed 2 years —24 (29.63%) patients;
• Group CDR-2: patients with moderate dementia, rather persistent cognitive impairment, had previously been diagnosed with AD, history of the disease ranged from 2 to 6 years—31 (38.27%) patients;
• Group CDR-3: patients with quite severe dementia, gross cognitive impairment, had previously been diagnosed with AD, history of the disease ranged from 7 to 12 years—17 (21.00%) patients;
• A separate group of 9 (11.11%) were those with a high risk of developing AD or with its preclinical stage (the need to differentiate the preclinical stage was repeatedly pointed out to in the AAIC-2011). All these people were direct relatives of the patients with AD; they had primary involutive changes in the brain along with growing memory problems but did not have pronounced symptoms of dementia or any specific cognitive impairment.
2.1.2. The Control Group
The Control Group consisted of 59 people aged 28 to 78 (average age 68), of whom 36 (61.0%) were male and 23 (39.0%) female patients.
Patients in this group either had different types of brain lesions accompanied by neurodegenerative changes, dementia symptoms and cognitive impairment, but did not have AD, or, having involutive changes in the brain, did not show any specific complaints, considered themselves healthy, and treated the existing cerebral disorders as age-appropriate and normal.
These patients were divided into the following groups:
• A group with the initial stage of chronic cerebrovascular insufficiency of atherosclerotic genesis with no symptoms of persistent dementia and cognitive impairment. Typically, these patients, regardless of age, submitted individual complaints indicating cerebral hemodynamics violations—17 (28.81%) patients, CDR-1 being observed in 6 cases;
• A group with a fairly severe chronic cerebrovascular insufficiency of atherosclerotic genesis without gross occlusive lesions of brain vessels. They had beginning mild dementia and initial cognitive impairment —12 (20.33%) patients, CDR-1 being detected in 9 cases, CDR-2—in 3 cases;
• A group with multiple atherosclerotic lesions in the brain, severe vascular dementia and cognitive impairment, their medical history contained recurrent small focal strokes—6 (10.17%) patients, CDR-2 being observed in 1 case, CDR-3—in 5 cases;
• A group with atherosclerotic (vascular) parkinsonism and manifestations of dementia—14 (23.73%) patients, CDR-1 being observed in 5 cases, CDR-2—in 9 cases;
• A group with Binswanger’s disease and manifestations of dementia—6 (10.17%) patients, CDR-1 being detected in 1 case, CDR-2—in 2 cases, CDR-3—in 3 cases;
• A group with Parkinson’s disease and manifestations of dementia—4 (6.78%) patients, CDR-1 being observed in 1 case, CDR-2—in 3 cases.
2.2. The Examination Plan Included
1) Assessment of cognitive functions—Mini-Mental State Examination (MMSE) [31].
2) The clinical definition of the severity of dementia— “The Clinical Dementia Rating scale” (CDR) [15].
3) Laboratory examination—coaguological, biochemical, and clinical examination.
4) Tomographic diagnostics—CT and MRI with subsequent calculation of the degree of atrophy of the temporal lobes of the brain [16,17,30,32].
Tomographic research was performed on “Somatom” (Siemens), “HiSpeed” (GE), “Tomoscan” (Philips), “Apetro Eterna” (Hitachi) following the developed method [10,16-19].
The essence of the method is as follows: the margin of the first scan took place on the orbital meatal line. Depending on the type of the scanner, scans were 1 or 2 mm thick with a corresponding interval of 1 or 2 mm. The margins of cerebral fosses on both sides were ascertained by bone marks. A consistent two-side measurement of cerebral fosses region and measurement of the size of the substance of the right and left temporal lobes of the brain for each scan were made with the computer program “Advanced Tomo Area Analysis” (ATAA). Next, the area of the lower horn of the lateral ventricle and the area of the sulci were subtracted and then compared with the area of the corresponding cranial fossa at the same level. The obtained figures were automatically recalculated by the thickness of each scan and each interval between the scans, and the volume and mass of cerebral tissue in the examined area were measured. The ratio of these quantities allows us to compare the state of brain tissue both in its normal condition and after adjusting for total intracranial volume, and to consider them during developing atrophic process. The results showed both the normal amount of tissue for the corresponding age group and a percentage decrease of the volume of the temporal lobes of the brain and the hippocampus. The percentage ratio of those figures determined the severity of atrophic changes. As the examined patients belonged to different age groups, the research took into account age-related changes in the brain tissue [10,16-19].
3. RESULTS
3.1. Test Group Patients
During CT and MRI all patients with AD revealed objective characteristic morphological changes of the brain which can be divided into 2 groups:
• atrophic changes in the temporal lobes which at various stages of the disease lead to a 4% - 62% decrease in tissue mass (Table 1);
• general cerebral changes (Table 1).
The CT and MRI data obtained has made it possible to compose a scale that allows to determine the severity of atrophic changes in the temporal lobes at each stage of AD development:
• Pre-clinical AD stage—TDR-0: temporal lobes atrophy with a 4% - 8% decrease in tissue mass (Figure 1) which corresponds to 26 - 28 MMSE points (Table 1).
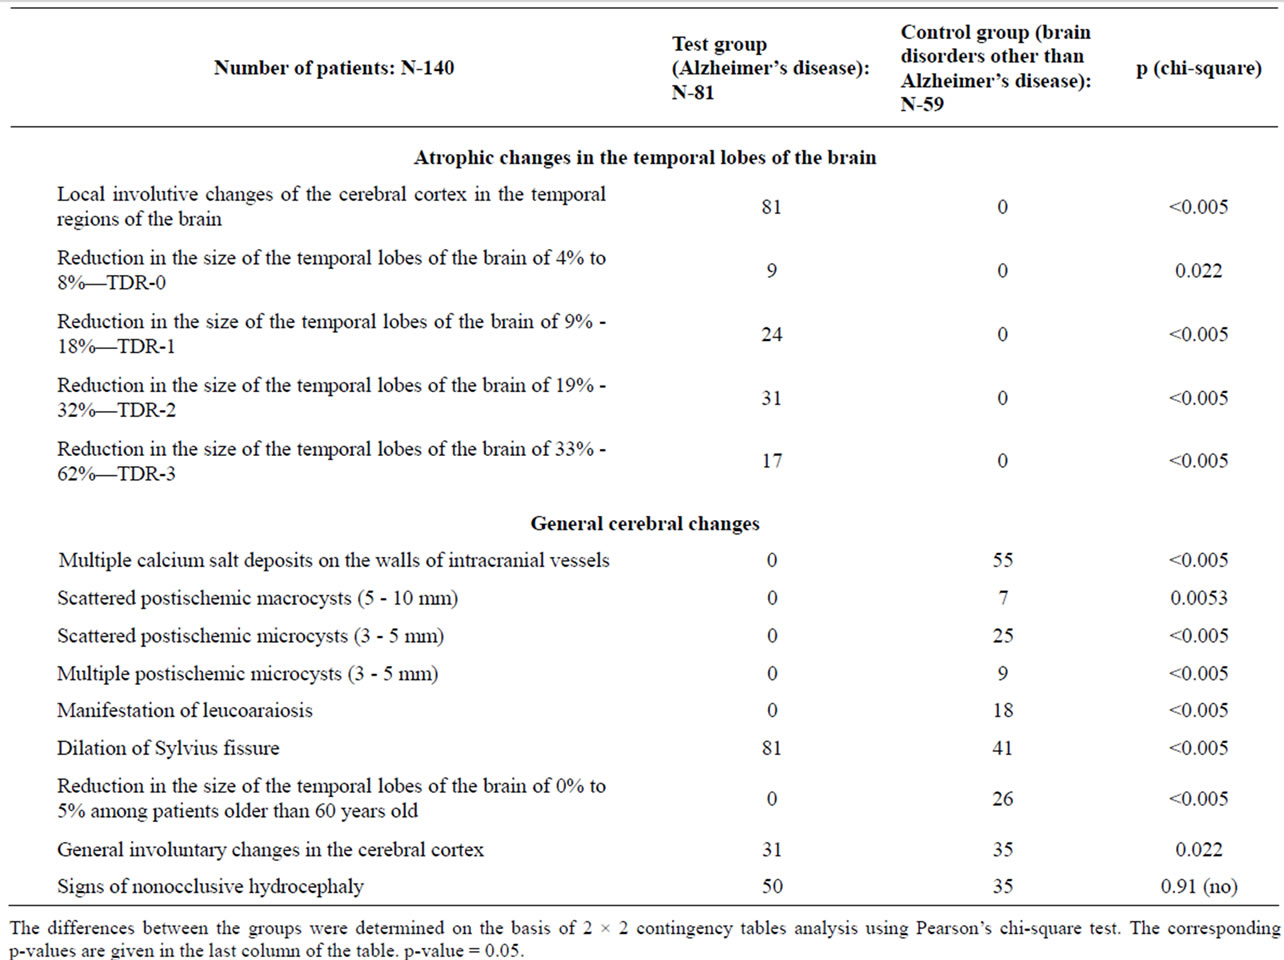
Table 1. CT and MRI data in test and control group patients.
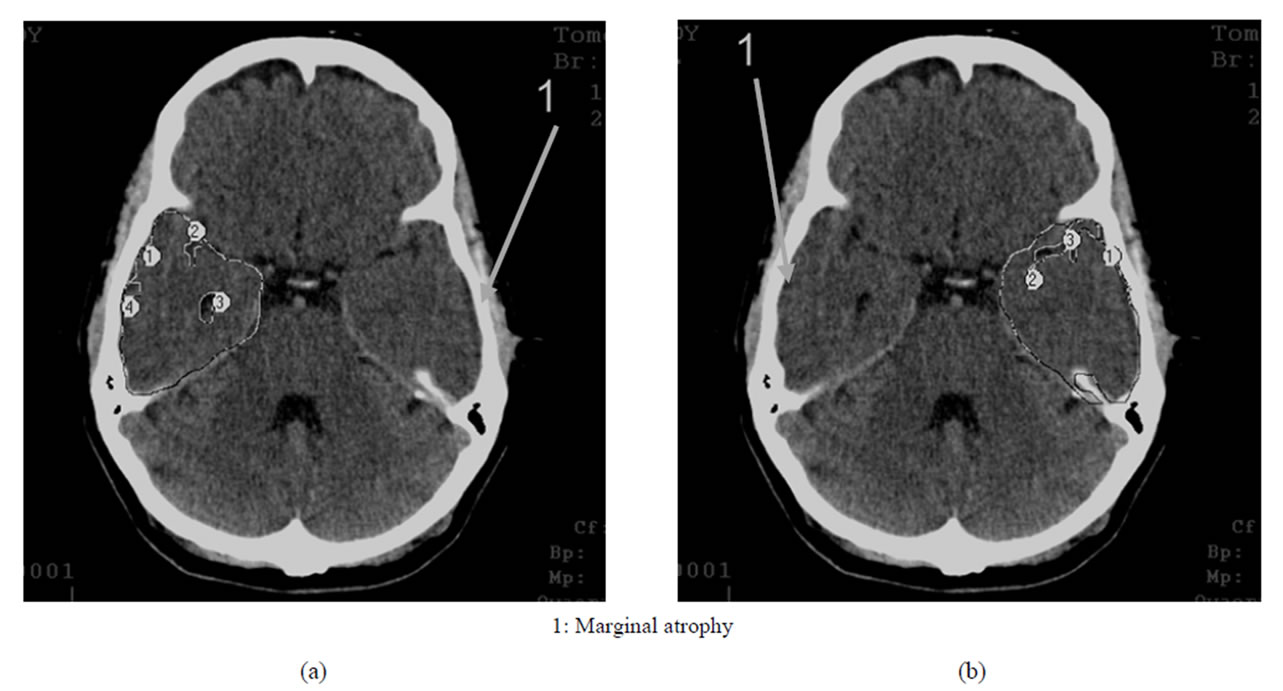
Figure 1. TDR-0: preclinical stage of the disease. Atrophy of the temporal lobes from 4% to 8%, MMSE—26 - 28 points. CT, patient S., 37 years old. Tissue mass reduction. (a) of the right temporal lobe—8% (area 1-4); (b) of the left temporal lobe—7% (area 1-3).
• Early AD Stage—mild dementia—TDR-1: temporal lobes atrophy with a 9% - 18% decrease in tissue mass which corresponds to CDR-1 (Figure 2) and to 20 - 25 MMSE points (Table 1).
• Middle AD stage—moderate dementia—TDR-2: temporal lobes atrophy with a 19% - 32% decrease in tissue mass which corresponds to CDR-2 (Figure 3) and to 12 - 19 MMSE points (Table 1).
• Late AD stage—heavy dementia—TDR-3: temporal lobes atrophy with a 33% - 62% decrease in tissue mass which corresponds to CDR-3 (Figure 4) and to 7 - 11 MMSE points (Table 1).
3.2. Control Group Patients
CT and MRI among Control Group patients revealed certain morphological changes in the brain which can be attributed to general cerebral changes; however, no
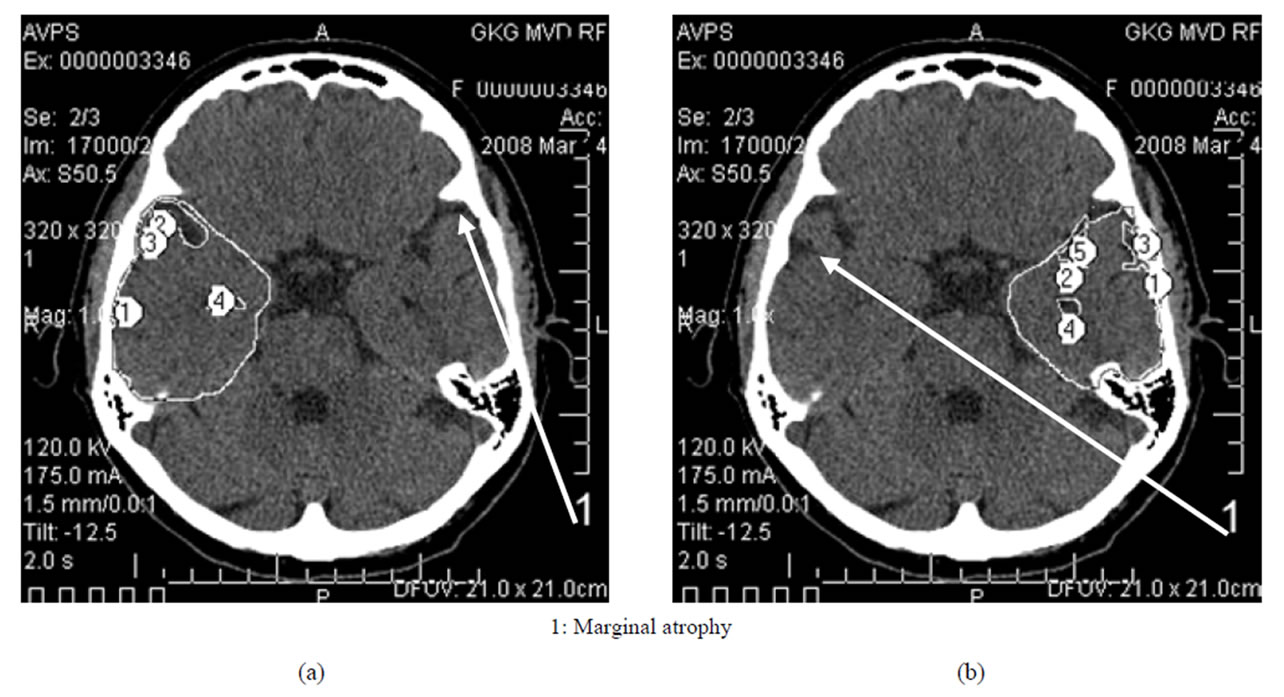
Figure 2. TDR-1: early clinical stage of the disease. Atrophy of the temporal lobes from 9% to 18%, MMSE— 20 - 25 points. CT, patient K., 58 years old. Tissue mass reduction. (a) of the right temporal lobe—13% (area 1-4); (b) Of the left temporal lobe—15% (area 1-5).
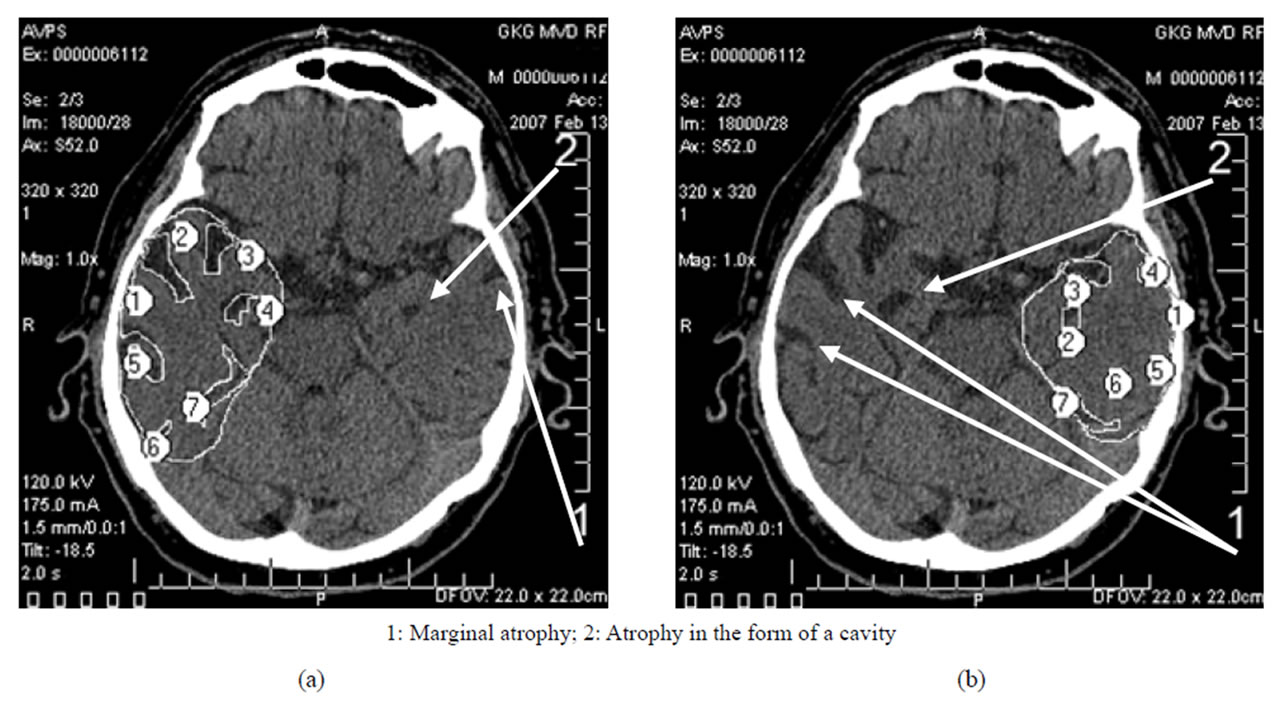
Figure 3. TDR-2: middle clinical stage of the disease. Atrophy of the temporal lobes from 19% to 32%, MMSE—12 - 19 points. CT, patient P., 72 years old. Tissue mass reduction. (a) of the right temporal lobe—27% (area 1-7); (b) of the left temporal lobe—20% (area 1-7).
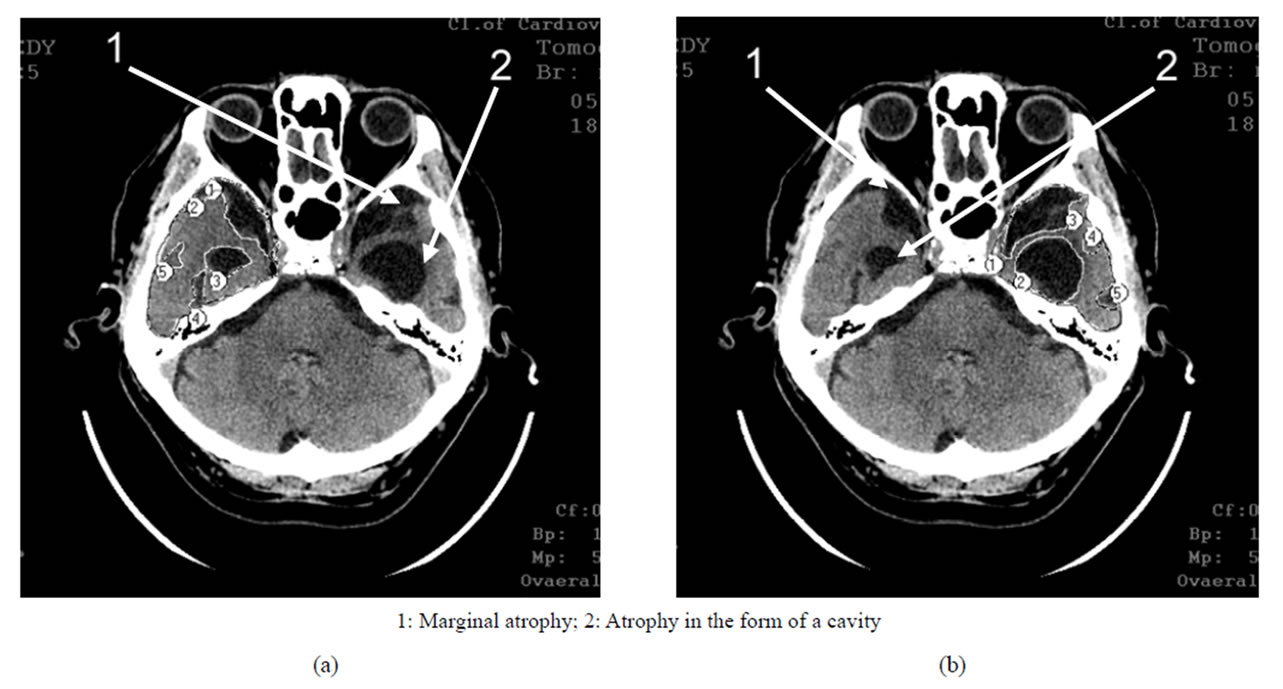
Figure 4. TDR-3: late clinical stage of the disease. Atrophy of the temporal lobes from 33% to 62%, MMSE—7 - 11 points. CT, patient S., 68 years old. Tissue mass reduction. (a) of the right temporal lobe—41% (area 1-5); (b) of the left temporal lobe—62% (area 1-5).
specific atrophic changes in the tissue of the temporal lobes of the brain characteristic of AD have been identified in any case (Table 1).
4. DISCUSSION
Lifetime, based on specific morphological changes differentiation of AD stages, as well as the differentiation between this disease and other neurodegenerative lesions developing in the brain, has until recently remained a fairly serious problem [23,24,26,29]. Of particular difficulty is the identification of these changes among people with preclinical and early stages of the disease which are not characterized by marked dementia and are accompanied only by MCI [8,9].
CT and MRI data show that the examined patients of the Test and Control groups have clear differences of developed morphological and structural defects in the brain [17,19].
People with the pre-clinical stage and a high risk of developing AD, as well as patients with various stages of the disease, have specific structural changes of an atrophic character developing in the temporal lobes of the brain. These changes are characterized by a decrease in the tissue mass of the temporal lobes and the hippocampus, which progresses at each stage of the disease and is at the preclinical stage 4% - 8%, at the early clinical stage 9% - 18%, at the middle clinical stage 19% - 32%, and at the late clinical stage 33% - 62% [17,19,30,32].
In the earlier stages, it is characterized by marginal atrophy (Figures 1 and 2), and in the later stages, the atrophy leads to the formation of cavities in the tissue of the temporal lobes which make 1% - 20% of the total volume of the temporal lobe, the cavities being either single or multiple (Figures 3 and 4) [17,30,32,33].
The extent of these changes increases with the disease progression and is in direct proportion to the stage of AD, the severity of dementia and cognitive impairment [10,17, 19,21,23,30,33]. Each particular stage of the disease corresponds to a definite, clear enough in certain levels reduction of the tissue mass of the temporal lobes of the brain, the degree of which, expressed as a percentage, points to fully developed atrophic changes.
The systematization of these changes has allowed to compose a morphologically conditioned scale—“The Tomography Dementia Rating scale” (TDR scale) of AD stages. Its usage makes it possible to objectively identify the pre-clinical AD stage, as well as to differentiate and determine the clinical stages of AD, which greatly facilitates the diagnosis of the disease.
These atrophic changes localized in the temporal lobes of the brain do not occur among Control Group patients with other brain lesions accompanied by dementia and cognitive impairment.
The data obtained are also supported by research conducted by other authors [20] revealing similar atrophic changes in the temporal lobes of the brain among patients suffering from AD and the absence of such atrophic changes among patients suffering from dementia with Lewy bodies and patients with vascular cognitive disorders.
In contrast to complicated and complex methods [8,9, 22], this scale has a high enough accuracy and is easy to use simultaneously not contradicting but complementing and benefiting “The Clinical Dementia Rating scale” [15].
At the same time, this scale allows to differentiate AD from other diseases that are accompanied by the development of cerebral neurodegenerative changes complicated by dementia and cognitive impairment.
The significance of MRI in determining AD stages by hippocampal atrophic changes, as well as the need for such research, are specifically mentioned in AAIC-2012 resolutions [34].
![]()
![]()
REFERENCES
- (2007) Alzheimer’s disease facts and figures. Alzheimer’s Association. http://www.alz.org/national/documents/report_2007factsandfigures.pdf
- (2009) Alzheimer’s disease facts and figures. Alzheimer’s Association. http://www.alz.org/national/documents/report_alzfactsfigures2009.pdf
- (2010) Alzheimer’s disease facts and figures. Alzheimer’s Association. http://www.alz.org/documents_custom/report_alzfactsfigures2010.pdf
- (2011) Alzheimer’s disease facts and figures. Alzheimer’s Association. http://www.alz.org/downloads/facts_figures_2011.pdf
- (2011) Generation alzheimer’s: The defining disease of the baby boomers. http://act.alz.org/site/DocServer/ALZ_BoomersReport.pdf?docID=521
- Jun, G., Naj, F.C., Beecham, G.M., et al. (2010) Metaanalysis confirms CR1, CLU, and PICALM as Alzheimer disease risk loci and reveals interactions with APOE genotypes. Archives of Neurology, 67, 1473-1484. doi:10.1001/archneurol.2010.201
- Saykin, A.J. and Wishart, H.A. (2003) Mild cognitive impairment: conceptual issues and structural and functional brain correlates. Neuropsychiatry, 8, 12-30. http://www.ncbi.nlm.nih.gov/pubmed/12567329
- Saykin, A.J., Wishart, H.A., Rabin, L.A., et al. (2006) Older adults with cognitive complaints show brain atrophy similar to that of amnestic MCI. Neurology, 12, 834- 842. http://www.neurology.org/content/67/5/834.abstract
- Shen, L.H., Fipri, H.A., Saykin, A.J. and West, J.D. (2009) Parametric surface modeling and registration for comparison of manual and automated segmentation of the hippocampus. Hippocampus, 19, 588-595. doi:10.1002/hipo.20613
- Maksimovich, I.V. (2008) Radiodiagnostics of Alzheimer’s disease. Diagnostics and Intervention Radiology, 2, 27-38. http://www.radiology-di.ru/articles/155/126/tom-2-N4-2008.html
- Mayeux, R., Reitz, C., Brickman, A., Haan, M.N., Manly, J.J., et al. (2011) Operationalizing diagnostic criteria for Alzheimer’s disease and other age-related cognitive impairment—part 1. Alzheimer’s & Dementia, 7, 15-34. http://www.ncbi.nlm.nih.gov/pubmed/21255741
- Seashadri, S., Beaser, A., Au, R., Volf, P.A., Evans, D.A., et al. (2011) Operationalizing diagnostic criteria for Alzheimer’s disease and other age-related cognitive impairment—Part 2. Alzheimer’s & Dementia, 7, 35-52. http://www.ncbi.nlm.nih.gov/pubmed/?term=Operationalizing%20diagnostic%20criteria%20for%20Alzheimer's%20disease%20and%20other%20age-related%20cognitive%20impairment-Part%202
- (2012) Alzheimer’s disease facts and figures. Alzheimer’s Association. http://www.alz.org/downloads/facts_figures_2012.pdf
- (2012) National plan to address Alzheimer’s disease. http://www.whitehouse.gov/blog/2012/05/17/national-plan-address-alzheimers-disease
- Morris, J.C. (1993) The clinical dementia rating (CDR): current version and scoring rule. Neurology, 43, 2412- 2414. doi:10.1212/WNL.43.11.2412-a
- Maksimovich, I.V. and Gotman, L.N. (2006) Method of complex radiation diagnostics at pre-clinical and clinical stages of Alzheimer’s disease. Russian Patent No. 2315559. http://bankpatentov.ru/node/28577
- Maksimovich, I.V., Gotman, L.N. and Masyuk, S.M. (2006) Method of determining dimensions of temporal brain lobes in patients suffering from Alzheimer’s disease. Russian Patent No. 2306102. http://worldwide.espacenet.com/publicationDetails/biblio?DB=EPODOC&adjacent=true&locale=en_EP&FT=D&date=20070920&CC=RU&NR=2306102C1&KC=C1
- Maksimovich, I.V. (2009) Possibilities of modern computed tomography of brain in Alzheimer’s disease diagnosis. The Neurologic Bulletin, 1, 5-10. http://www.infamed.com/nb/1_2009_5-10.pdf
- Maksimovich, I.V. (2011) Dyscirculatory angiopathy of Alzheimer’s type. Journal of Behavioral and Brain Science, 1, 57-68. doi:10.4236/jbbs.2011.12008
- Burton, E.J., Barber, R.E., Mukaetova-Ladinska, B., Robson, J., Perry, R.H., Jaros, E., Kalaria, R.N. and O’Brien, T.J. (2009) Medial temporal lobe atrophy on MRI differentiates Alzheimer’s disease from dementia with Lewy bodies and vascular cognitive impairment: A prospective study with pathological verification of diagnosis. Brain, 132, 195-203. http://www.ncbi.nlm.nih.gov/pubmed?term=%E2%80%9CMdial%20temporal%20lobe%20atrophy%20on%20MRI%20differentiates%20Alzheimer's%20disease%20from%20demetia%20with%20Lewy%20bodies%20and%20vasclar%20cognitive%20impairment%3A%20a%20prospective%20study%20with%252
- Maksimovich, I.V. and Polyaev, Yu.A. (2010) The Importance of early diagnosis of dyscircular angiopathy of Alzheimer’s type in the study of heredity of Alzheimer’s disease. Alzheimer’s & Dementia, 6, e43. http://download.journals.elsevierhealth.com/pdfs/journals/1552-5260/PIIS1552526010023253.pdf
- Dickerson, B.C. (2006) Functional magnetic resonance imaging of cholinergic modulation in mild cognitive impairment. Current Opinion in Psychiatry, 19, 299-306. doi:10.1097/01.yco.0000218602.25346.c6
- Chiang, G.C., Insel, Ph.S., Tosun, D., Schuff, N., TruranSacrey, D., Raptentsetsang, S., Jack, C.R. and Weiner, M.W. (2011) Identifying cognitively healthy elderly individuals with subsequent memory decline by using automated MR temporoparietal volumes. Radiology, 259, 844-851. doi:10.1148/radiol.11101637
- Schuff, N., Insel, Ph., Chiang, G., Truran, D., Gamst, A., Jack, C., Aisen, P., Petersen, R., Shaw, L., Trojanowski, J. and Weiner, M. (2011) Acceleration of brain atrophy rates with advancing cognitive deterioration from normal aging to MCI to Alzheimer’s disease. Alzheimer’s & Dementia, 7, S223. http://www.alzheimersanddementia.com/article/S1552-5260(11)00765-5/fulltext
- Trojanowski, J.Q., Vandeerstichele, H., Korecka, M., et al. (2010) Update on the biomarker core of the Alzheimer’s disease neuroimaging initiative subjects. Alzheimer’s & Dementia, 6, 230-238. http://www.ncbi.nlm.nih.gov/pubmed/20451871
- Meyer, P.T., Hellwig, S., Amtage, F., et al. (2011) Dual-biomarker imaging of regional cerebral amyloid load and neuronal activity in dementia with PET and 11C-labeled Pittsburgh compound B. Journal of Nuclear Medicine, 52, 393-400. doi:10.2967/jnumed.110.083683
- Perrin, R.J., Craig-Schapiro, R., Morris, J.C., et al. (2011) Identification and validation of novelcerebrospinal fluid biomarkers for staging early Alzheimer’s disease. Public Library of Science, 12, e16032. http://www.ncbi.nlm.nih.gov/pmc/articles/PMC3020224/?tool=pmcentrez
- Jack, C., Vemuri, P.H., Viste, H., et al. (2011) Ordering of Alzheimer’s disease biomarkers. Alzheimer’s & Dementia, 7, S4-S5. doi:10.1016/j.jalz.2011.05.011
- De la Torre, J.C. (2012) A turning point for Alzheimer’s disease? Biofactors, 38, 78-83. doi:10.1002/biof.200
- Maksimovich, I.V. (2012) The tomography dementia rating scale—Morphologicalli determined scale of Alzheimer’s disease stages. http://www.alzheimersanddementia.com/article/S1552-5260(12)01059-X/fulltext
- Folstein, M.F., Folstein, S.E. and McHugh, P.R. (1975) Mini-mental state. A practical method for grading the cognitive state of patients for the clinician. Journal of Psychiatric Research, 12, 189-198. doi:10.1016/0022-3956(75)90026-6
- Maksimovich, I.V. (2010) Dyscirculatory angiopathy of the brain of Alzheimer’s type. Alzheimer’s & Dementia, 6, e34. http://www.alzheimersanddementia.com/article/S1552-5260(10)02300-9/fulltext?articleId=&articleTitle=&citedBy=false&isTabularSearchRequestOnSearchResultPage=no&medlinePmidWithoutMDLNPrefix=&overridingDateRestriction=&related=false&restrictdesc_author=&restr
- Maksimovich, I.V. (2012) Endovascular application of low-energy laser in the treatment of dyscirculatory angiopathy of Alzheimer’s type. Journal of Behavioral and Brain Science, 2, 67-81. doi:10.4236/jbbs.2012.21008
- (2012) Alzheimer’s Association International Conference in Vancouver, British Columbia, Canada, 14-19 July 2012. http://www.alz.org/research/funding/partnerships/ww-adni_overview.asp