Engineering
Vol. 3 No. 10 (2011) , Article ID: 8081 , 10 pages DOI:10.4236/eng.2011.310124
Experimental Study on the Flow Characteristics of ㄱ-Type Groyne
Department of Water Resources Research, Korea Institute of Construction Technology, Ilsan, Korea
E-mail: {jgkang02, yeo917}@kict.re.kr
Received August 19, 2011; revised September 1, 2011; accepted September 10, 2011
Keywords: ㄱ-Type Groyne, Thalweg Line, Separation Line, Recirculation Zone, LSPIV
ABSTRACT
A hydraulic model test for ㄱ-type groynes (with “ㄱ” shape) was conducted to analyze the flow characteristics around these groynes. The results of the model tests are expected to be used as fundamental information in designing the ㄱ-type groyne constructed in the field. Main hydraulic factors such as velocity and thalweg line changes in the main channel and separation area were analyzed in this study. The thalweg line is a stream line where the maximum velocity occurs, whereas the separation area is the boundary between the main flow and the recirculation zone. Model tests with 5 different arm lengths of the ㄱ-type groynes were conducted by changing the velocity. The LSPIV (Large-Scale Particle Image Velocimetry) technique was used to measure and analyze flow variation around the ㄱ-type groynes. The velocity in the main channel measured to be increased by 1.5 times. The velocity variation on groyne arm length is little. The width of the thalweg lines (TCL) was changed to 55% - 57% of the channel width. The Froude number did not affect the thalweg line (TCL) and separation line (Sh) changes, however.
1. Introduction
A groyne is a structure installed around the front part of the lakeside or riverside to protect the river or embankment from erosion caused by flows through the control of flow direction and velocity in a river. A groyne has the function of aquatic life’s shelter or habitat, and interest in groynes increases from the river and ecosystem restoration perspective. A groyne has advantages such as reducing velocity around the embankment and diversifying river flows through the formation of a recirculation zone. In addition, it partially disrupts the flow of a river, thereby influencing riverbed change by increasing velocity around the main channel. In Europe, groynes are mostly used for canals; thus, they have been used to secure the depth of the main channel. In Korea, however, it is difficult to find cases of groynes being installed for purposes of canal. Most groynes are installed for river environment improvement and embankment protection. Consequently, groyne design in Korea should be carried out in the direction of minimizing the existing channel changes and securing environmental functions such as ecosystem habitat. The types of groynes are highly diverse, and there are differences in the flows of the groyne area and the main channel’s flow variation according to the type of groyne. Therefore, it is very important to select the type of groyne according to installation purpose and decide flow variations depending on the types of groyne. Note, however, that studies on the types of groyne mostly deal with non-penetration, penetration, and overflow groynes, with very few studies on their unique shapes. Although various types of groynes are proposed and designed, they are constructed using empirical methods without design guidelines for each type of groyne.
Looking into the existing studies, the experimental study of Francis, et al. [1] on the recirculation zone at downstream groynes can be said to be the first study on the recirculation zone around groynes, but velocity measurement was not performed. Velocity measurement on the flow area around the groyne area was attempted by Rajaratnam and Nwachukwu [2]. Their study was carried out on two types of non-penetrated groynes with different lengths: they measured flow area by dividing into  and
and  d (x: length of channel, y: vertical distance from the embankment, b: length of groyne) around the groynes. Note, however, that they could not attempt flow analysis under various conditions since they applied only two types of groynes. Tingsanchali and Maheswaran [3] carried out numerical value interpretation on the recirculation zone at the downstream groyne and presented the main characteristics of the local flow field around groynes but dealt only with non-penetrated groynes; they did not cover the groyne’s impacts on the downstream separation area and thalweg line. A recent study was carried out by Ettema and Muste [4], but they analyzed only the reduced scale of impacts on the groyne’s downstream recirculation zone and thalweg line along with the downstream recirculation zone of the non-penetrated groyne according to length change. Ettema and Muste did not analyze various types of groynes. Uijttewaal [5] attempted hydraulic experiments on the four types of groynes (2 cases of non-penetration and 1 case each of penetration and overflow). He used a PTV (Particle Tracking Velocimetry) technique for velocity measurement and interpreted flow around groynes through the surface flow value. Nonetheless, the flow analysis was limited to around the groynes; it did not address the separation zone and thalweg line.
In Korea, study data related to groynes are very insufficient. Kang, et al. [6] proposed an experi-mental formula on the recirculation zone at the downstream area through experiments on the recirculation zone at downstream groynes on the groyne line end’s velocity penetration rate, approaching velocity, and groyne length as the major elements of maximum scour. Yeo, et al. [7] presented the separation zone and thalweg line on the I-type, nonpenetrated groyne and carried out an experimental study on the main flow variations but did not deal with various types of groynes. This study interpreted flows around groynes targeting the ㄱ-type groynes, which are extended to the end of the upstream area. Concerning the ㄱ-type groyne, the recirculation zone, flow variations in the channel and embankment, flow characteristics, and change aspect of the thalweg line and separation area were comparatively analyzed on 5 different arm length conditions and 3 types of velocity condition. This study aimed at providing basic data to forecast flow variation according to groyne type. Specifically, this study focused on offering basic data for groyne design by identifying the flow characteristics around groynes to propose the modified ㄱ-type groynes, not the horizontal groyne type.
2. Main Parameter
The flow variation section generated by groyne installation can be divided into the main flow area generated by protrusion of groyne and recirculation area (groyne area) at the downstream area of groynes; the separation line can be used as area division. The classification impacts caused by groyne installation can include riverbed change arising from velocity increase and main flow variation brought about by the change of thalweg line. The impacts on the downstream area of groynes include flows within the recirculation zone, with the generation of reverse flow as typical flow variation. Concerning the flow at the recirculation zone, velocity diminished compared to the flow at the upstream area of groynes; the reduced velocity can prevent embankment erosion because of tractive force. The flow can be used as habitat of aquatic organisms and shelter in case of flood, thanks to velocity distribution under various conditions.
This study analyzed the maximum velocity change, maximum thalweg line change in the main flow area, and velocity in the change area of the maximum thalweg line as well as the recirculation zone size and flow around the embankment at the downstream area of groynes to analyze the impacts on ㄱ-type groynes. Figure 1 shows the diagram of flow variation by groyne. Although a thalweg line means the line connecting the maximum depth from the channel toward the flow direction, this study set the riverbeds of the experimental channel to be the same and defined the channel’s central line as the thalweg line.  indicates the change scope of the thalweg. The recirculation zone can be defined by length (SL) and width
 . SL denotes the maximum downstream length of the separation line from the groyne installation spot, whereas
  means the largest side width. This study defined the angle through which flow is separated from the groyne line end as separation angle
 , and the angle on the length from the groyne end to the embankment where the recirculation zone is generated, as incidence angle
 . The sizes of these are mainly referred to when the embankment protection effect limits and habitat improvement effects caused by groyne installation are estimated. Define abbreviations and acronyms the first time they are used in the text, even after they have been defined in the abstract. Abbreviations such as IEEE, SI, MKS, CGS, sc, dc, and rms do not have to be defined. Do not use abbreviations in the title or heads unless they are unavoidable.
3. Hydraulic Experiment
The channel used for the hydraulic model experiment of the ㄱ-type groynes was straight line channel with width of 2.0 m, length of 40 m, and height of 0.8 m. For the experiment, five types of groyne models were used: 0.15 for the rate of channel width to groyne length (l/B), with arm length of 20%, 40%, 60%, 80%, and 100% of the groyne length (l) (AL/l = 0.2, 0.4, 0.6, 0.8, 1.0, respectively).
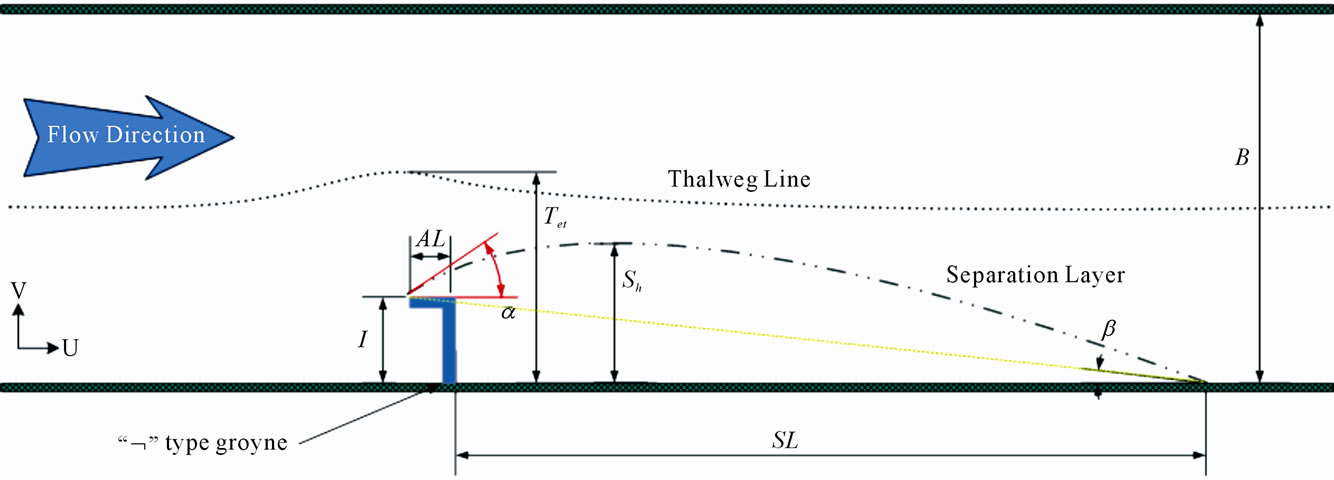
Figure 1. Characteristics and definitions of flow variations around the single ㄱ-type groyne.
The experiment was carried out by installing each model at the right embankment at the downstream area 15 m away from the upstream end as shown in Figure 2. Velocity at the inflow area was measured using the 3D ADV velocity meter and LSPIV; the experiment conditions are presented in Table 1. Concerning velocity conditions, experiments under 15 conditions were conducted on three conditions each at the scope of 0.25 m/s - 0.40 m/s. As depth condition, 0.15 m was to be maintained through water level control at the downstream area. Figure 3 shows the model channel and ㄱ-type groyne installation.
The LSPIV (Large-Scale Particle Image Velocimetry) technique, which analyzes the images obtained through video camera shooting on flow characteristics around groynes, was used. Through this, the surface flow field was analyzed. This study also reviewed flow distribution as analyzed through the LSPIV technique regarding the channel of the groyne installation section and groyne area section.
The LSPIV technique can obtain the instantaneous flow field of the entire target area by overcoming the limit of the measuring equipment based on existing sensors such as LDV and ADV. Having the same basic principle as the existing PIV technique, the LSPIV technique shoots the target area using a video camera and processes it just like software. There are no restrictions on laser examination and camera arrangement, which are essential in the existing PIV technique. The disadvantage of the LSPIV technique is that acquiring information on the 2D or 3D flow field in water is difficult because of the absence of a laser examination procedure. Depending on the cases, there are many instances of obtaining distorted images; hence the need for correlation analysis after carrying out the correction work of shot images prior to image processing. As such, accuracy is lower compared to the existing PIV technique. Despite such disadvantage, the LSPIV technique was used because the entire flow field could be measured at much less cost and effort within a short time compared to the existing equipment, manpower use in a large-scale experiment, and site survey. Therefore, the LSPIV technique is applied to hydraulic model experiments or river site [8-10]. Since the experiment sought to compare and test the effects according to the groyne design elements, the LSPIV technique adoption was considered to be advantageous because more measured data could be obtained compared to the existing measuring devices in terms of LSPIV technique-adopted surface layer flow field measurement.
Flow distribution analysis is designed to identify flow variation arising from channel installation; this study analyzed the flow in the groyne section by making the total average flow dimensionless. An experiment using the LSPIV technique and analysis section’s flow distribution was conducted. Flow field was analyzed with 50 lattices having 0.04 m gap toward the channel width direction. Through the analysis of the values of 1, 2, …, 12 on the groyne length, flow direction was identified. A digital camcorder (DCR-PC350, Sony Co.) was used for the shooting of the flow field; propped rice was used as floating particles. For the software, CACTUS 3.1 (IIT Co.) was used for basic image processing and analysis such as distorted image correction.
4. Result Analysis
The ㄱ-type groyne experiment was carried out on 5 different arm lengths, and analysis on the hydraulic characteristics change was performed including the length of the recirculation zone at the groyne end, flow separation, and flow variation at the line end on the arm length change. The data measured in the experiment as obtained using LSPIV is shown in Table 2. For the rate of groyne arm length, arm length (AL) was made dimensionless with groyne length . As for the separation length rate, separation length
  was made dimensionless with groyne arm length (AL). The separation angle
  refers to the angle extending by clash between the inflow area flow and main flow at the ㄱ-type
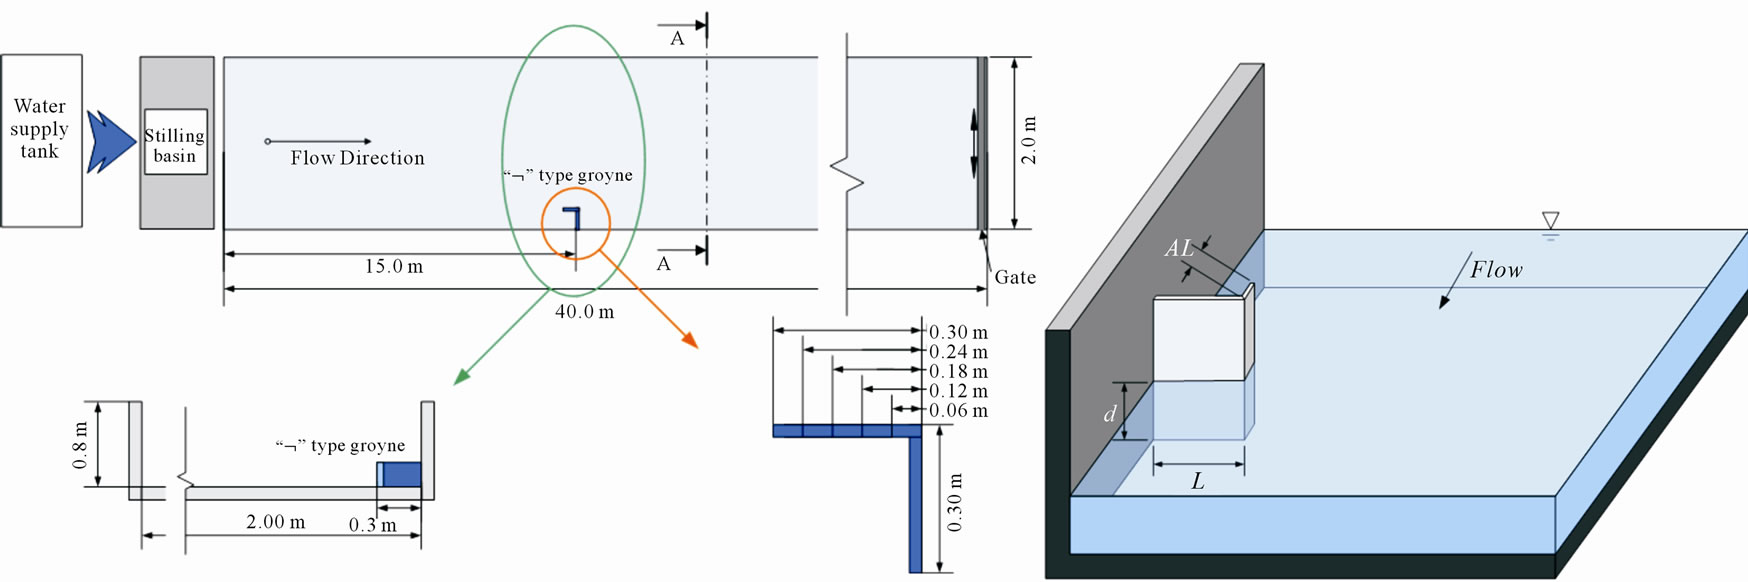
Figure 2. Plan view of ㄱ-type groyne in channel.
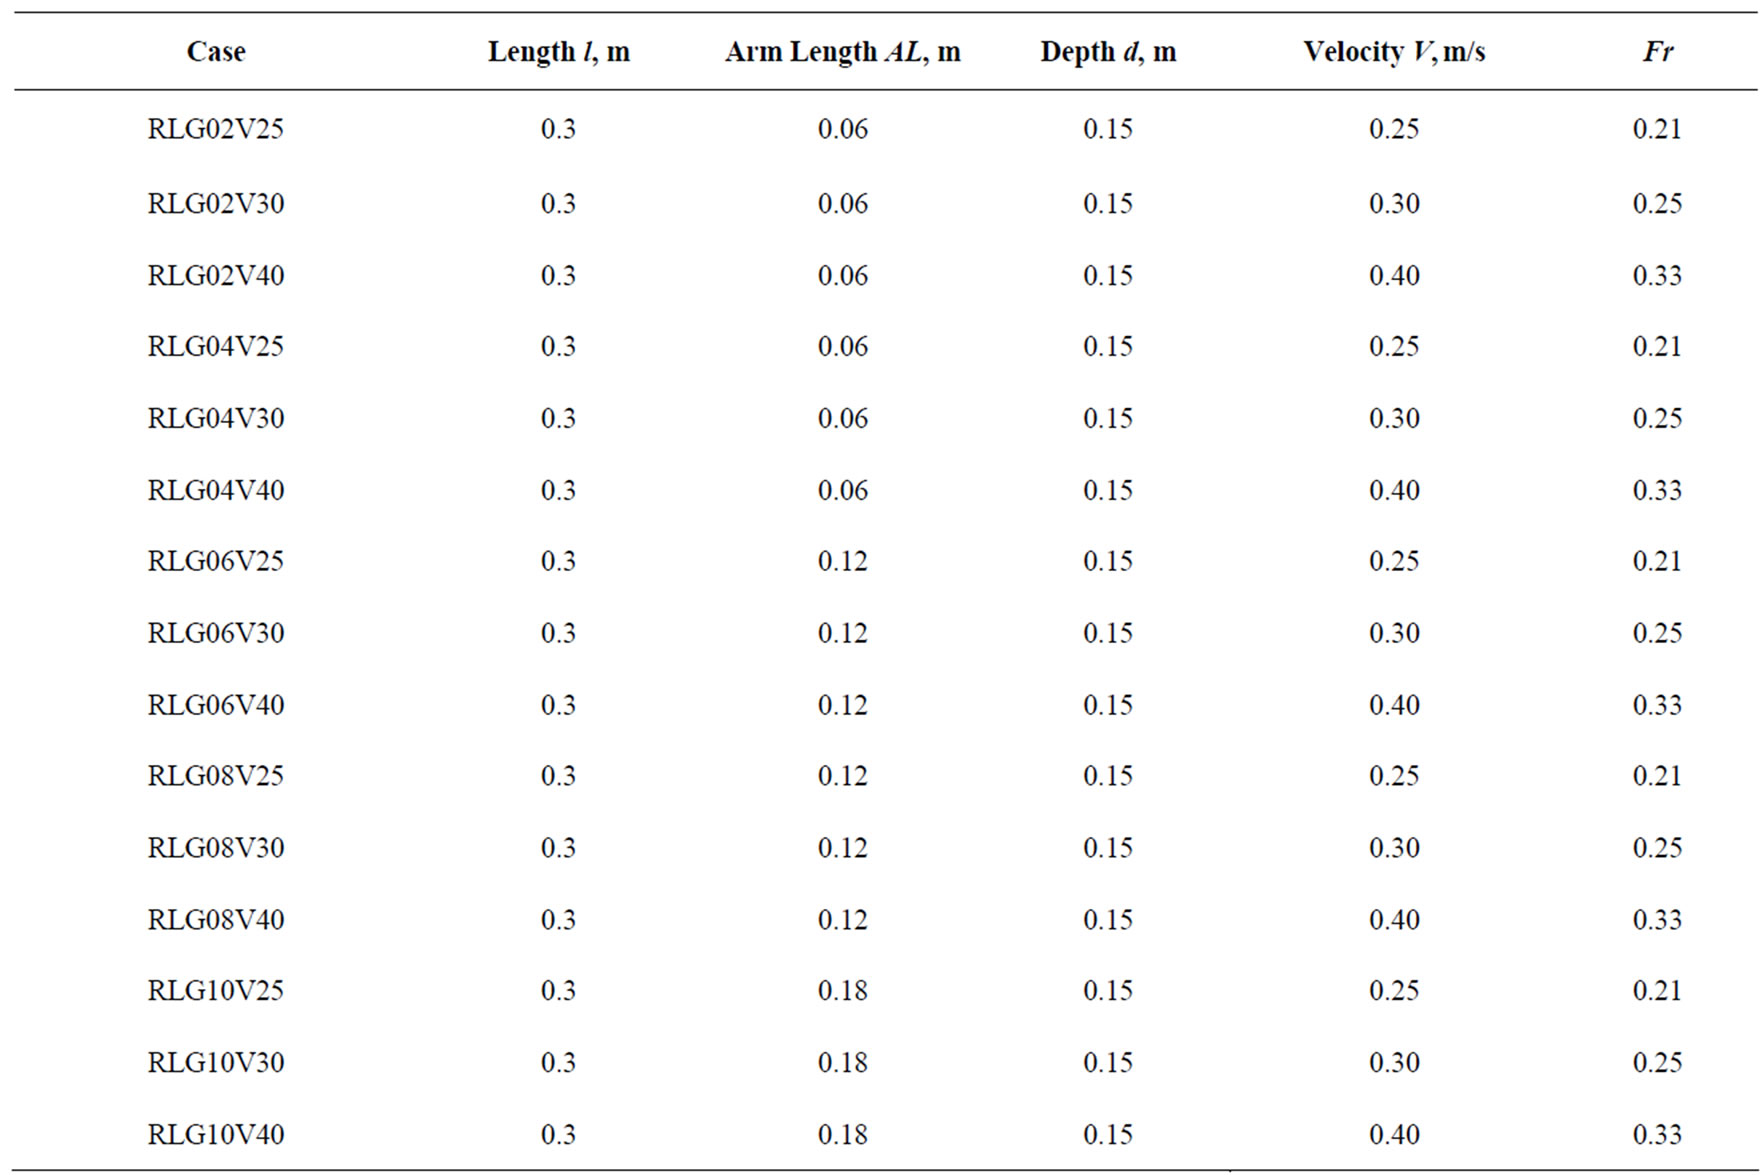
Table 1. Experimental conditions of ㄱ-type groyne.
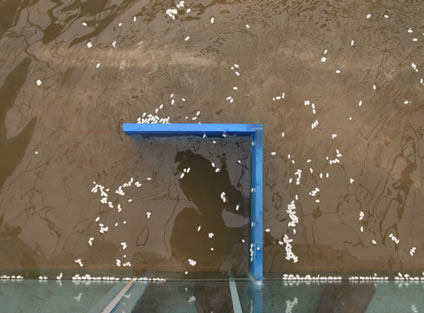
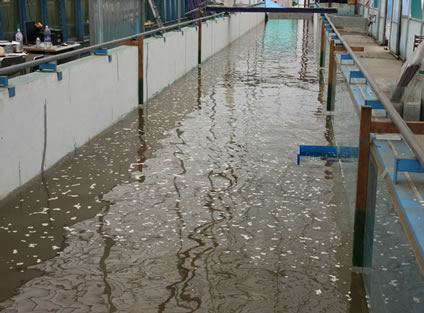
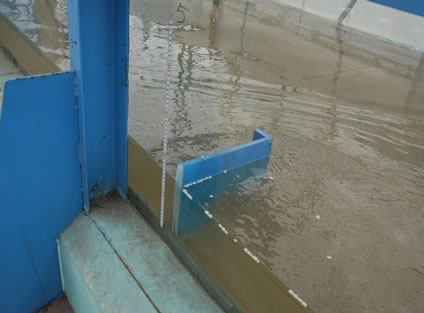
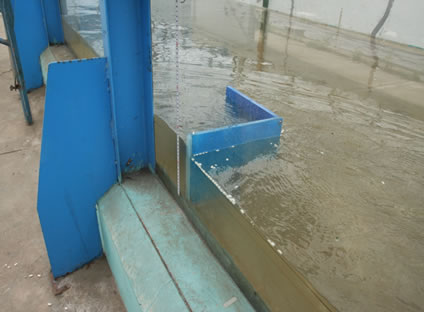
Figure 3. Experimental setting on ㄱ-type groyne.
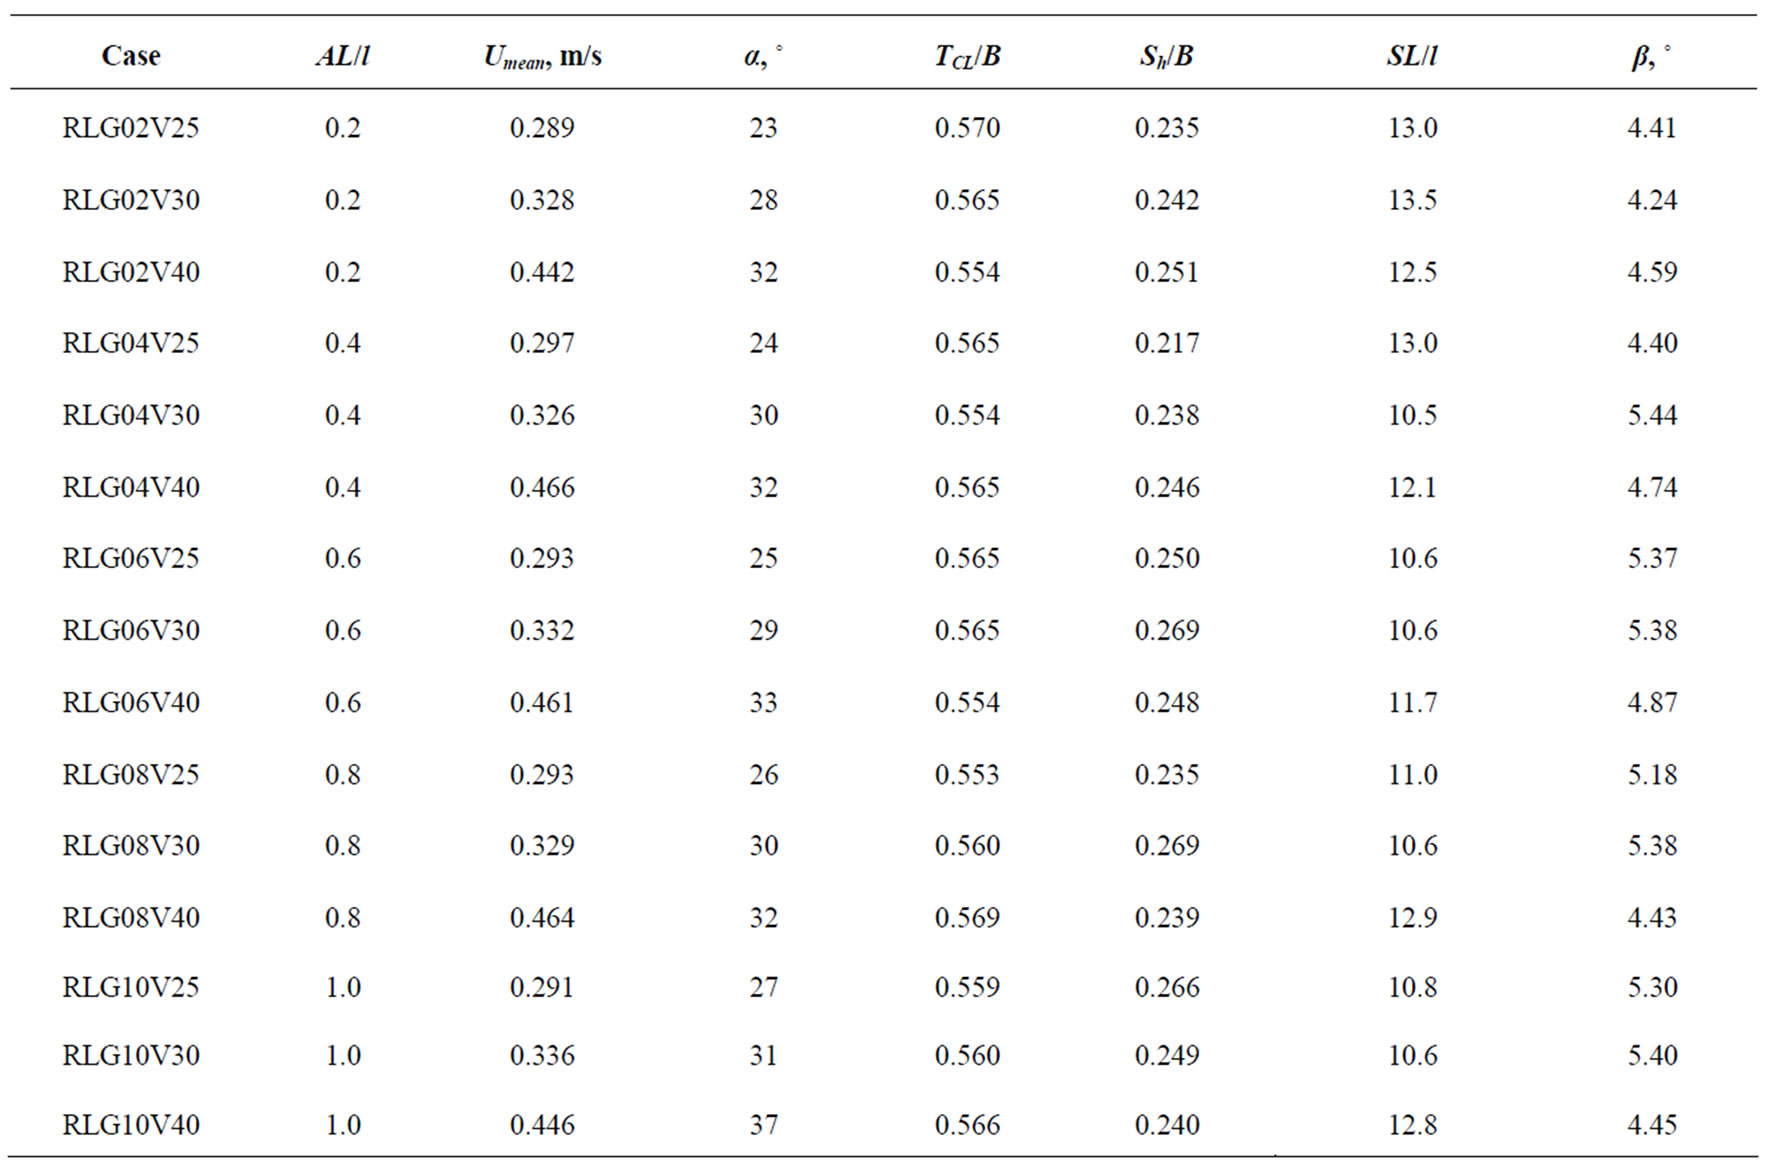
Table 2. Experimental results of single ㄱ-type groyne.
groyne line end. The incidence angle  pertains to the angle from the groyne line end to the embankment where the recirculation zone is generated.
4.1. Thalweg Line and Recirculation Zone
The flow around groynes forms the thalweg line change and recirculation zone in the main flow area, whereas flow angle changes from the groyne line end to the direction of the thalweg line. Figure 4 illustrates as the stream line the flow analysis results according to the change of ㄱ-type groyne arm lengths through which the separation angle, thalweg line, and recirculation zone can be identified.
The separation angle  on the t-type groyne was designed to identify flow variation around the end of the groyne. It was compared with Froudle (Fr) and AL/l as shown in Figures 5 and 6, respectively. The separation angle at the groyne line end was measured at the 23˚ - 37˚ section in proportion to Fr. No big difference was observed in comparison with the separation angle of the non-penetrated groyne, with the same groyne length measured between 30˚ and 35˚. At the front part flow of the ㄱ-type groyne, stagnant flow and small overflow within the groyne area covered with groyne arm from the groyne installation spot were formed. The stagnant area of the front of the groyne disrupted the flow in channel and caused the formation of the separation angle. The separation angle according to the groyne arm length extended by 3˚ - 5˚ as the arm length increased; this is related to the impacts of slip coming from the rear of the groyne.
The thalweg line was assumed to be that at the upstream of the groyne. When the riverbed height of the
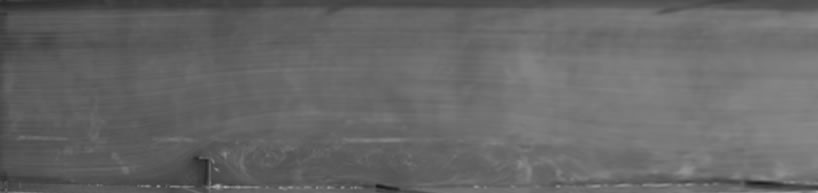 (a)
(a)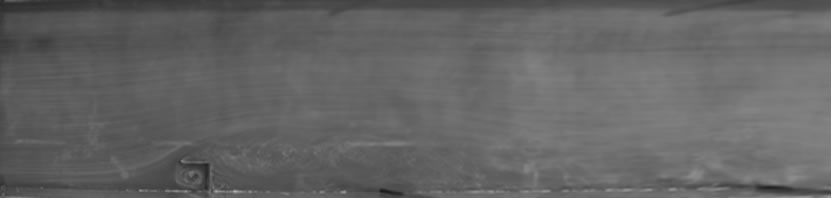 (b)
(b)
Figure 4. Measured image and vector fields (AL/l = 0.2, 0.4, 0.6, 0.8, 1.0; Vapp = 0.25 m/s), (a) RLG04V25 (AL/l = 0.4, Vapp = 0.25), (b) RLG10V25 (AL/l = 1.0, Vapp = 0.25).
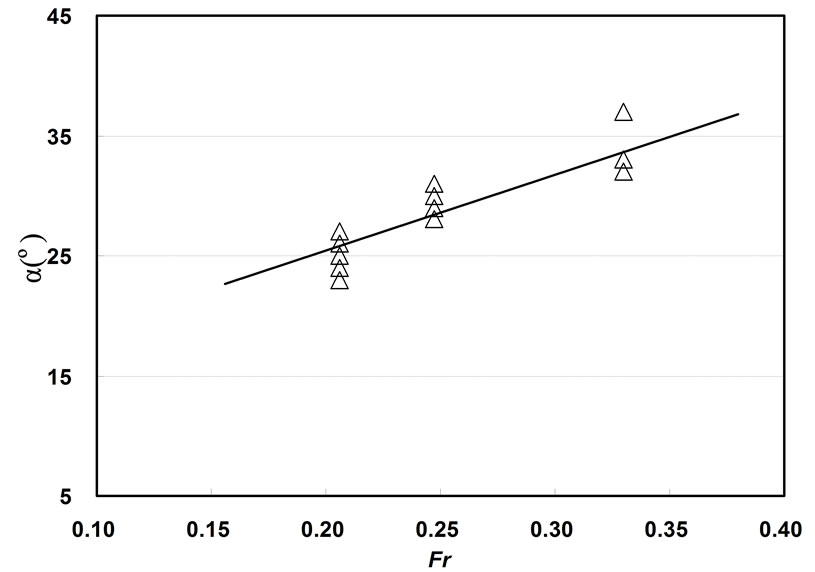
Figure 5. Relationship of α and Fr.
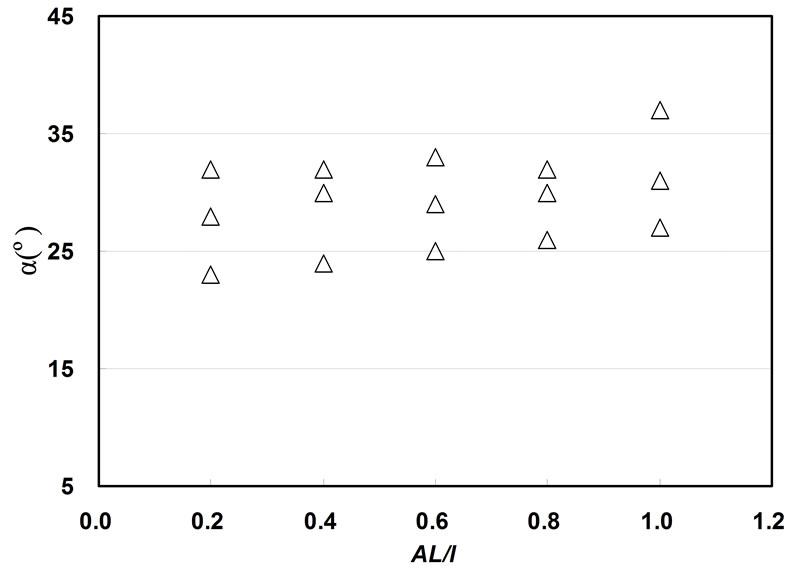
Figure 6. Relationship of α and AL/l.
cross section is constant, the thalweg is the stream line where maximum velocity occurs. The change of thalweg line is an important factor in analyzing the main flow’s change and can be an element that can evaluate the riverbed change of a channel. The separation area can serve as a factor in embankment evaluation and water ecosystem habitat evaluation by evaluating the groyne area where various flows exist.
Each experiment used the surface velocity field measurement results to identify the thalweg line change and separation area size. Through the experiments, this study measured maximum thalweg distance  from the groyne installation wall as well as the separation area’s width
  and analyzed each flow condition and groyne arm length rate.
Figure 7 shows the changes of thalweg line and separation area according to the flow conditions. The length axis was made dimensionless by dividing the vertical direction length (y) by the channel width (B) from the channel installation wall. The width axis was made dimensionless by dividing the distance from the groyne installation spot to the downstream area by groyne length  with regard to the flow direction.
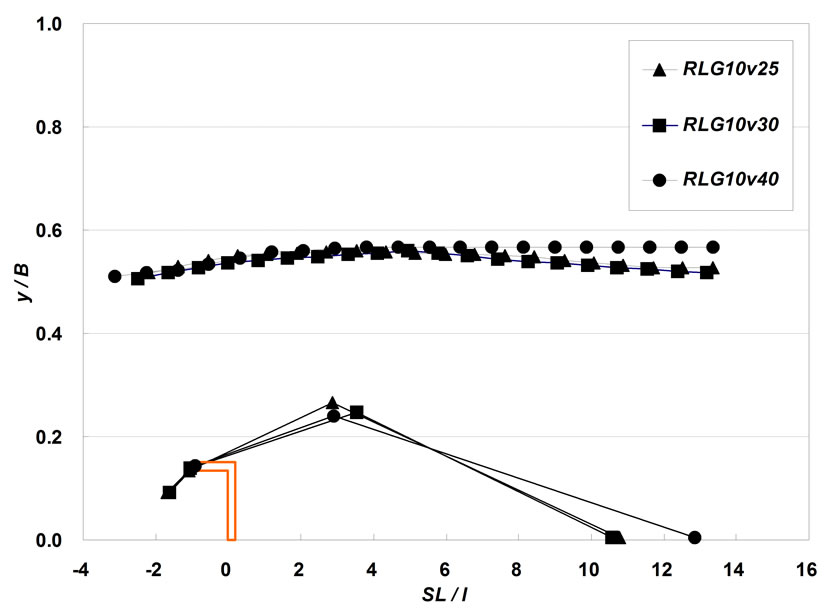
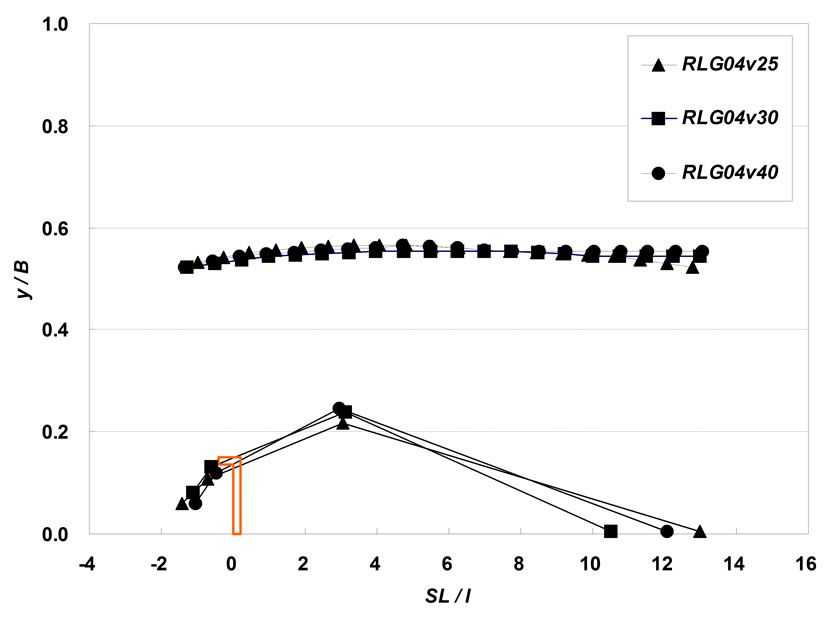
Figure 7. Variation of thalweg alignment and separation area.
The thalweg line  according to the ㄱ-type groyne installation was not influenced by Fr and arm length rate as shown in Figures 8 and 9, respectively. The size was about 55% - 57% of the channel width. In the case of the L-type groyne studied by Kang, et al. (2008),
  affected 55% - 58% of the channel width; based on this result, the change of thalweg line by groyne arm was minimal. Such result was proven by studies on I-type groynes by Ettema and Muste [4] and Yeo, et al. [7]. In the ㄱ-type groyne, the influence of Fr was small. Note, however, that
  of the ㄱ-type groyne decreased in general compared to the I-type groyne’s
 . This suggests that separation at the groyne line end of the groyne arm has less effect than the I-type groyne.
Figures 10 and 11 compare Fr and arm length, respectively, with regard to the separation height  of the ㄱ-type recirculation area. When the size of
  according to Fr was indicated as the rate of channel width (B), i.e., as
 , the separation height of the ㄱ-type groyne accordinig to velocity increase showed a similar trend as the I-type groyne as well as values between 20% - 30% of the channel width and within two times the
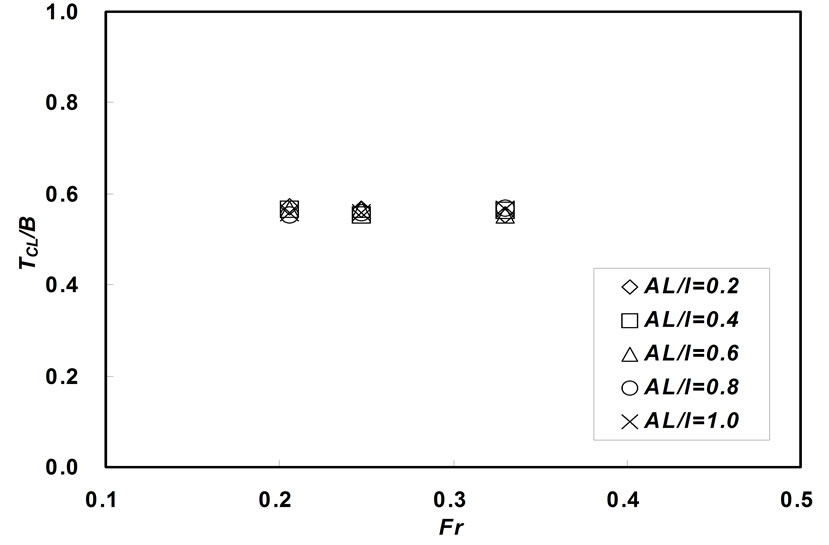
Figure 8. Relationship of TCL and Fr.
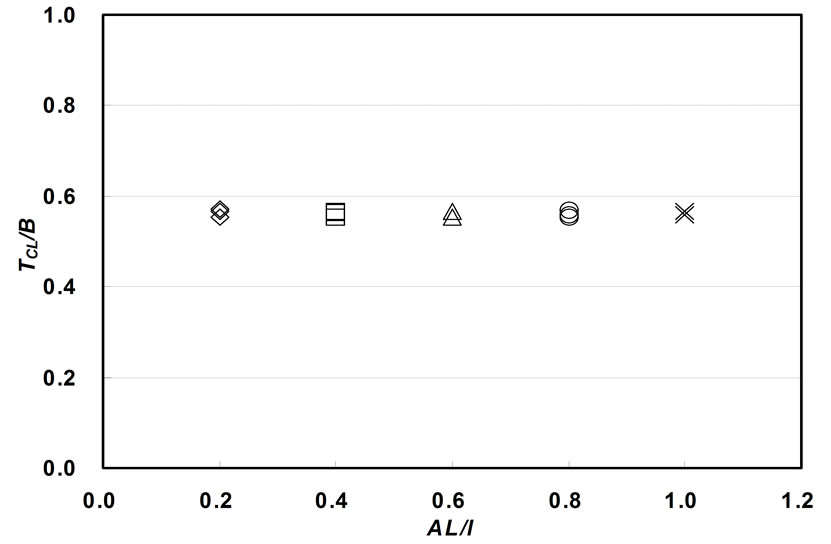
Figure 9. Relationship of TCL and AL/l.
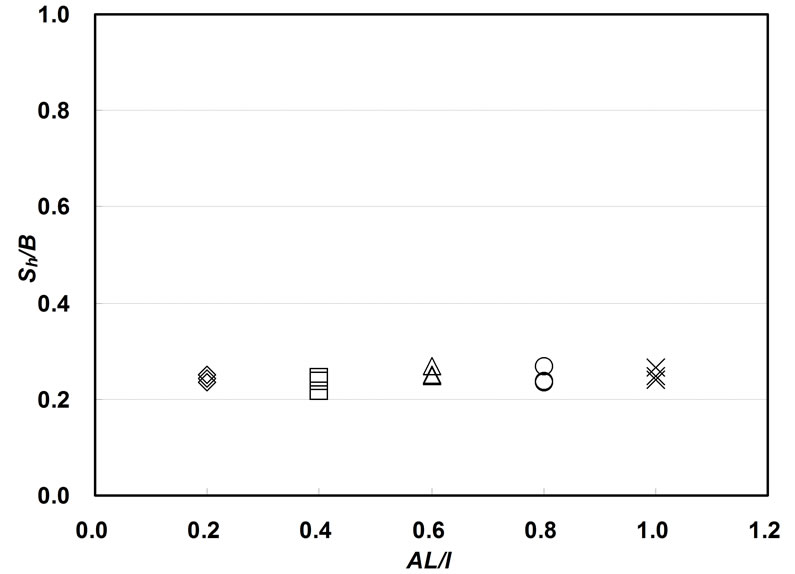
Figure 10. Relationship of Sh and Fr.
groyne length. The change of separation height compared to arm length rate showed no major difference, implying that AL on Fr does not have a huge effect on the separation height generated in the recirculation zone like the experimental results on
 .
.
4.2. Velocity Distribution Change
This study analyzed the velocity distribution change by
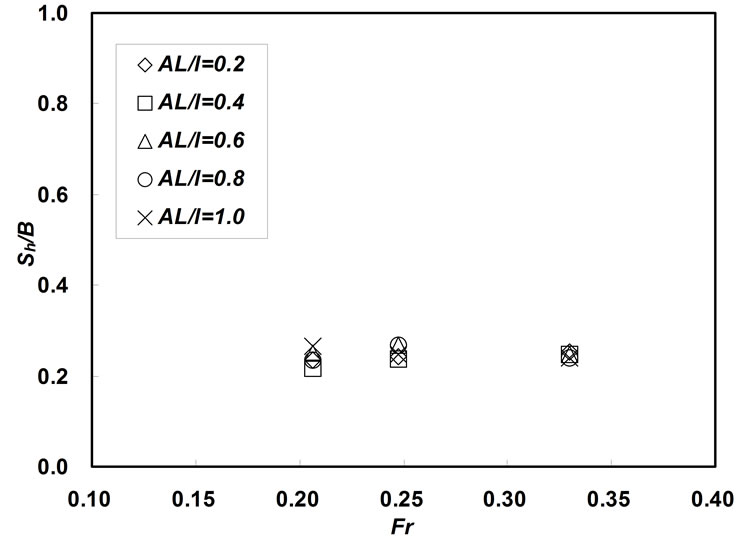
Figure 11. Relationship of Sh and AL/l.
dividing it into the main flow area and recirculation zone. Concerning the main flow area, increasing velocity owing to groyne installation was reviewed. Regarding the recirculation zone, the change at embankment was investigated. Flow variation is an important element caused by groyne installation. Velocity increasing at the main flow will affect the existing river bed change, with various velocity distributions at the recirculation zone impacting sedimentation, embankment protection, and ecosystem habitat offering.
Figure 12 illustrates the horizontal direction velocity distribution on some experiment types (groyne arm length, velocity). Velocity distribution by cross section was made dimensionless on average velocity . In the X-axis, velocity at the ㄱ-type groyne installation spot and downstream area was made dimensionless with approaching velocity. In the Y-axis, horizontal distance was made dimensionless with channel width (B). The maximum velocity at the main flow area within the channel was observed to be 1.6 times the average velocity. Various types of velocity were distributed in the recirculation zone, with reverse velocity occurring at the embankment. Velocity was also observed to be within 0.4 times the average velocity. The velocity at the main flow in the groyne installation section increased compared to the velocity at the upstream area without groyne installation; this was because the control of water flow declined owing to groyne installation. The maximum velocity and its spot are at the central part of the channel where groynes are not installed, but the velocity will increase and the spot will move due to the recirculation zone if groynes are installed. Figures 13 and 14 review the relationship of arm length rate and Fr by making the maximum velocity
  dimensionless with average velocity. The maximum velocity rate in the ㄱ-type groyne tended to decline as arm length rate increased. As Fr increased, the maximum velocity rate gradually rose, but the change was not high at 1.4 - 1.6 times the average velocity.
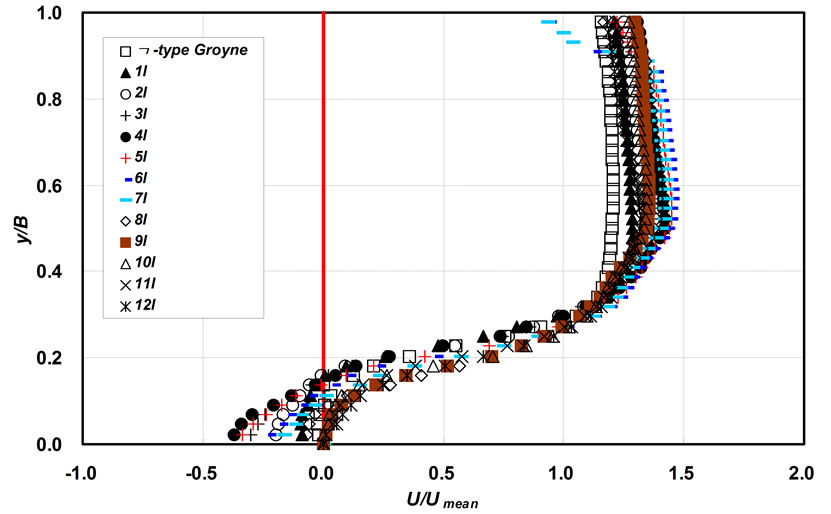

Figure 12. Velocity distributions of groyne field (RLG04V30, RLG10V30).
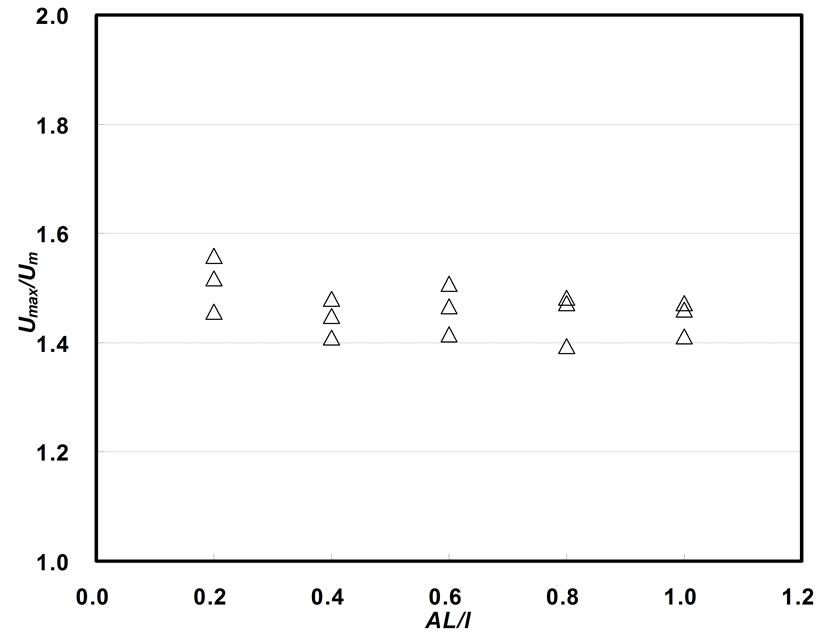
Figure 13. Relationship of Umax/Um and AL.
The velocity of the cross section around ㄱ-type groynes differed by case, but velocity increase at the channel was measured to be 1.4 - 1.5 times that of the approaching channel in the case of the I-type groyne with no groyne arm [7]. From this, velocity change at the channel according to the groyne arm length was considered minimal.
In the recirculation zone formed by groyne installation, various velocities were distributed; in particular, the velocity around the embankment decreased. Therefore, an
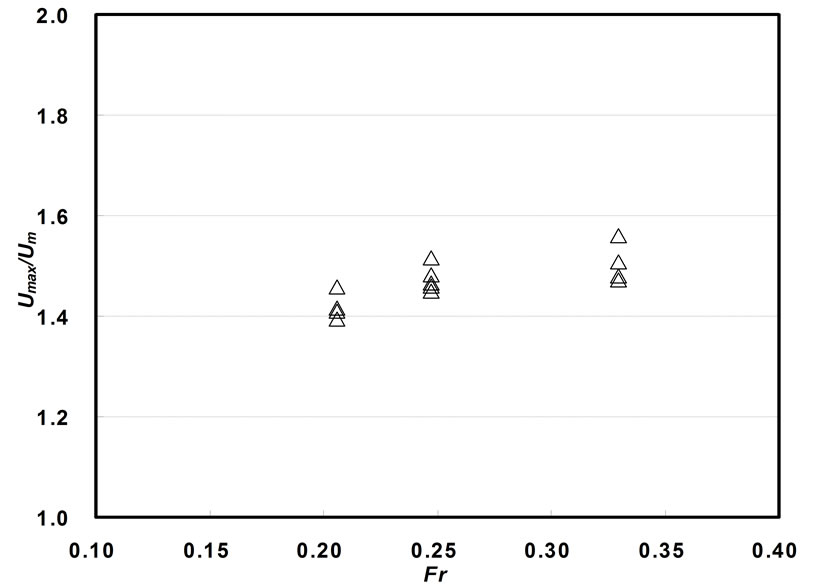
Figure 14. Relationship of Umax/Um and Fr.
embankment protection effect was deemed generated. This experiment attempted to classify maximum velocity at the recirculation zone into 1L - 12L times the groyne length and review according to each experiment condition at 0.02 channel width rate  and clearance length from the embankment. The maximum reverse velocity was generated mainly at the downstream area measuring 3 - 7 times the groyne length from the embankment to the groyne installation spot. It was also generated in the area spanning 3 - 5 times the velocity section. This could be interpreted to mean that a swirl location is moved to the upstream end because separation occurs at the groyne arm end and extends toward the upstream end. Figures 15 and 16 expressed the relationship between arm length rate (AL/l) and Fr by making the maximum velocity
  at the embankment dimensionless with average velocity
 , based on velocity data measured around the embankment. Here, the size and shape of the recirculation zone showed some difference according to the velocity conditions. The maximum velocity was generated at the pivot of a swirl within the recirculation zone according to the groyne arm length change, and the size was 1.21 - 0.43 times the average velocity. As Fr increased, the velocity rate around the embankment showed a difference depending on the conditions but tended to decrease gradually.
5. Conclusions
This study observed the flow characteristics under various velocity conditions through the adjustment of the arm length rate  targeting a groyne model whose rate of channel width vs. groyne length
  was 0.15 while targeting the ㄱ-type groyne as one of the mixed types of groynes. Flow field was measured using the LSPIV technique to identify the flow characteristics around the groynes and main flow area and change of thalweg line. In addition, flow area was analyzed according to the
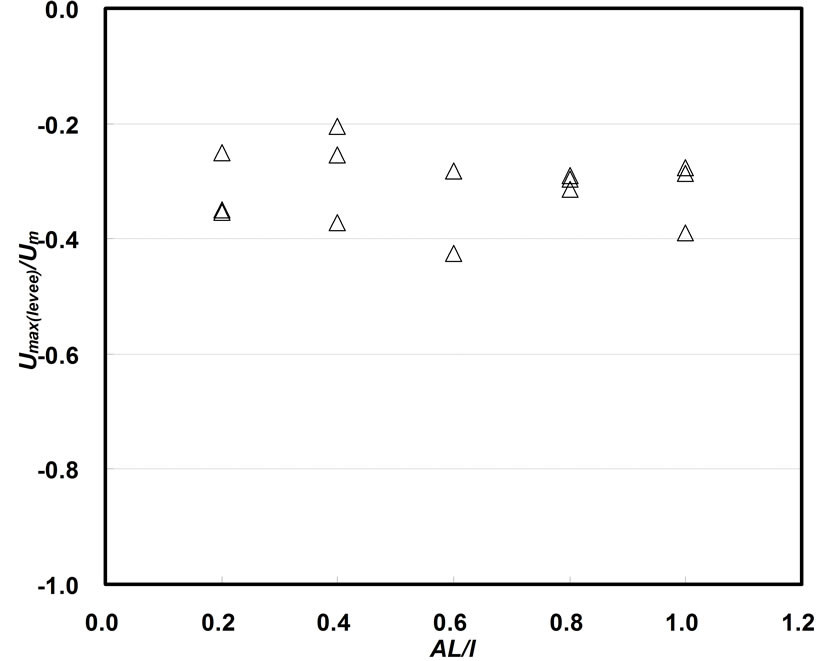
Figure 15. Relationship of Umax(levee)/Um and AL.
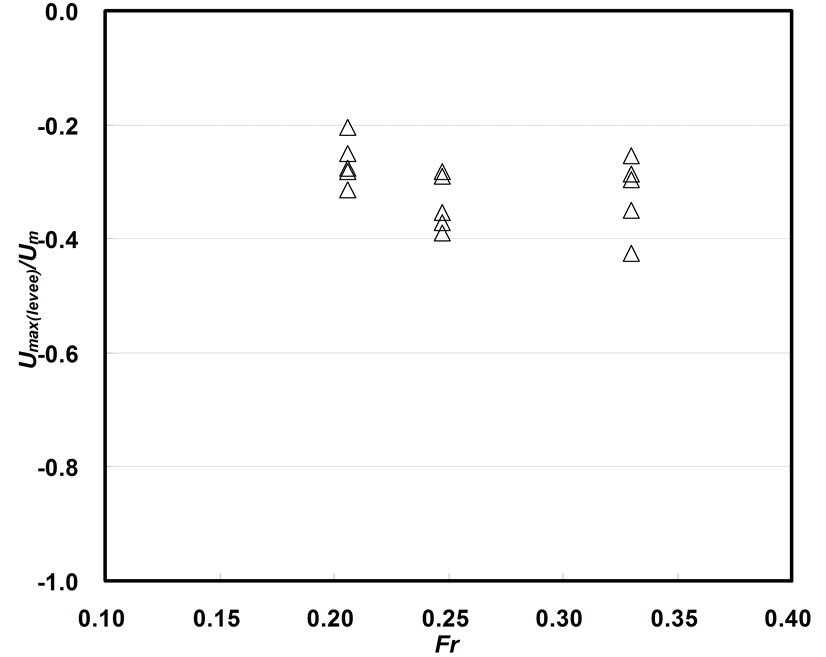
Figure 16. Relationship of Umax(levee)/Um and Fr.
flow conditions based on the measured results and groyne’s arm length and velocity conditions. To examine the characteristics of the thalweg line, this study comparatively analyzed the change of  as the distance from the groyne installation wall to the thalweg line. Concerning the change of flow area, this study comparatively analyzed the change of velocity distribution toward the flow width direction and separation area width according to the groyne installation from the main channel. Flow characteristics were examined through the velocity around the embankment at the location whose width was 0.02 times the channel width.
The distance to the thalweg line  refers to the extent of impact of groyne installation on the main flow area. The distance from the ㄱ-type groyne decreased compared to that of the I-type groyne.
  of the L-type groyne was extended to 55% - 57% of the channel width. Regarding the separation area width
 , it was difficult to find change in groyne arm length (from 20% to 30% of the channel width). Note, however, that the impacts on Fr and groyne arm length were minimal. This matched the change of distance to the thalweg line
 . Velocity in the main flow area according to groyne installation increased by 1.2 - 1.6 times the average velocity at the upstream area. The side line where maximum velocity was generated toward the flow direction in the main flow area was generated in the downstream area with 5 - 6 times the groyne length from the groyne. Around the embankment, maximum reverse flow was generated at the downstream area with 3 - 7 times the groyne length from the groyne installation spot. In addition, it was generated in the section measuring 3 - 5 times the groyne length, most likely because the swirl location was moved to the upstream end owing to flow separation at the groyne arm end as extended toward the upstream area. Maximum reverse velocity was generated at the pivot of a swirl within the recirculation area according to the change in groyne arm length. The reverse velocity was 0.21 - 0.43 times the average velocity. As Fr increased, the velocity rate around the embankment showed differences according to each condition but tended to show gradual decline.
In view of the results above, the ㄱ-type groyne showed no big difference from the existing L-typed groyne. Through the dead zone’s flow characteristics on the rear groyne area generated by the ㄱ-type groyne and scour experiment around the groynes, however, if impact elements are identified, the results can serve as basic data for the transformed design of groynes in the future.
6. REFERENCES
- J. R. Francis, A. Pattanick and S. Wearne, “Observations of Flow Patterns around Some Simplified Groyne Structures in Channels,” Technical Note No. 8, Proceedings of Institution of Civil Engineers, London, December 1968, pp. 829-846.
- N. Rajaratnam and B. Nwachukwu, “Flow Near GroyneDike Structures,” Journal of the Hydraulics Division, ASCE, Vol. 109, No. HY3, 1983, pp. 463-480. doi:10.1061/(ASCE)0733-9429(1983)109:3(463)
- T. Tingsanchali and S. Maheswaran, “2D Depth-Averaged Flow Computation Near Groyne,” Journal of Hydraulic Engineering, ASCE, Vol. 116, No. 1, 1990, pp. 71-86. doi:10.1061/(ASCE)0733-9429(1990)116:1(71)
- R. Ettema and M. Muste, “Scale Effects in Flume Experiments on Flow around a Spur Dike in Flatbed Channel,” Journal of Hydraulic Engineering, ASCE, Vol. 130, No. 7, 2004, pp. 635-646. doi:10.1061/(ASCE)0733-9429(2004)130:7(635)
- W. S. J. Uijttewaal, “Effects of Groyne Layout on the Flow in Groyne Fields: Laboratory Experiments,” Journal of Hydraulic Engineering, ASCE, Vol. 131, No. 9, 2005, pp. 782-791. doi:10.1061/(ASCE)0733-9429(2005)131:9(782)
- J. G. Kang, H. K. Yeo and S. J. Kim, “An Experimental Study on Tip Velocity and Downstream Recirculation Zone of Single Groyne Conditions,” KWRA, Vol. 38, No. 2, 2005, pp. 143-153
- H. K. Yeo, Y. S. Roh, J. G. Kang and S. J. Kim, “Variations of Flow Thalweg Alignment and Separation Region around a Groyne,” KWRA, Vol. 39, No. 4, 2006, pp. 313-320.
- M. P. Lloyd, et al., “Unsteady Surface-Velocity Field Measurement Using Particle Tracking Velocimery,” Journal of Hydraulic Research, Vol. 33, No. 4, 1995, pp. 519-534. doi:10.1080/00221689509498658
- I. Fujita, et al., “Large-Scale Particle Image Velocimetry for Flow Analysis in Hydraulic Applications,” Journal of Hydraulic Research, Vol. 36, No. 3, 1998, pp. 397-414. doi:10.1080/00221689809498626
- M. Muste, et al., “Large-Scale Particle Image Velocimetry: A Reliable Tool for Physical Modeling,” Proceedings of ASCE 2000 Joint Conference on Water Resources Engineering and Water Resources Planning & Management, Minneapolis, 30 July-2 August 2000.