Modern Mechanical Engineering
Vol.3 No.1(2013), Article ID:28255,5 pages DOI:10.4236/mme.2013.31005
Application Study on Multi-Vary Analysis*
Business School, Shanghai Dianji University, Shanghai, China
Email: lygxxm@126.com
Received August 11, 2012; revised October 27, 2012; accepted November 8, 2012
Keywords: Statistical Process Control; Multi-Vary Analysis; Process Capability Index
ABSTRACT
In this article, we studied the bearings made by one company in Shanghai. Through statistical process controlling the quality characteristic of bearings’ diameters and multi-vary analysis is applied to find the key variation factors which have an influence on the quality characteristic of the bearings, the quality level of the bearings of this company is improved.
1. Background and Signification
The manufacturing in China is developing fast through 30 years reform and opening up. China has firmly established itself as a manufacturing power in the world. At the same time, we should see that Chinese manufacturing is large but not strong. The improvement of product quality lags behind the growth of economic scale. The whole level of product quality has a gap with the developed countries. With the bearing for instance, China is a power of bearings, but the most is belonging to medium or lower end product. It is the lag of R&D capability, equipment and handcrafts that result in the precision of bearing unsure. If the precision of bearing can not meet the quailfication, the steel plate is unqualified. Therefore, it is essential subject to study through technology improvement which can advance bearing quality and increase enterprise benefit.
2. Literature Summary
SPC (statistical process control) is a tool of process control by means of mathematical statistics method. It analyses and controls the process by using the statistical law nature of figure fluctuation. Control chart becomes the one of most important tool of management after birth of the first control chart.
Zhen He, Ershi Qi, Shenghu Zhang [1] proposed that in practice, the control chart is always of on effect because the sampling plan can not capture the key random variation in spite of the statistical characteristics of  chart is theoretically thorough studied. Zhonghua Yu, Shaotong Wu [2] pointed out the control chart method proposed by W. A. Shewhart forecasts and controls production by using the output of process; it is essentially lack of regularity description of process change itself. D. C. Montgomery [3] presented that the traditional control chart of W. A. Shewhart is an available tool only in controlling single variation source. S. W. Well, J. D. Smith [4] proposed that the control chart of W. A. Shewhart often gives a false warning when there are variations in batches of product or shifts of production of the process of production. The main reason is that the control chart of W. A. Shewhart is based on a single variation. M. Hamada, R. J. Mackay, and J. B. Whitney [5] proposed that the key is to determine the source of variation in the application of traditional Shewhart control chart.
As to how to control the problem of multiple variation sources, product quality problems caused by the variation source can be known if we can make sure of sources of variation and proportions in all variation factors. Then we can take relevant measures according to the relative size of variation source and proportion.
3. Empirical Study
In this article, the CHTD5/7 model bearings made by one company in Shanghai were taken for research objects. The quality remand of the diameter is considered as the key factor because it has a directly effect on the final assembly of pumps.
3.1.  Control Chart and Process Capability Index
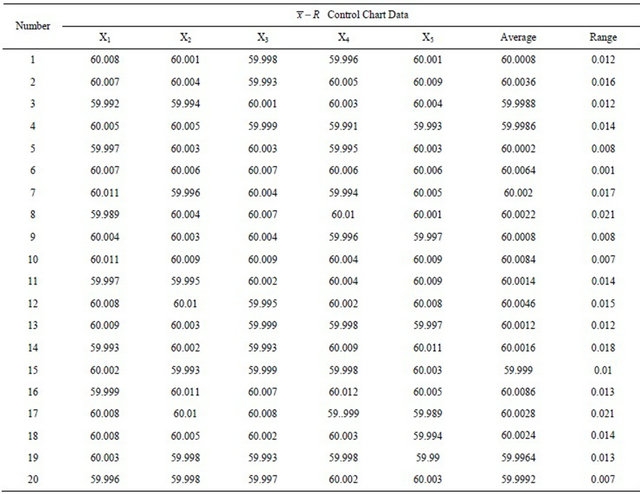
CHTD5/7-type self-bearing diameter quality requirements: Φ (60 ± 0.02) mm. When the products are processing, five samples per half hour are taken. And the data of its inner diameters are shown in the Table 1. So we can get 20 groups of data (Table 1).
Table 1. Bearing data.
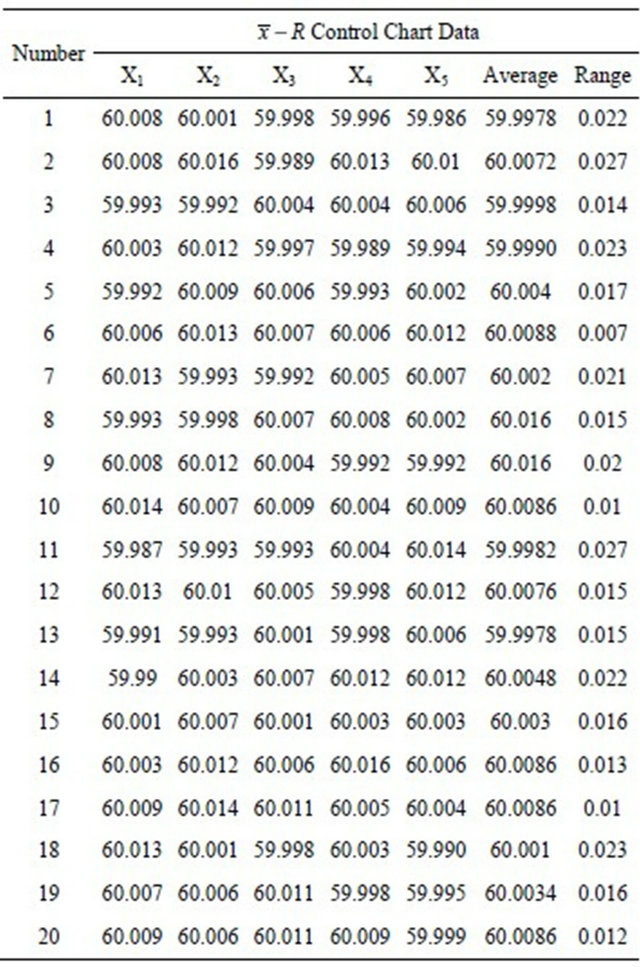
a. Unit: mm So we can get the  control Chart (see Figure 1).
From the Figure 1, we can see that all the sample points are in the control limits and the arrangements of the points are not abnormal. So we come to the conclusion that the procedure of bearings is controlled.
From Table 1, we obtain the average value of samples is 60.0033 mm and the Standard Deviation is 0.00717 mm2.
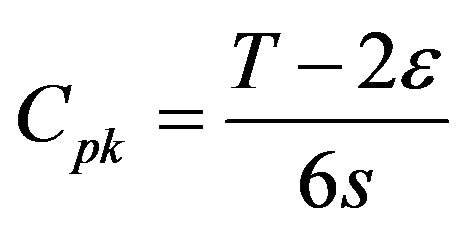 (1)
(1)
Following the above equation, we can obtain: Cpk ≈ 0.77. It shows that the process capability is deficient because 0.77 less than 1.
3.2. Application of Multi-Vary Method
In multi-vary analysis (MVA), the variation sources of process quality characteristics are divided into time to time variation, piece to piece variation and within piece variation. After on-site analysis, the main factor affecting the diameter of bearings is the taper and the non-concentricity. The different tapers of two ends of bearings
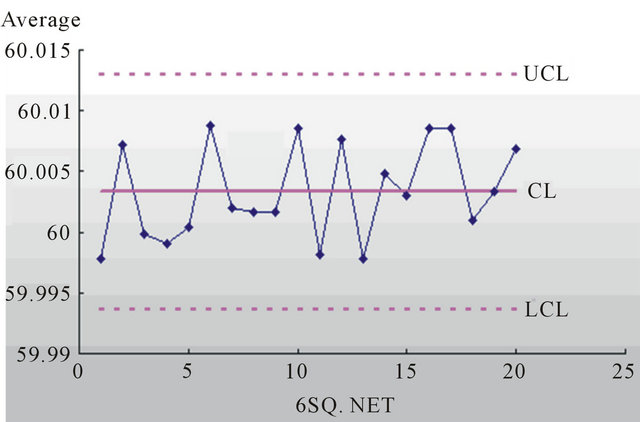
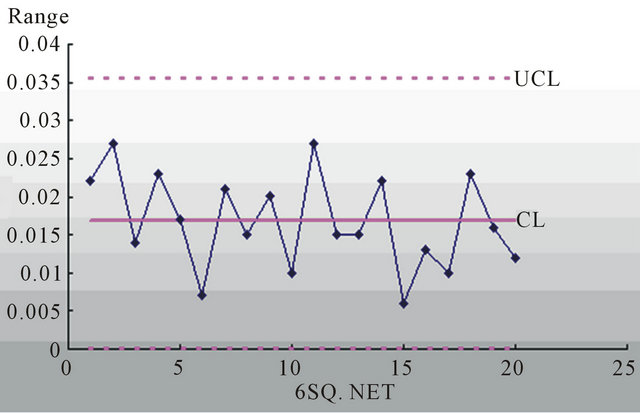
Figure 1. Average-range control.
can not make the bearings keep in parallel. It maybe has an influence on the contact area when bearings are used. And the different non-concentricity of bearings can make the circle centers of bearing two ends unsymmetrical and cause these bearings can not be assembly.
First, the systematic analysis chart of quality variation is drawn (see Figure 2).
3.2.1. Data Collection and Analysis
The sample data at 8:00, 9:00, 10:00, 11:00, 12:00 are collected to analyze the quality characteristics of diameters of bearings.
• This can not only ensure the continuity of time, but also collect sufficient data.
• Considering that the bearing itself has a certain errors and there are some errors existing in measure, we take three bearing samples in every time span.
• We twirl each bearing to read the data of the maximum and the minimum of the left and the right. Then we can get four data of every bearing.
There are data of monitoring as follows. (Tables 2-7)
The multi-vary data analysis at 8:00 is as follows:
1) Within piece variation:
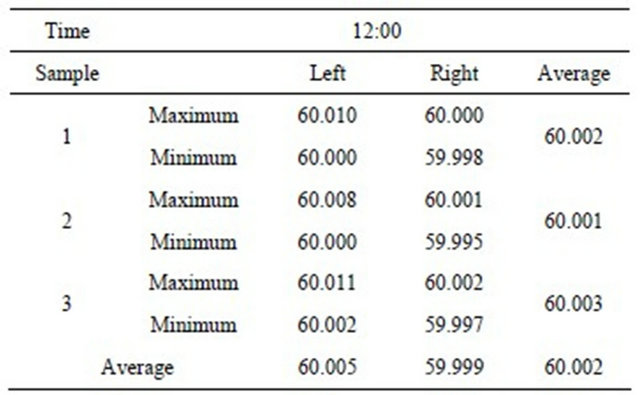
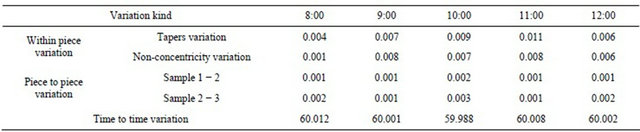
Different tapers variation = |the value of the left average diameter of samples – the value of the right average diameter of samples| = 60.014 − 60.010 = 0.004.
Different non-concentricity variation = the maximum of average diameter of samples – the minimum of average diameter of samples = 60.012 − 60.011 = 0.001.
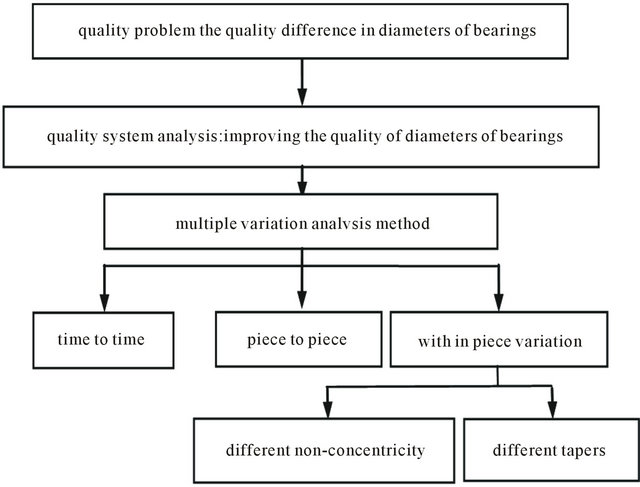
Figure 2. Systematic analysis chart of quality variation.
Table 2. 8:00 data of bearing and corresponding figures.
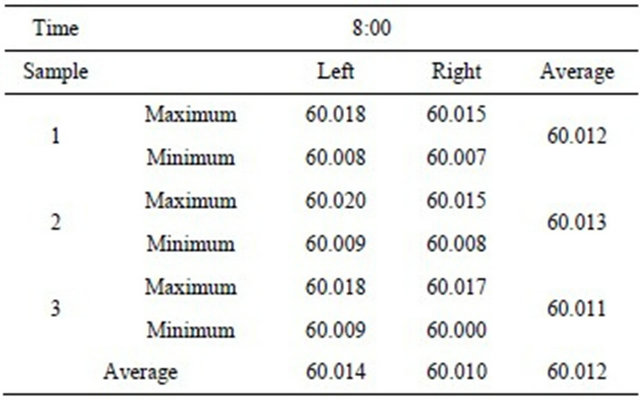
8:00 the average diameter value of three samples = 60.012.
Table 3. 9:00 data of bearing and corresponding figures.
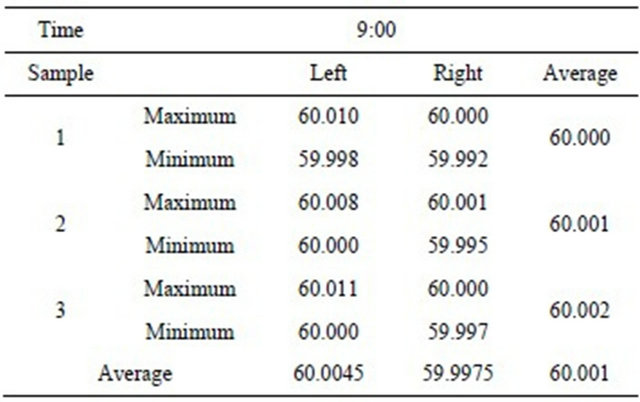
2) Piece to piece variation:
Sample 1 − 2 = |the average of sample 1 – the average of sample 2| = 60.013 − 60.012 = 0.001.
Sample 2 − 3 = |the average of sample 2 – the average of sample 3| = 60.013 − 60.011 = 0.002.
3) Time to time variation:
By parity of reasoning, five time span variation values are obtained. (Table 7)
By analogy, we can obtain five time variation values.
Table 4. 10:00 data of bearing and corresponding figures.
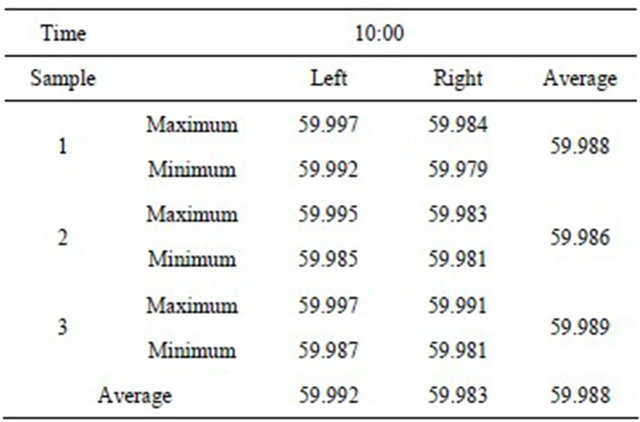
Table 5. 11:00 data of bearing and corresponding figures.
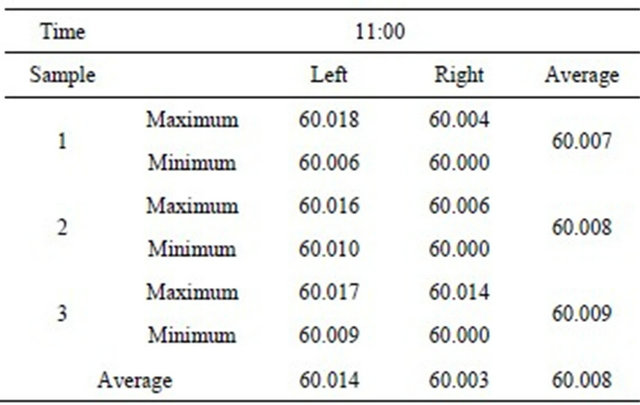
Table 6. 12:00 data of bearing and corresponding figures.
3.2.2. Process Improvement Suggestion
Through field analysis on the above sample data, we can offer a proposal on improving process quality of bearings. (Table 8)
3.2.3. Taking Data of Bearings Anew
We take the inner diameter data of bearings of one process through the above adjustment. (Table 9)
From Table 9, we obtain the average value of samples is 60.0019 mm and the Standard Deviation is 0.00542 mm2.
Table 7. Multi-vary data of bearing.
By analogy, we can obtain five time variation values.
Table 8. Quality variation reason and modification table.
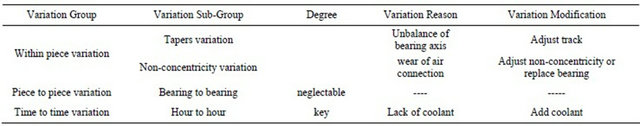
Table 9. Bearing data.
a. Unit: mm.
According to the Equation (1), we can obtain Cpk = 1.11. For 1 ≤ Cpk ≤ 1.33, the process capability is normal. The goal has now been finally attained through the multivary analysis of bearings.
4. Conclusion
In brief, the process capability is improved through the multi-vary analysis to the CHTD5/7 model bearings made by one company in Shanghai, so the quality of bearings is made better.
REFERENCES
- H. Zhen, E. S. Qi and S. H. Zhang, “Some Problems in the Application of
 Control Chart,” Journal of Industrial Engineering and Engineering Management in China, Vol. 12, No. 1, 2000, pp. 4-5.
 - Z. H. Yu and S. T. Wu, “Study on Quality Control Method in Small Batch Manufacturing Process,” Chinese Journal of Mechanical Engineering, Vol. 22, No. 2, 2001, pp. 3-4.
- D. C. Montgomery, “Design and Analysis of Experiments,” John Wiley and Sons, New York, 1996, pp. 25- 26.
- S. W. Well and J. D. Smith, “Making Control Chart Work for You,” Semiconductor International, Vol. 31, No. 4, 1991, pp. 24-25.
- M. Hamada, R. J. Mackay and J. B. Whitney, “Continuous Process Improvement with Observational Studies,” Journal of Quality Technology, Vol. 25, No. 2, 1993, pp. 77-84.
NOTES
*Key Disciplines Assistance in Shanghai Dianji University (10XKJ01).