Materials Sciences and Applications
Vol.06 No.06(2015), Article ID:56939,10 pages
10.4236/msa.2015.66053
Fatigue Limit Prediction and Estimation for the Crack Size Rendered Harmless by Peening for Welded Joint Containing a Surface Crack
Ryutaro Fueki1, Koji Takahashi2*, Keiji Houjou3
1Graduate School of Engineering, Yokohama National University, Yokohama, Japan
2Faculty of Engineering, Yokohama National University, Yokohama, Japan
3Department of Mechanical Engineering, National Institute of Technology, Oyama College, Oyama, Japan
Email: *ktaka@ynu.ac.jp
Copyright © 2015 by authors and Scientific Research Publishing Inc.
This work is licensed under the Creative Commons Attribution International License (CC BY).
http://creativecommons.org/licenses/by/4.0/


Received 1 May 2015; accepted 2 June 2015; published 5 June 2015
ABSTRACT
In this study, the effects of portable pneumatic needle-peening (PPP) on the bending fatigue limit of a low-carbon steel SM490A welded joint containing a semi-circular slit on the weld toe were investigated. PPP was applied to the specimens with a semi-circular slit with depths of a = 0.4, 0.8, 1.2, and 1.6 mm. Then, three-point bending fatigue tests were carried out under R = 0.05. The fatigue limits of low-carbon steel welded specimens containing a semi-circular slit were increased for peened specimens compared with non-peened specimens. Peened specimens having a semi- circular slit with a depth of a = 1.2 mm had high fatigue limits, almost equal to those of the non-slit peened specimens. It was concluded that a semi-circular slit with a depth of less than a = 1.2 mm can be rendered harmless by peening. Then, the fatigue improvement by peening was predicted. The fatigue limits before and after peening could be estimated accurately by using a modified Goodman diagram considering the effects of residual stress, stress concentration, and Vickers hardness. Moreover, the maximum depth of a semi-circular slit that can be rendered harmless by PPP was estimated based on fracture mechanics assuming that the semi-circular slit was equivalent to a semi-circular crack. The prediction results were almost consistent with the experimental results.
Keywords:
Welded Joint, Peening, Fatigue Limit, Compressive Residual Stress, Fracture Mechanics

1. Introduction
Welded joints are often used in large steel structures such as bridges, ships, and pressure vessels. However, the welded joints reduce the fatigue limit of structures as a result of stress concentration caused by a discontinuous portion of the weld bead and tensile residual stress in the weld toe resulting from the effect of the heat accompanying the weld process. Fatigue cracks often initiate at the welded joint, ultimately leading to structural fracture. Therefore, non-destructive inspections are typically conducted in a regular manner, and detected cracks are treated appropriately. However, non-destructive inspection has a detection limit, i.e., small cracks below the limit cannot be detected. These undetected cracks are left until the next regular inspection, so these cracks not only result in a high cost for treatment in the future but also decrease the reliability of the welded structures. If these fatigue cracks could be rendered harmless, the structural integrity could be significantly improved and maintenance cost reduced.
In previous studies, research on rendering a surface crack harmless by shot peening was conducted. Shot peening is a surface treatment process used to produce a beneficial compressive residual stress layer and modify the fatigue strength of metals by impacting a surface with high-velocity spherical media [1] [2] . However, specimens without welded joints were used in these studies. It was reported that the fatigue limit of welded joints could be increased using ultrasonic impact treatment [3] -[5] . Ultrasonic impact treatment is a novel treatment method for introducing beneficial compressive residual stress in the surface layer by directly deforming the surface with a needle with a rounded head vibrated by an ultrasonic wave. However, few studies were conducted on rendering a surface crack harmless by peening for specimens with welded joints. Recently, studies on rendering a surface crack harmless by portable pneumatic needle-peening (PPP) were conducted for specimens with welded joints of low-carbon steel SM490A [6] and austenitic stainless steel SUS316 [7] . It was reported that semi-circular slits of depths 1.2 mm and 1.0 mm were rendered harmless by PPP for SM490A and SUS316, respectively. PPP is a novel treatment used to introduce beneficial residual compressive stress in the surface layer by striking the surface with a needle vibrated by compressed air. PPP employs lightweight and hand-portable equipment, which makes it easy to apply this technique outdoors [8] . From an engineering viewpoint, it is very important to estimate the fatigue limits before and after peening and the maximum depth of the semi-circular slit that can be rendered harmless in a weld-toe zone. In the present study, the fatigue limits before and after peening were estimated by using the modified Goodman diagram considering the effects of residual stress, stress concentration, and Vickers hardness. Moreover, the semi-circular slit size rendered harmless by peening was evaluated based on fracture mechanics.
2. Test Materials and Test Method
2.1. Material and Specimens
The material used is low-carbon steel SM490A. The mechanical properties are shown in Table 1. The material was supplied as 20-mm-thick plates, which were butt-welded, as shown in Figure 1(a). Test specimens, as shown in Figure 1(b), were prepared by cutting them out from the welded plate. A semi-circular slit similar to a surface crack was introduced within 0.5 mm of the weld toe. The dimensions of the slit were divided into four groups, as shown in Figure 1(c): diameter [mm]/depth [mm] = 0.8/0.4, 1.6/0.8, 2.4/1.2, and 3.2/1.6.
2.2. Method of Peening
Two kinds of peening were combined for the fatigue test, namely, portable pneumatic needle-peening (PPP) and ultrasonic needle-peening (UNP). PPP was performed at the weld toe, and UNP was conducted on the heat- affected zones of the specimens. The range of UNP treatment was 20 mm from the weld toe, as shown in Figure 2. In this study, the improvement of the fatigue strength of the welded specimens is mainly caused by PPP. The purpose of performing UNP is to prevent fracture from the heat-affected zone during the fatigue test. The details of the peening conditions are given in Table 2.
2.3. Measurement of Residual Stress
The residual stress was measured by the X-ray diffraction method. The X-ray conditions are a Cr-Kα beam X-ray spectrum and a 1.0-mm X-ray beam injection diameter. The residual stress distributions in the thickness

Table 1. Mechanical property of SM490A.
Table 2. Peening conditions.

Figure 1. Shape and dimension of test specimen.

Figure 2. Peening treating position.
direction were obtained by alternately measuring the residual stress on the surface and then chemically etching to remove the surface layer.
2.4. Fatigue Test
The specimens were divided into four groups: 1) as welded, 2) having a semi-circular slit at the weld toe, 3) peening treated at the weld toe and 4) peening treated at the weld toe having a slit.
As shown in Figure 3, cyclic three-point bending fatigue tests were performed with constant load amplitudes and with a stress ratio of R = 0.05. All the tests were carried out using a fatigue testing machine with a frequency of f = 20 Hz. The fatigue limit was defined as the maximum stress amplitude at which the specimen could endure 5 × 10⁶ cycles of stress.

Figure 3. Three-point bending fatigue test.
3. Results
3.1. Fatigue Test Results
The results of the fatigue tests are shown in Figure 4, which shows the relationship between the stress amplitude (σa) and the depth of the semi-circular slit (a) [6] . In Figure 4, the square symbols and the triangle symbols indicate non-peened and peened specimens, respectively. The solid symbols represent the specimens that did not fracture at up to 5 × 10⁶ cycles. The dotted lines represent the fatigue limit (σw). The asterisk symbols (*) indicate that the specimen fractured outside the semi-circular slit. It can be seen from Figure 4 that the fatigue limits of all the specimens were increased 43% - 118% by peening.
3.2. Definition of Rendering a Semi-Circular Slit Harmless
If the fatigue test results of a peened specimen with a semi-circular slit meet either of the following two conditions, the slit is considered to have been rendered harmless.
Condition (a): The fatigue limit increased up to more than 95% of that of the peened specimen without a semi-circular slit.
Condition (b): The specimen fractured outside the slit.
From Figure 4, the fatigue limits of peened specimens with slit sizes of a = 0.4 mm, 0.8 mm, and 1.2 mm are equivalent to those of peened specimens without a semi-circular slit. Therefore, a semi-circular slit under a = 1.2 mm could be rendered harmless by peening because of meeting condition (a).
3.3. Distribution of Residual Stress
The longitudinal residual stress distributions for the welded specimen with peening and without peening are shown in Figure 5. Generally, tensile residual stress is induced at the weld toe. However, in the case of non-peened specimens, approximately 70 MPa of compressive residual stress was introduced on the surface of the weld toe. This result was caused by controlling the welding process. On the other hand, large compressive stress was introduced in the peened specimen. The surface and the maximum compressive residual stress were about 490 MPa and 550 MPa, respectively.
3.4. Vickers Hardness of the Weld Toe
Measurement of Vickers hardness of the surface layer of the weld toe was performed. In the case of non-peened welded specimens, the value of the Vickers hardness was 280 HV. This was 37% larger than that before welding (204 HV). The reason for this is a refinement of the grains caused by welding. After peening, the value of the Vickers hardness was increased to 304 HV. This was 9% larger than that before peening. This was caused by work hardening resulting from peening.
4. Stress Concentration of the Weld Toe before and after Peening
Finite element method (FEM) analysis was conducted in order to calculate the stress concentration factor Kt of the weld toe before and after peening. The formula for Kt is:
 (1)
(1)
where σmax is the stress of the weld toe; σnom is the nominal stress, i.e., the stress of non-welded specimen at the same position as the weld toe.

Figure 4. Relationship between stress amplitude and depth of the semi-circular slit.

Figure 5. Residual stress distribution.

Figure 6. 1/2 model for FEM analysis (before peening).
The FEM analysis model is shown in Figure 6. The model is a half model of the specimen that assumes symmetry to account for the other half of the specimen. It consists of a 20-node hexahedron element. An elasticity analysis was conducted by using a universal analysis code (ANSYS 14.5). The FEM analysis results are shown in Figure 7 as a contour of normal stress, σx, around the weld zone. Figure 8 shows the distribution of longitudinal stress at the weld toe, which was obtained from Figure 7. As shown in Figure 8, the surface stress after peening is lower than that of the non-peened specimen. The stress concentration factor Kt can be calculated by means of comparing to the nominal stress (Δ): Kt before peening is 2.3, and Kt after peening is 2.0.

Figure 7. Contour of normal stress σx.

Figure 8. Distribution of normal stress σx at the weld toe (FEM results).
5. Fatigue Limit Estimation
Fatigue limit estimation before and after peening was conducted by using the modified Goodman diagram, which is based on the method proposed by Nose [9] . Figure 9 and Figure 10 show the modified Goodman diagrams of the welded specimen before and after peening, respectively. In Figure 9, the mean stress is along the x-axis while the stress amplitude is along the y-axis. Line (a) represents the modified Goodman relationship for a specimen without a welded zone, which is drawn by connecting the fatigue limit σw0 for a stress ratio of R = −1 and the ultimate tensile strength σB. Line (b) shows the modified Goodman relationship considering the stress concentration at the weld toe. Specifically, σw0 when the stress ratio is R = −1 is divided by the value of Kt before peening (Kt = 2.3). Line (c) shows the relationship between the mean stress and stress amplitude when the stress ratio R is equal to 0.05. Considering the surface residual stress after welding, line (d) is obtained by compensating line (c). The residual stress at the surface of the weld toe is considered in line (c). Line (e) shows the yield strength σY after welding.
It is well known that mechanical properties such as σw0, σB, and σY are proportional to hardness [10] . Therefore, it is postulated that the values of σw0, σB and σY are increased by welding and peening with the same increasing rate of Vickers hardness. Table 3 gives the details on these values.
Table 3. Basic mechanical properties used in Figure 9 and Figure 10.
 Note: σw0, σB and σY were increased by the same increasing rate of hardness.
Figure 9. Fatigue limit diagram of non-peened specimen.
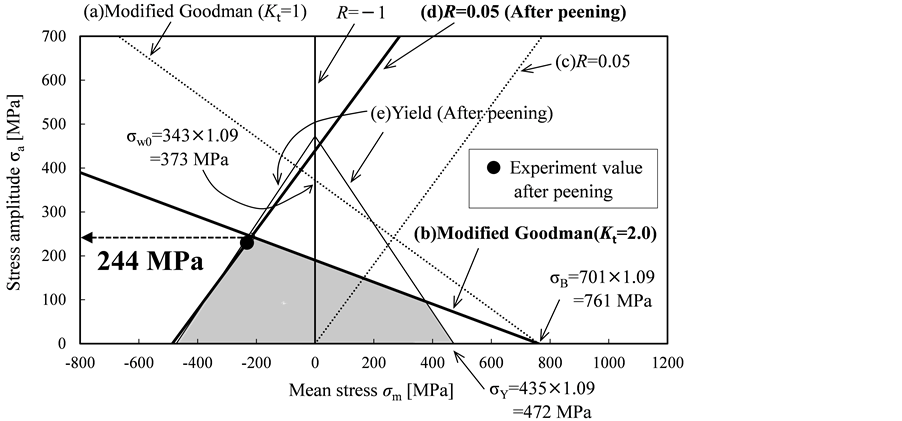
Figure 10. Fatigue limit diagram of peened specimen.
The value of the estimated fatigue limit can be obtained from the intersection between line (b) and line (d). Therefore, the value of the estimated fatigue limit before peening was 135 MPa, which is 16% safer compared to the experimental value shown in Figure 9. The paint-out area in Figure 9 shows the safe region in terms of fatigue.
In Figure 10, lines (a), (b), (d) and (e) are modified in the same way as in Figure 9. In line (b), σw0 is divided by the value of Kt after peening (Kt = 2.0). From Figure 10, the value of the estimated fatigue limit after peening was 244 MPa, which is 9% less safe than the experimental value shown in Figure 9. It is observed that the safe region after peening in Figure 10 was extended in comparison with that before peening.
These fatigue limit estimation results are close to the experimental results if the measurement errors are taken into consideration. Thus, the fatigue limits before and after peening can be estimated accurately.
6. Evaluation of the Semi-Circular Slit Size Rendered Harmless by Peening Based on Fracture Mechanics
The semi-circular slit size that can be rendered harmless by peening was evaluated based on fracture mechanics assuming that the semi-circular slit was equivalent to a semi-circular crack. In this study, the semi-circular slit size which can be rendered harmless by peening was evaluated by means of focusing on the stress intensity factor K. Figure 11 shows the evaluation of K using the pattern diagram under R = 0.05. The vertical axis is K, and the horizontal axis is elapsed time. Figure 11(a) shows the stress intensity factor range ΔK subjected to the applied stress. Figure 11(b) shows ΔK with compressive residual stress by peening. In this study, we assumed that the positive value of the stress intensity factor ΔKT contributes to fatigue crack propagation. If the sum of the minimum stress intensity factor Kmin and the stress intensity factor by residual stress (Kr ) becomes compressive, ΔKT can be calculated by the following equation.
 (2)
(2)
The values of Kmax and Kr were evaluated by FEM analysis using a quarter of a specimen model that has a semi-circular crack, as shown in Figure 12. The model has no welding bead because the stress concentration at the weld toe can be taken into consideration by using the stress distribution, as shown in Figure 8. The value of Kmax was calculated by applying the operating stress distribution after peening in Figure 8, plotted as circles, to the crack surface of Figure 12. The value of Kr was calculated by applying the residual stress distribution after peening in Figure 5, plotted as solid squares to the crack surface of Figure 12.
Figure 13 shows the relationship between the applied stress intensity factor rangeΔKT and the semi-circular slit depth a. ΔKT,A and ΔKT,C represent ΔKT at the deepest point and at the surface of a semi-circular slit respectively. ΔKT was calculated with Equation (2) because the sum of Kmin and Kr calculated by FEM analysis became compressive. The threshold stress intensity factor range (ΔKth) depends on the crack size. In order to determine the relationship between ΔKth and the lengths of cracks, the equation proposed by El Haddad et al. [11] and arranged by Tange et al. [12] was used. It is as follows:
 (3)
(3)
ΔK(L)th is the threshold stress intensity factor range for a large crack. We used ΔK(L)th = 8.4 MPa∙m1/2, which was obtained by the uniaxial loading test for a specimen containing a large through-crack [13] . Δσw0 is the stress range at the fatigue limit for non-peened specimens. We used Δσw0 = 420 MPa, which was obtained from the modified Goodman diagram in Figure 9. Moreover, α is the depth of a semi-circular slit, and α is the shape parameter obtained by Newman-Raju’s equation [14] .
Assuming that the semi-circular slit is equivalent to the semi-circular crack, we can judge whether the semi-circular slit can be rendered harmless. If ΔKT is smaller than ΔKth , the semi-circular slit can be rendered harmless. Thus, the intersection between ΔKT and ΔKth gives the maximum semi-circular slit size amax that can be rendered harmless.
From Figure13, the value of amax was 1.37 mm. As mentioned in Section 3.1, a semi-circular slit with a = 1.0 mm was rendered harmless by peening. Thus, this estimation result was consistent with the experimental results as shown in Figure 4.
 (a)
(a) (b)
(b)
Figure 11. Effective stress intensity factor range ΔKt. (a) Stress intensity factor range by applied stress, ΔK; (b) Effective stress intensity factor range, ΔKT, Kmim + Kr < 0.

Figure 12. 1/4 model for FEM analysis.

Figure 13. Estimation of acceptance semi-circular slit size.
7. Conclusions
In this study, the influences of portable pneumatic needle-peening on fatigue limits and the semi-circular slit size that can be rendered harmless by peening for a butt-welded joint of low-carbon steel SM490A were investigated. Three-point bending fatigue tests were carried out under R = 0.05 using a welded specimen containing a semi-circular slit. Then, the fatigue limit before and after peening was predicted by the modified Goodman diagram. Moreover, the fatigue improvement by peening and the maximum depth of the semi-circular slit that can be rendered harmless were estimated. The results are as follows.
1) The fatigue limits of low-carbon steel SM490A welded specimens containing a semi-circular slit were improved by peening. The fatigue limits were increased 43% - 118% for peened specimens compared with non- peened specimens.
2) Peened specimens having a semi-circular slit with a depth of less than a = 1.2 mm had high fatigue limits, almost equal to those of the non-slit peened specimens. We conclude that a semi-circular slit under a = 1.2 mm in depth can be rendered harmless by peening.
3) After peening, compressive residual stress was introduced on the weld toe. The surface and the maximum compressive residual stresses were about 490 MPa and 550 MPa respectively.
4) The value of the Vickers hardness after peening was 9% larger than that before peening.
5) The stress concentration factor Kt of the weld toe was calculated using finite element method analysis. It was decreased from 2.3 to 2.0 by peening.
6) It became clear that the fatigue limits before and after peening at the weld toe could be estimated accurately by using the modified Goodman diagram considering the effects of residual stress, stress concentration, and Vickers hardness.
7) The semi-circular slit size rendered harmless by peening was evaluated based on fracture mechanics assuming that the semi-circular slit was equivalent to a semi-circular crack. The value of amax was 1.37 mm. The predicted result was almost consistent with the experimental results.
Acknowledgements
The authors wish to acknowledge Prof. K. Ando, emeritus professor of Yokohama National University, for his valuable comments. The authors also express our appreciation to TOYO SEIKO Co., Ltd. for peening treatment and measurement of residual stress.
References
- Takahashi, K., Amano, T., Hanaori, K., Ando, K. and Takahashi, F. (2009) Improvement of Fatigue Limit by Shot Peening for High-strength Steel Specimens Containing a Crack-like Surface Defect. Journal of the Society of Materials Science, Japan, 58, 1030-1036. http://dx.doi.org/10.2472/jsms.58.1030
- Houjou, K., Takahashi, K. and Ando, K. (2013) Improvement of Fatigue Limit by Shot Peening for High-Tensile Strength Steel Containing a Crack in the Stress Concentration Zone. International Journal of Structural Integrity, 4, 258-266. http://dx.doi.org/10.1108/17579861311321726
- Nose, T. and Shimanuki, H. (2008) Experiment and Analysis of Influence of Ultrasonic Peening on Fatigue Life in Pad Welded Joint. Transactions of the JSME Series A, 74, 166-168. http://dx.doi.org/10.1299/kikaia.74.166
- Togasaki, Y., Tsuji, H., Honda, T., Sasaki, T. and Yamaguchi, A. (2010) Effect of UIT on Fatigue Life in Web-Gusset Welded Joints. Journal of Solid Mechanics and Materials Engineering, 4, 391-400. http://dx.doi.org/10.1299/jmmp.4.391
- Marquis, G. (2010) Failure Modes and Fatigue Strength of Improved HSS Welds. Engineering Fracture Mechanics, 77, 2051-2062. http://dx.doi.org/10.1016/j.engfracmech.2010.03.034
- Houjou, K., Takahashi, K., Ando, K. and Abe, H., (2014) Effect of Peening on the Fatigue Limit of Welded Structural Steel with Surface Crack, and Rendering the Crack Harmless. International Journal of Structural Integrity, 5, 279-289. http://dx.doi.org/10.1108/IJSI-12-2013-0048
- Takahashi, K., Houjou, K., Abe, H., Ando, K. and Okazaki, S. (2013) Improvement of Structural Integrity of Pressure Vessels by Peening. Journal of Japan Boiler Association, 381, 15-22.
- Ministry of Land, Infrastructure, Transport and Tourism (2012) New Technology Information System No. CB-120011-A. http://www.netis.mlit.go.jp
- Nose, T. (2012) Ultrasonic Peening Method for Fatigue Strength Improvement. Journal of the JWS, 77, 194-199.
- Nishijima, S., Ishii, A., Kanazawa, K., Matsuoka, S. and Masuda, C. (1989) Collection of NRIM Fatigue Data Sheet. National Research Institute for Metals, No. 5, 39, 40, 54.
- El Haddad, M.H., Topper, T.H. and Smith, K.N. (1979) Relation between Shot-Peening Residual Stress Distribution and Fatigue Crack Propagation Life in Spring Steel. Engineering Fracture Mechanics, 11, 573-584. http://dx.doi.org/10.1016/0013-7944(79)90081-X
- Tange, A. Akutu, T. and Takamura, A. (1991) Improvement of Fatigue Limit by Shot Peening for High-Strength Steel Specimens Containing a Crack-Like Surface Defect. Transactions of JSSE, No. 36, 47-53.
- National Research Institute for Metals (1980) NRIM Fatigue Data Sheet. National Research Institute for Metals, Tokyo, No. 21, 11.
- Newman Jr., J.C. and Raju, I.S. (1981) An Empirical Stress-Intensity Factor Equation for the Surface Crack. Engineering Fracture Mechanics, 15, 185-192. http://dx.doi.org/10.1016/0013-7944(81)90116-8
NOTES

*Corresponding author.