Materials Sciences and Applications
Vol. 3 No. 10 (2012) , Article ID: 23492 , 7 pages DOI:10.4236/msa.2012.310102
Facile Synthesis and Characterization of Nanoporous NiO with Folic Acid as Photodegredation Catalyst for Congo Red
![]()
Department of Chemistry, University of Alzahra, Tehran, Iran.
Email: *faezeh_farzaneh@yahoo.com
Received July 13th, 2012; revised August 15th, 2012; accepted September 12th, 2012
Keywords: Nanoporous NiO; Photodegredation; Congo Red; Folic Acid
ABSTRACT
In this study nanoporous NiO was prepared using Ni(CH3COO)2·4H2O, folic acid and water as starting material, template and solvent respectively, by sol gel method followed by calcination at 400˚C. The solid product was characterized by X-ray diffraction (XRD), nitrogen adsorption-desorption, scanning electron microscopy (SEM), transmission electron microscopy (TEM) Fourier transform infrared (FT-IR) and photoluminescence (PL) techniques. The particle size of the nanoparticles estimated by XRD was in good agreement with the particle size obtained by TEM analysis (4 - 5 nm). It was also found that the prepared nanoporous NiO show very good activity for photodegredation of dye organic pollutants such as Congo red (91%) during 1.5 hours.
1. Introduction
NiO as an important transition metal oxide has received extensive attention because of its specific structure and potential applications in various fields, such as catalyst [1-3], battery cathodes [4], gas sensor materials [5], solar cells [6], electrochemical supercapacitors [7], electrochromic films [8], and fuel cell electrodes [9,10]. So far, many different methods have been attempted to synthesize nanosized NiO particles, such as thermal decomposition [11,12], micro emulsion [13], precipitation [14,15], electrochemical deposition [16], flame spray pyrolysis reactor [17] sol-gel technique [18,19] and surfactant mediated method [20]. In fact nano-sized materials have attracted much attention because of their unusual properties based on size quantization effect and large surface area [21-25].
The heterogeneous photocatalysis by semiconductor particles is newly emerging process for removal of global environmental pollutants [26,27]. Various kinds of synthetic dyestuffs appear in the effluents of waste water in some industries such as dyestuff, textiles, leather, paper, plastics, etc. [28]. The colored effluents of waste from these industries can be mixed in surface water and ground water systems, and then they may bring a chief threat to human health due to either toxic or mutagenic and carcinogenic for most of dyes [29]. Therefore, it is necessary to remove the dye pollutions. Congo red is an example of anionic diazo dyes and Congo red containing effluents are generated from textiles, printing and dyeing, paper, rubber plastics industries, etc. Due to its structural stability, it is difficult to biodegrade. Physico-chemical or chemical treatment of such wastewaters is, however, possible [30-35].
The purpose of this study is to report the synthesis of nanoporous NiO by sol gel process in the presence of folic acid and then was evaluated for the ability to remove Congo red dye from aqueous solutions. The combined effect of adsorption-photodegredation was also investigated.
2. Experimental
2.1. Instrumentation
X-ray diffraction patterns were obtained on a PW1800 diffractometer with CuKα radiation (Kα = 0.15405 nm) and Ni-filtered. The nanostructures of the samples were analyzed by scanning electron microscopy (SEM; S-4160 Hitachi) and transmission electron microscopy ( Philips EM 208s) at an accelerating voltage of 100 kV. The photoluminescence (PL) spectrum was recorded at room temperature using a Xe lamp with an excitation wavelength of 280 nm by a Cary Eclips-fluorescence spectrophotometer. The degradation process was analyzed by monitoring dye absorption intensity at the maximum absorption wavelength using a UV/vis (Perkin Elmer, Lambda 35). Fourier transform infrared (FT-IR) spectra were recorded on TENSOR27 spectrophotometer in KBr pellets. Thermal studies were performed using Mettler-Toledo TGA/SDTA-851, thermogravimetric analyzer in air at a heating rate of 10˚C/min. Atomic absorption spectrometric measurements were done using a GVC atomic absorption spectrometer.
2.2. Preparation of NiO Nanoparticles
All chemical materials were purchased from Merck Chemical Company and used without further purification. In a typical synthesis, 1 mmol of Folic acid and 2 mmol of NaOH pellets were dissolved in 5 mL of water to give a homogenous solution. Then this solution was added drop wise into 5 mL of aqueous solution containing 1 mmol Ni(CH3COO)2, 4H2O under magnetic stirring for 2 h. The resultant solution was refluxed for 12 h. The solid product was filtered, washed with distilled water to remove the impurities, and then dried in a vacuum oven at 60˚C for 12 h. Finally, the obtained precursor was calcined at 400˚C for 3 h. Deionized water was used for making all solutions. The calcined solid product at 400˚C contains: Ni: 60.55%.
2.3. Photo Catalytic Activity Determination
Photocatalytic activity of the prepared NiO as photocatalyst was evaluated by the degradation of Congo red (Scheme 1). 0.05 g of the as-prepared nano NiO was poured into 100 mL aqueous solution of 3 ppm Congo red, in a glass reaction cell. A 30 W UV-C lamp was used as light source. The distance between the UV lamp and the glass reaction cell was fixed at 8 cm. Air was bubbled into the solution throughout the entire experiment to provide a constant source of dissolved oxygen. The dye solution was continuously stirred with a magnetic stirrer. Prior to irradiation, the set up was kept in the dark for approximately 15 minutes in order to reach an adsorption/desorption equilibrium among the photo catalyst particles, Congo red and atmospheric oxygen. During irradiation, the degradated dye was sampled in regular intervals. The photocatalytic degradation was monitored by measuring the absorbance of the soltion samples with UV-vis spectrophotometer.
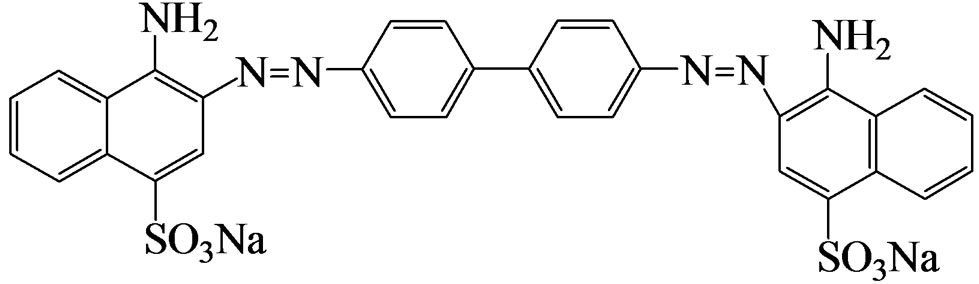
Scheme 1. Structure of Congo red.
3. Results and Discussion
3.1. Characterization of Prepared Nanoporous NiO
XRD analysis of the as synthesized nickel folate compound with folic acid and Ni(acac)2 designated as Ni precursor, followed by heating at 100˚C, 200˚C, 300˚C, 400˚C for 3 h. are shown in Figures 1(a)-(e), respectively. Based on the obtained results at room temperature up to 200˚C amorphous phases were formed, while metal oxide crystallization occurred after heat treatment at 200˚C. By increasing temperature up to 300˚C and finally 400˚C the NiO as a crystalline phase is observed. The diffracttion angle and intensity of the characteristic peaks of the samples at 300˚C and 400˚C (Figures 1(d) and (e)) are well consistent with those of the standard JCPDS card no (04-0835). The main diffraction peaks were observed at 2θ, 37.13˚, 43.53˚, 63.11˚, 75.80˚ and 79.22˚. All diffracttion peaks can be indexed to the pure NiO crystalline phase (space group: Fm3m), no impure peaks are observed in the XRD pattern. The average particle size was about 4.8 - 5 nm determined from XRD pattern parameters of the NiO powder according to the sherrer Equation (1) [15].
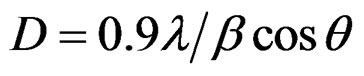 (1)
(1)
where b (FWHM; full-width at half-maximum or halfwidth) is in radians and q is the position of the maximum of diffraction peak (200) and l is the X-ray wavelength (1.5406 Å for CuKα).
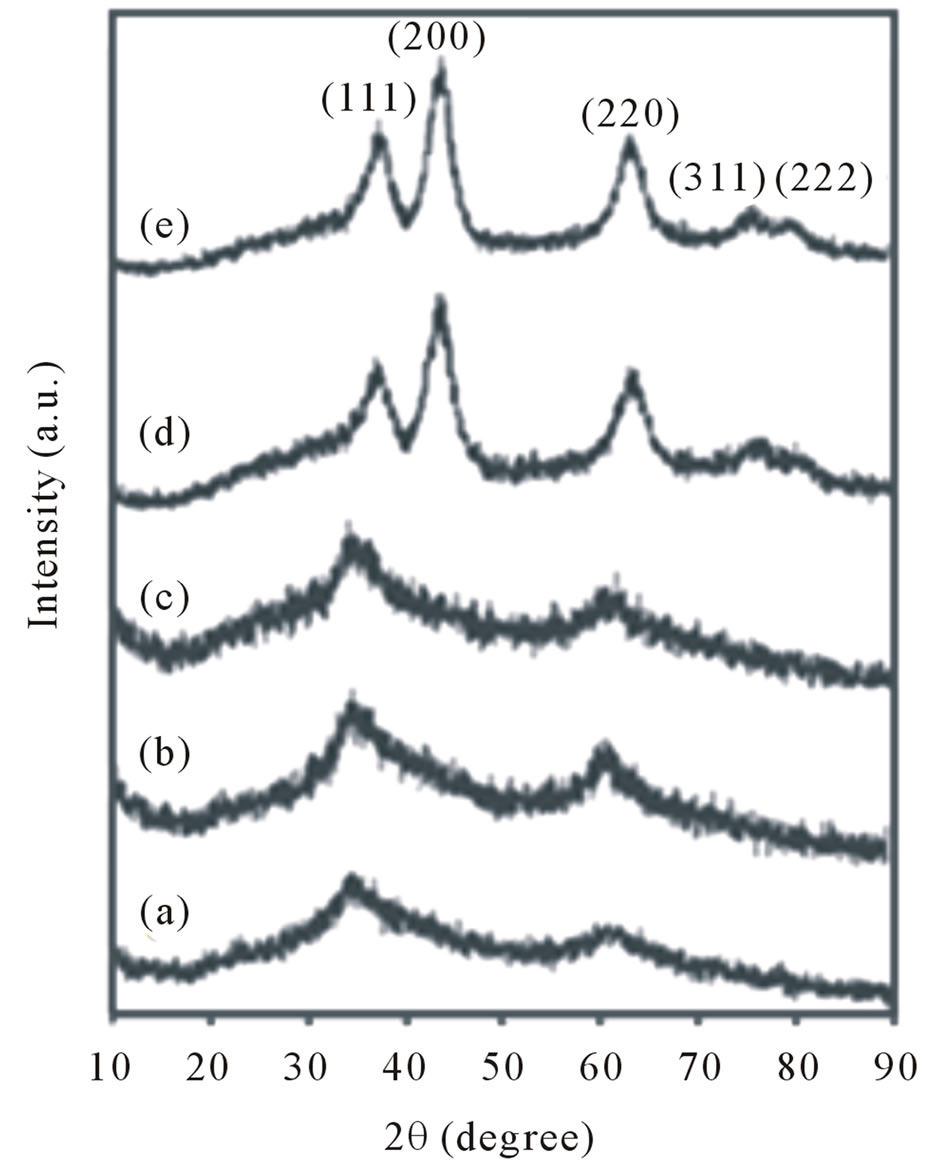
Figure 1. XRD patterns of (a) As prepared Ni precursor; (b) After heat treatment at 100˚C; (c) 200˚C; (d); 300˚C; (e) and 400˚C.
The FT-IR spectra of folic acid, as prepared sample after heated at 100˚C, 200˚C and calcined at 400˚C are shown in Figures 2(a)-(d) respectively. The broad peak at ca. 3450 - 3400 cm–1 in all four spectra are representative of OH stretching vibrations of template and adsorbed water. The vibration bands at 2946 and 2869 cm–1 are due to the CH2 groups of folic acid. The FTIR of folic acid (Figure 2(a)) shows vibration at the regions 1694, 1449, 1333 - 1352 and 600 cm–1 due to the ν(C=O), νas(COO-), νs(COO-) and C-OH of folic acid and C-O bending vibration respecttively [36]. By increasing temperature to 100, 200˚C (Figures 2(b) and (c)), the vibration modes of folic acid has been decreased, but at 400˚C the peaks due to the CO folate disappeared because of the decomposition of folic acid but appearing a relatively broad peak around 1200 cm–1 should be due to the some C-N or C-OH vibrations of adsorbed specious on NiO surfaces during the calcination time, but by increasing temperature up to 900˚C this peak is disappeared. Two new peaks were also found at 490 and 445 cm–1 (Figure 2(d)), these peaks undoubtedly assigned to Ni-O stretching as was reported earlier by other researches [36,37].
3.2. SEM and TEM Studies
The SEM images of as prepared nickel-folic acid hybrid with molar Ratio 1/1 after refluxing for 6 h, 12 h, followed by calcinations at 400˚C designated as NiO400 and EDX of NiO400 are given in Figures 3(a)-(d) respectively. As seen in Figure 3(a), the SEM image of as prepared sample does not show any obvious morphology but by increasing reflux time from 6 h to 12 h the particle
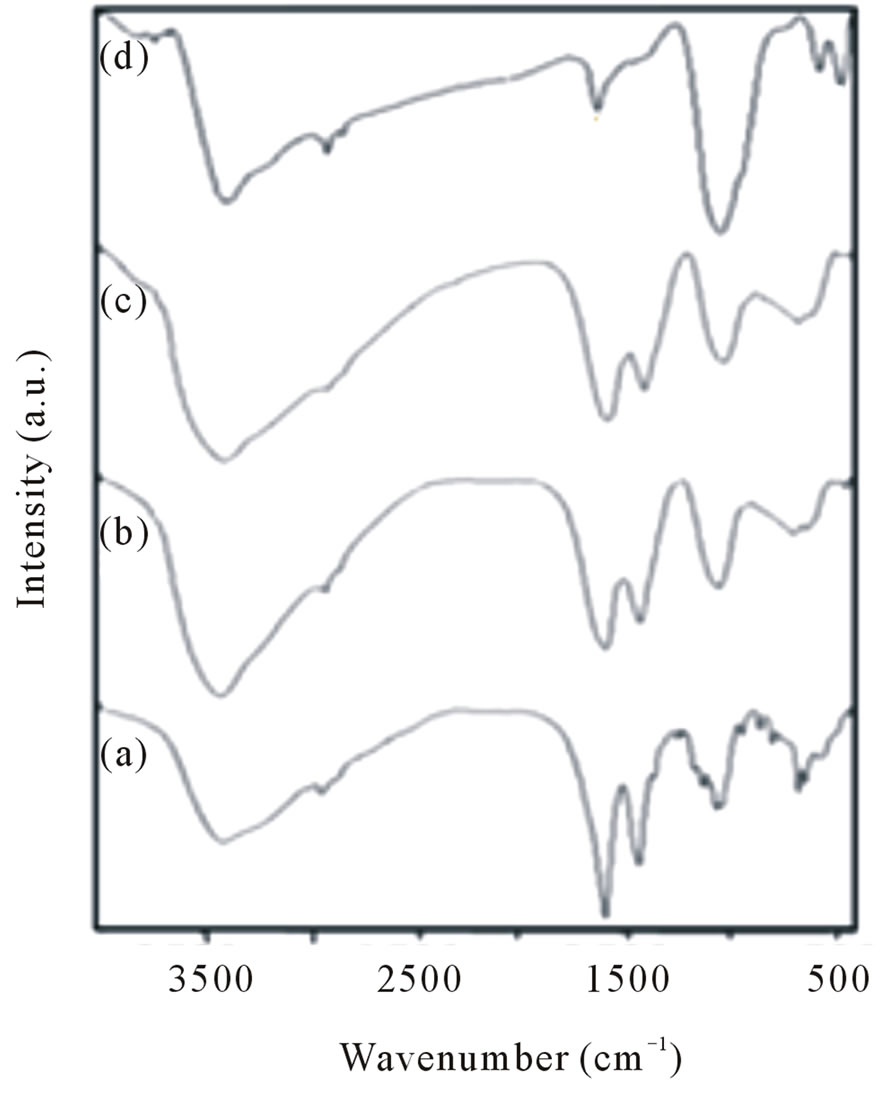
Figure 2. FT-IR spectra of (a) Folic acid; (b) Heated at 100˚C; (c) at 200˚C; and (d) at 400˚C.
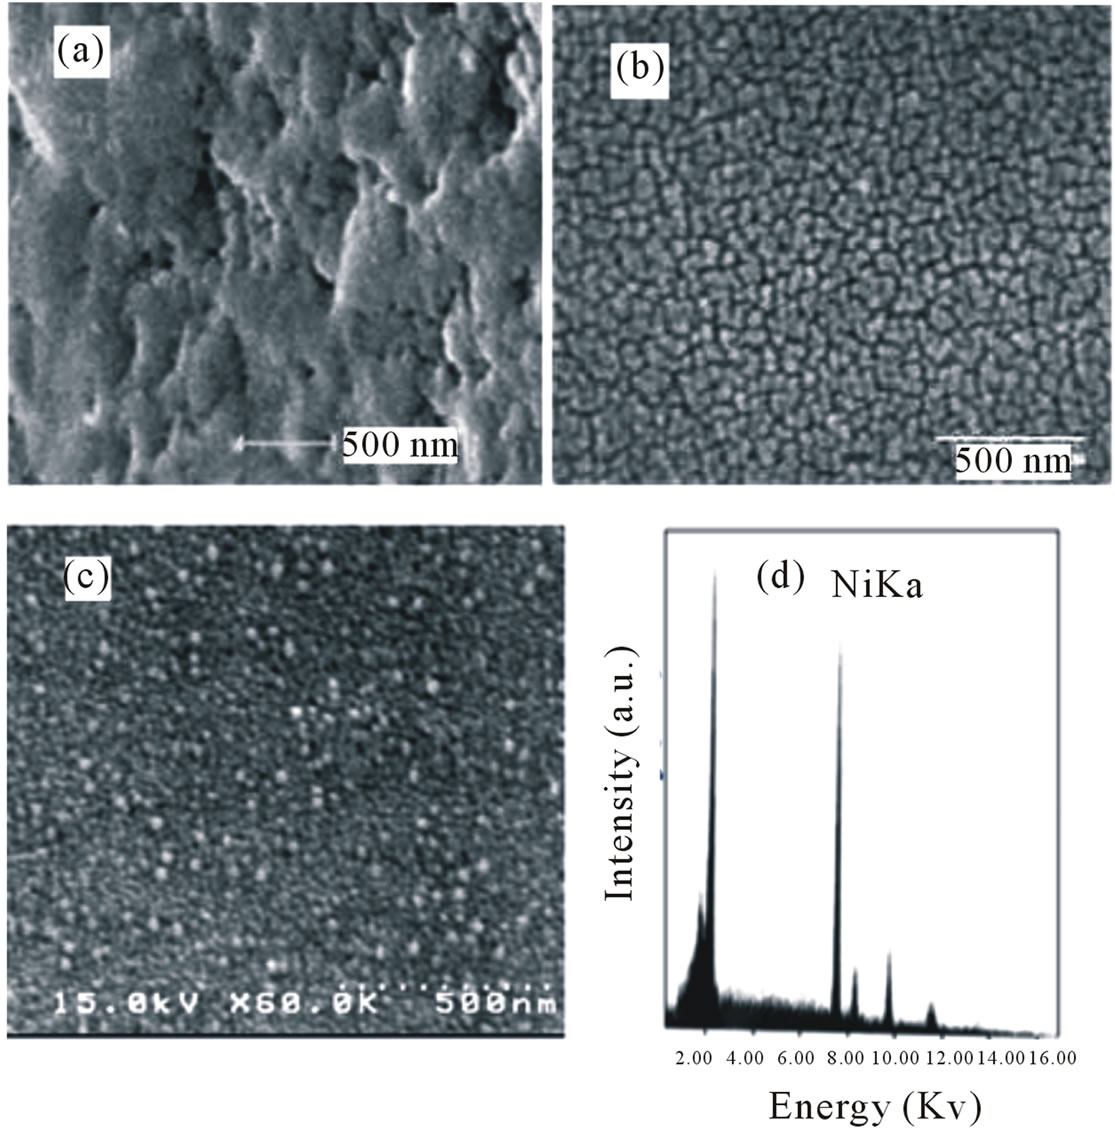
Figure 3. Scanning electron microscopy of (a) As prepared nickel-folic acid hybrid with molar ratio 1/1after refluxing for 6 h; (b) Reflux for 12 h; (c) Reflux for 12 followed by calcinations at 400˚C designated as NiO400; (d) EDX of NiO400.
size appeared as 48 nm (Figure 3(b)). The best results was obtained after calcination at 400˚C with particle size 21 - 22 nm. It was also observed increasing the amount of the folic acid from 1/1 to 5/1 the size of the nanoparticles increases and increasing the reflux time, the particle size decreases. The photographs show that the calcination temperatures are important factor on particle size and distribution of the nanoparticles. The higher calcination temperature, results the smaller the particles and the more good distribution.
Therefore the NiO400 has been used for further studies. The EDX of NiO400 is also shown in Figure 3(d). The interesting point is no peaks due to the impurity is appeared.
The transmission electron microscopy (TEM) photographs of NiO400 has been given in Figure 4(a). The size of the nanoparticles obtained from the XRD diffraction patterns are in close agreement with the TEM studies which show sizes of about 4 - 5 nm. The selected area diffraction (SAED) pattern of the NiO400 is shown in Figure 4(b), which shows the good crystalinity of the nanoparticles.
3.3. TGA/DTA
In order to reveal the changes that occurred during heat treatment of the precursor powders, TGA, and DTA analysis of as prepared sample was carried out from 30˚C to 750˚C in atmosphere (Figures 5(a)-(b)). According to
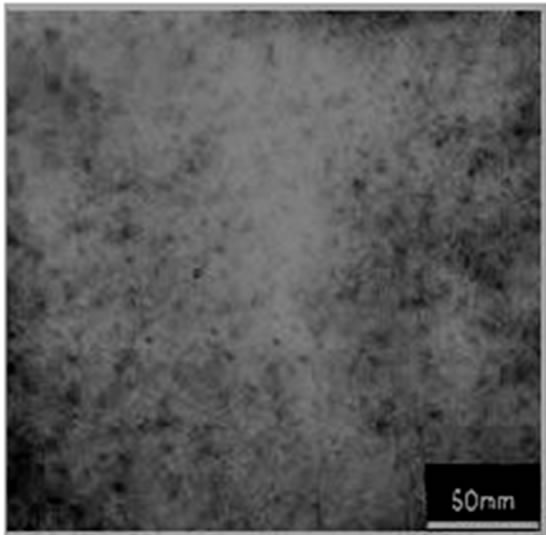
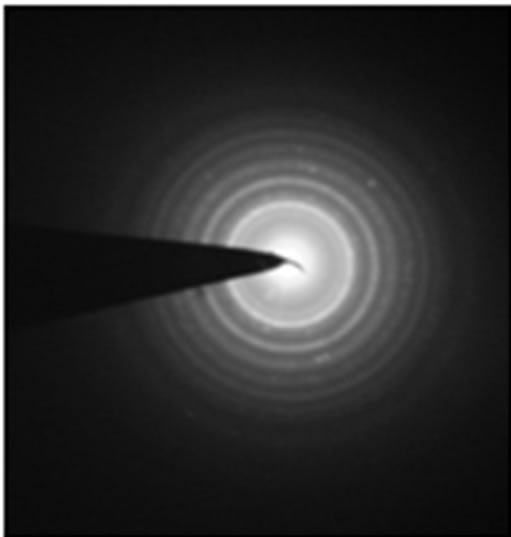
Figure 4. Transmission electron microscopy (TEM) of (a) NiO400, (b) SAED of NiO400.
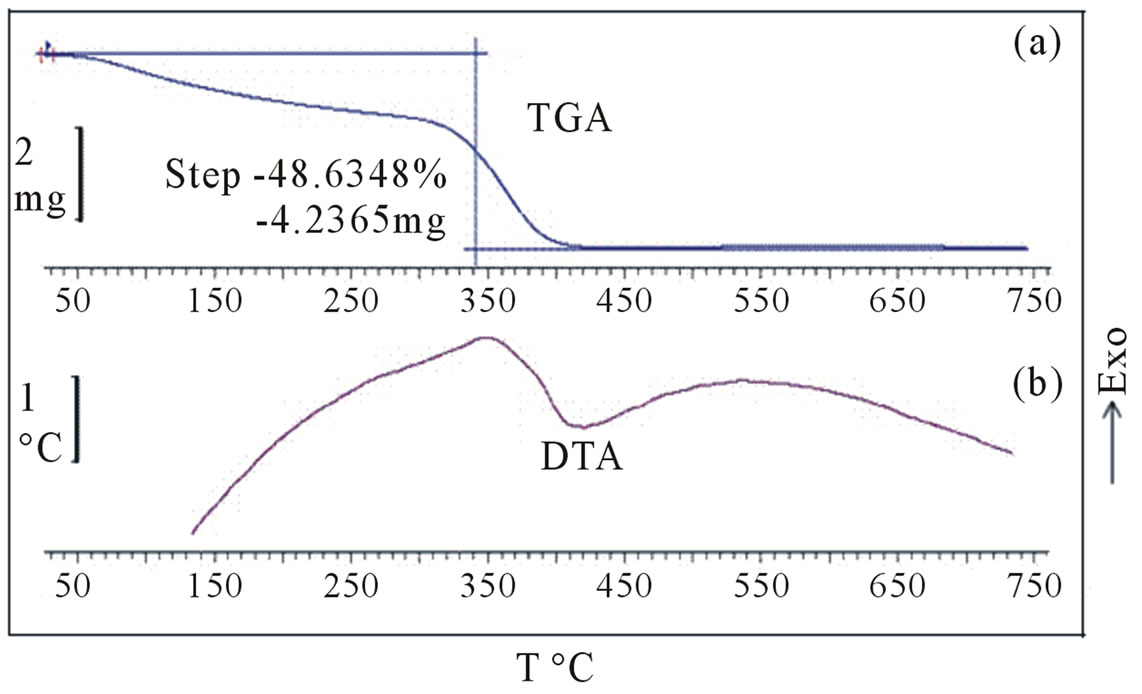
Figure 5. (a) TGA; and (b) DTA of as obtained Ni precursor.
the TGA curve Figure 5(a), the major part of the weight loss seems to occur below 400˚C. The TGA curve shows a weight loss of 8% in the temperature range of 60˚C - 140˚C due to the evaporation of the absorbed water. An exothermic peak at approximately 342˚C occurs in DTA (Figure 5(b)), which might be associated with the conversion of precursor to NiO and also the decomposition of the organic residues. The total process has the weight loss of about 48.63%.
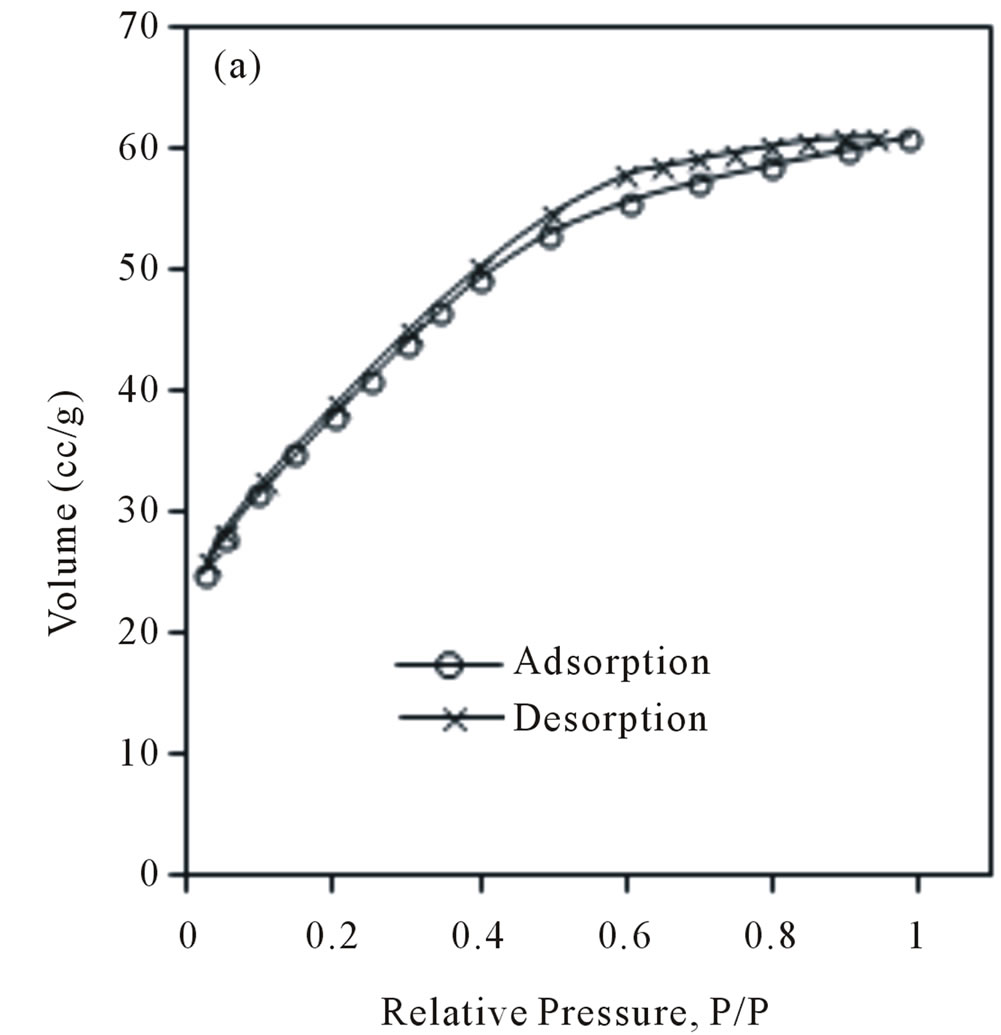
3.4. Nitrogen Sorption Studies
The nitrogen adsorption-desorption isotherms and pore size distribution of NiO calcined at 400˚C are shown in Figures 6(a)-(b) respectively. Curved inflations at P/P˚, 0.4 - 1 is related to the pressure of capillary condensation based on BHJ calculation. The obtained results indicate that the NiO400 with surface area 138.1 m2/g, pore volume 0.09 cm3/g, and pore diameter 2.83 nm is formed.
3.5. UV-Vis Studies
The UV-vis spectra of NiO bulk, NiO400 and NiO100 are shown in Figures 7(a)-(c) respectively. Observing a maximum absorption at the region 300 nm for the NiO400 is interesting point. The photoluminescence spectra of NiO400 shows a maximum UV emission at 381 nm by
 (a)
(a)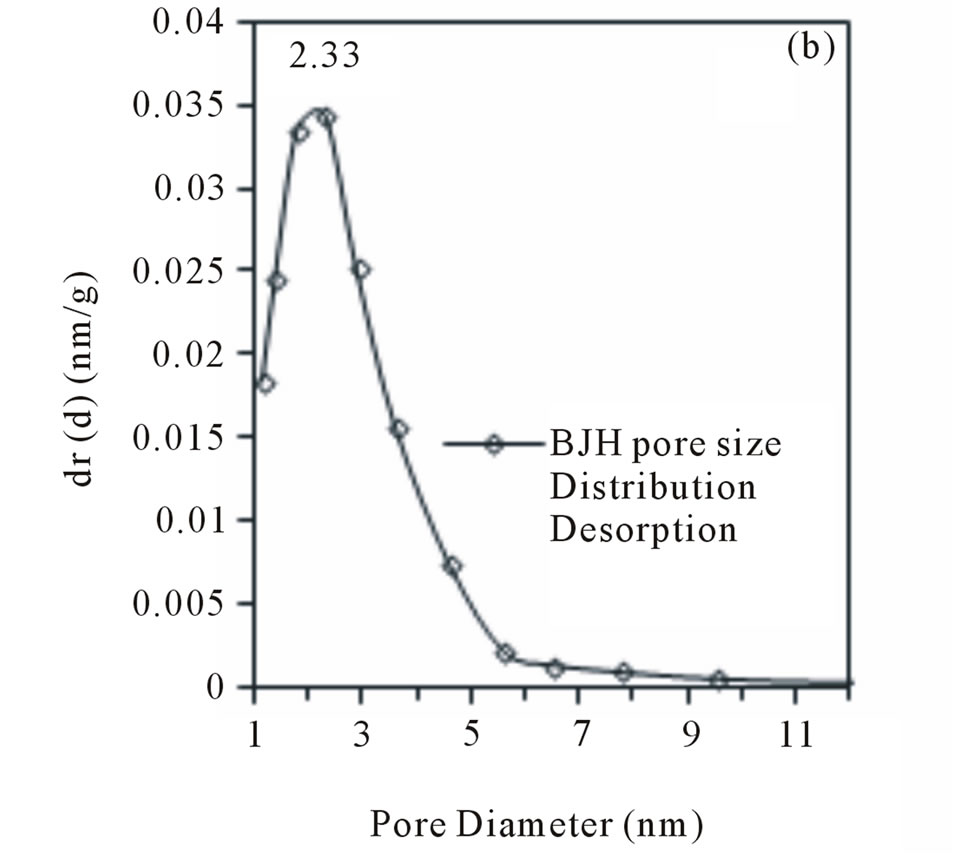 (b)
(b)
Figure 6. Nitrogen adsorption-desorption isotherm of (a) NiO400, (b) pore volume distribution of NiO400.
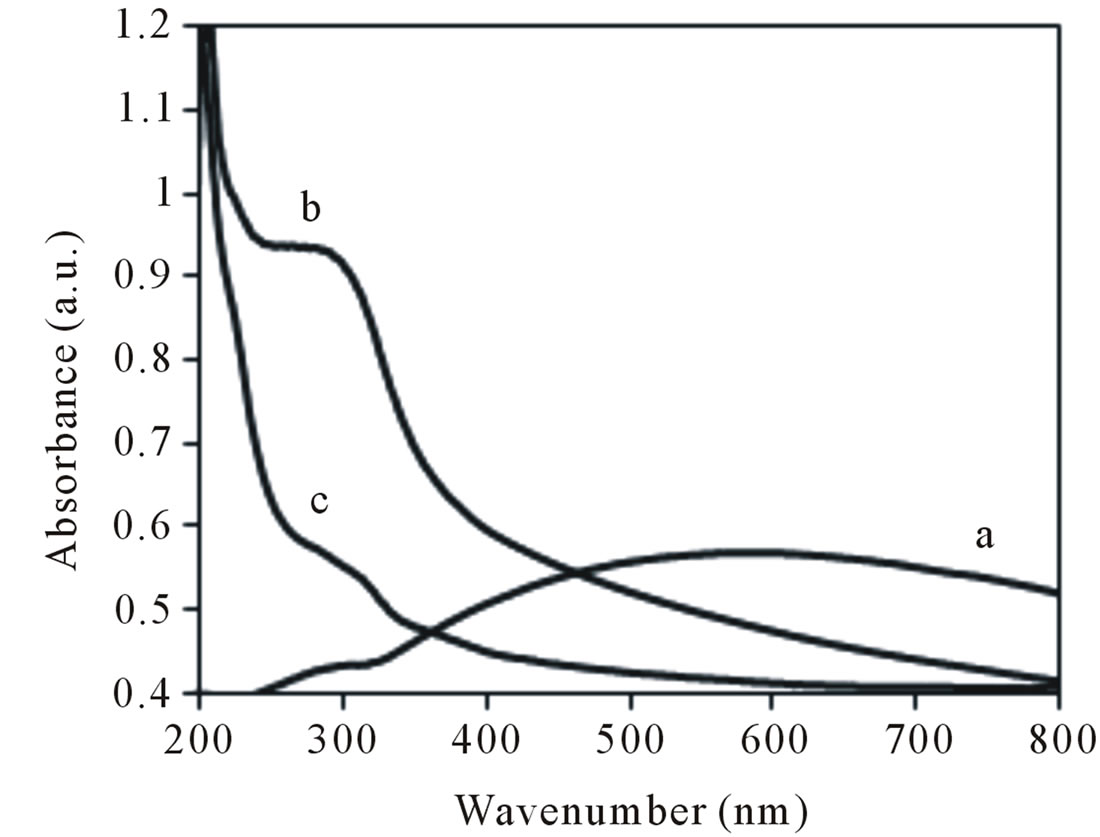
Figure 7. UV-vis absorption spectrum of (a) NiO bulk; (b) NiO calcined at 400˚C; (c) Nano NiO100.
excitation beam at 280 nm, the obtained results are consistent with those reported before [38,39].
3.6. Photocatalytic Activity
The photocatalytic activity of nanoporous NiO was prepared by nickel acetate, sodium hydroxide and folic acid as template followed by heating at 100˚C and calcination at 400˚C designated as NiO400 were evaluated by the degredation of Congo red (CR) solutions (Figure 8). The UV-vis spectrum of CR shows two maximum absorption at the regions 347 and 497 nm. By illuminating UV light to the aqueous CR solution the two bands due to the azo linkage and naphthalene ring are decreased in the time 135 min. UV light illumination of the aqueous Congo red solution in presence of prepared nano structured NiO cause the absorption bands of the dye in the visible region to decrease with time and finally to disappear, indicating the destruction of its chromophoric structure in the vicinity of the azo-linkage. This is accompanied by a parallel decrease of the intensities of the bands in the ultraviolet region located at 347 nm, attributed to the naphthalene ring. It was observed by increasing time up to 135 min with NiO400 the degradation were completed.
The photodegredation percentage versus photodegredation time in the presence of the mentioned catalyst and the illuminating CR without catalyst are shown in Figure 9. Based on the obtained results without using the catalyst 20% of Congo red was photodegreded after 1 h, but using the catalyst increases the degredation up to 90% at the same time. The photocatalytic efficiency was expressed in terms of percent of degradation from the following equation:
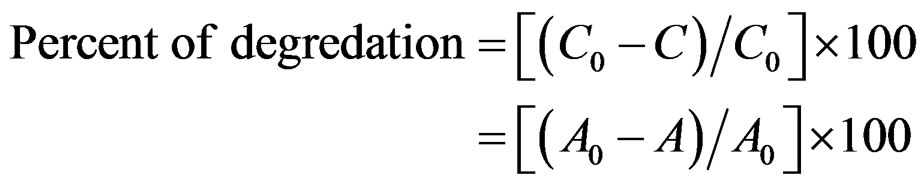 (2)
(2)
where, C0 represents the initial concentration of the CR, C is the concentration after illuminating by UV-vis light,
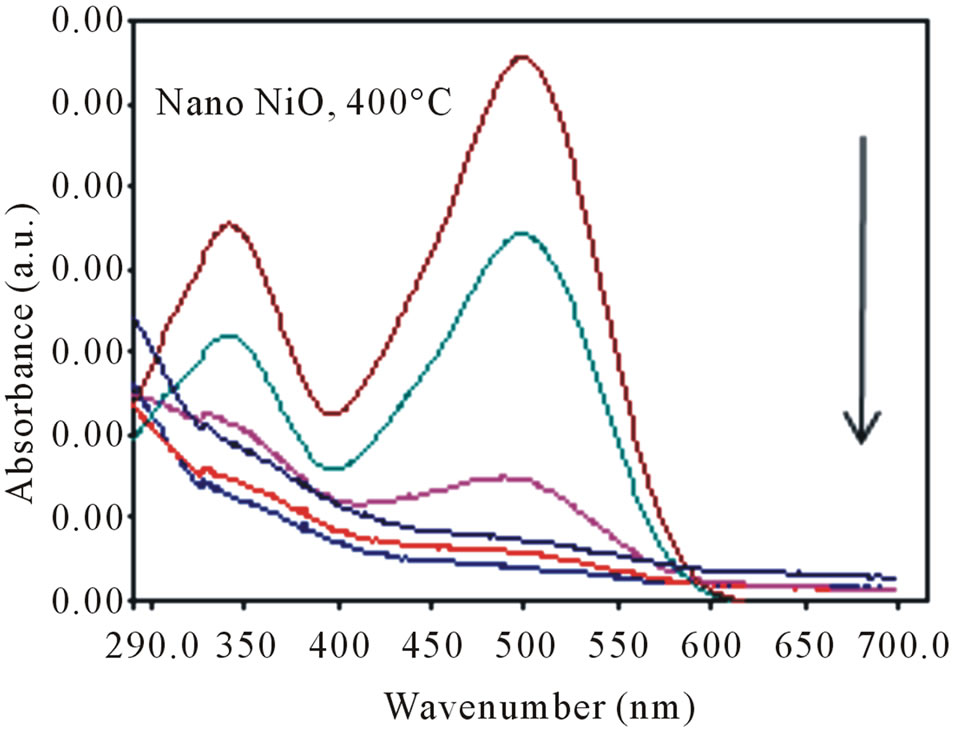
Figure 8. Variation of the UV absorption spectra of Congo red solution in the presence of NiO400.
A0 is the initial absorbance, and A is the variable absorbance. Without any catalyst, only a slow decrease in the concentration of Congo red was detected under UV irradiation. The addition of catalysts leads to obvious degradation of organic dyes. The reusability of NiO400 was checked by consecutive repeated adsorption of the dye and testing the photoactivity of the sample for the new degradation cycle (Figure 10). This procedure was repeated three times on the same sample as described for Congo red. It was found that photo degradation efficiency of CR slightly decreases with the recycling and remains almost constant after successive cycles, which is more than 90% of that of the first recycling times.
4. Conclusion
The NiO nanoporous was synthesized using folic acid as
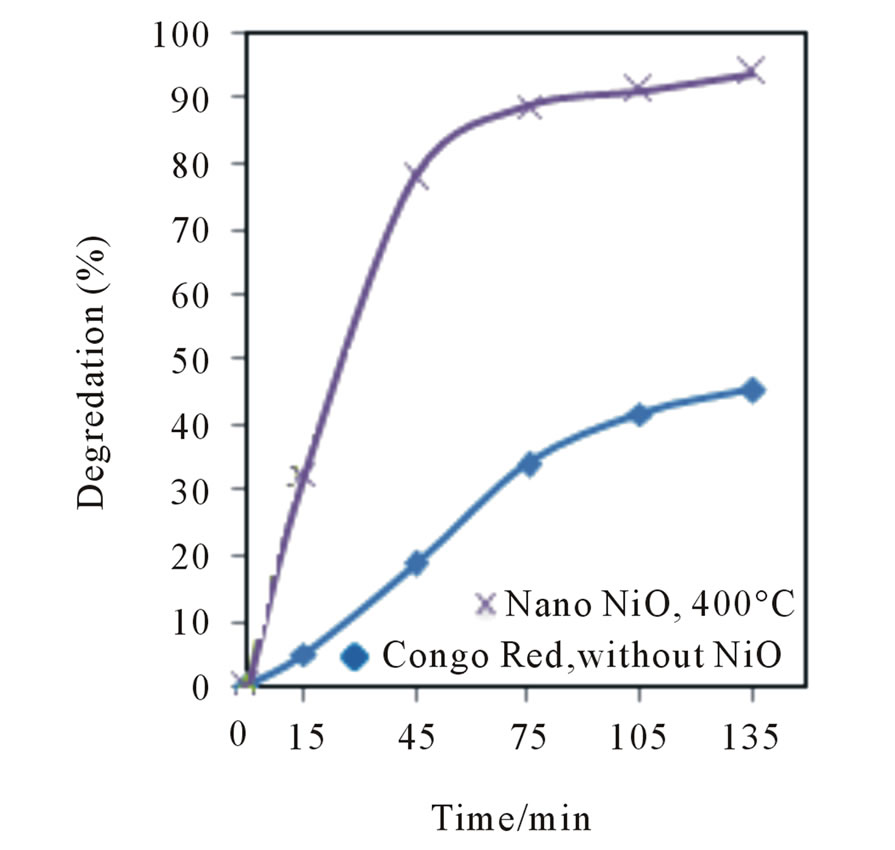
Figure 9. The curves of (a) Ln(C0/C) vs irradiation time efficiency of photo degradation (X) as a function of time; (b) at 497 nm.
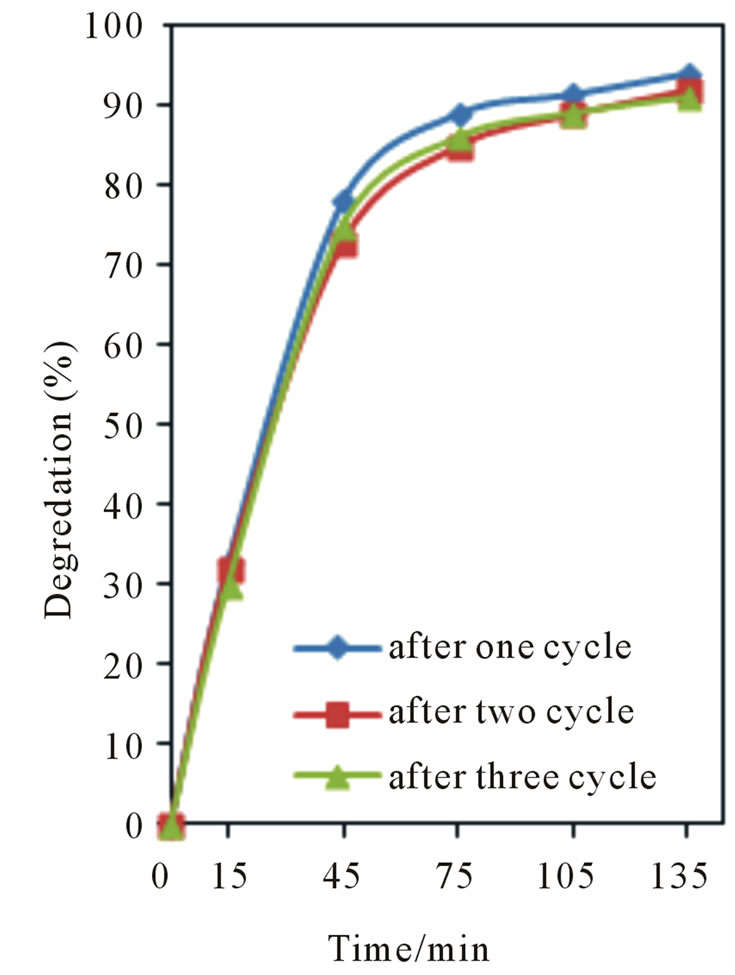
Figure 10. Results of recycling experiment for NiO400.
template. The synthesized nanoporous as nanoparticles were found to be fully crystalline with uniform distribution. Increasing the time of the reflux of the solution decreased the size of nanoparticles and increasing the amount of the folic acid increased the size of the nanoparticles. The experimental observation was supported by SEM and TEM analysis. The experimental results demonstrated that the NiO400 had an excellent optical property and higher photocatalytic activity than that of bulk NiO for degradation of Congo red under UV irradiation. In addition, this kind of NiO400 may provide guidance for the application of NiO in the treatment of organic pollutants. There are many advantages in this work as it uses as a green solvent, is a simple method, saves time, uses cheap available chemicals, and provides smaller nanoparticles of NiO.
5. Acknowledgements
The financial support from the University of Alzahra is gratefully acknowledged.
REFERENCES
- T. Y. Kim, J. Y. Kim, S. H. Lee, H. W. Shim, S. H. Lee, E. K. Suh and K. S. Nahma, “Characterization of ZnO Needle-Shaped Nanostructures Grown on NiO Catalyst Coated Si Substrates,” Synthetic Metals, Vol. 144, No. 1, 2004, pp. 61-68. doi:10.1016/j.synthmet.2004.01.010
- D. S. Wang, R. Xu, X. Wang and Y. D. Li, “NiO Nanorings and Their Unexpected Catalytic Property for CO Oxidation,” Nanotechnology, Vol. 17, No. 4, 2006, pp. 979-983. doi:10.1088/0957-4484/17/4/023
- M. A. Gondal, M. N. Sayeed and Z. Seddigi, “Laser Enhanced Photo-Catalytic Removal of Phenol from Water Usingp-Type NiO Semiconductor Catalyst,” Journal of Hazardous Materials, Vol. 155, No. 1-2, 2008, pp. 83-89. doi:10.1016/j.jhazmat.2007.11.066
- J. Bandara and H. Weerasinghe, “Solid-State Dye-Sensitized Solar Cell with p-Type NiO as a Hole Collector,” Solar Energy Materials and Solars Cells, Vol. 85, No. 3, 2005, pp. 385-390. doi:10.1016/j.solmat.2004.05.010
- I. Hotovy, V. Rehacek, P. Siciliano, S. Capone and L. Spiess, “Sensing Characteristics of NiO Thin Films as NO2 Gas Sensor,” Thin Solid Films, Vol. 418, No. 1, 2002, pp. 9-15.
- Y. M. Lee, C.-H. Hsu and H.-W. Chen, “Structural, Optical, and Electrical Properties of p-Type NiO Films and Composite TiO2/NiO Electrodes for Solid-State DyeSensitized Solar Cells,” Applied Surface Science, Vol. 255, No. 8, 2009, pp. 4658-4663. doi:10.1016/j.apsusc.2008.12.014
- Y. G. Wang and X. G. Zhang, “Enhanced Electrochemical Capacitance of NiO Loaded on TiO2 Nanotubes,” Journal of the Electrochemical Society, Vol. 152, No. 4, 2005, pp. A671-A676. doi:10.1149/1.1864392
- G. A. Niklasson and C. G. Granqvist, “Electrochromics for Smart Windows: Thin Films of Tungsten Oxide and Nickel Oxide, and Devices Based on These,” Journal of Materials Chemistry, Vol. 17, No. 2, 2007, pp. 127-156. doi:10.1039/b612174h
- F. Li, H. Y. Chen, C. M. Wang and K. A. Hu, “A Novel Modified NiO Cathode for Molten Carbonate Fuel Cells,” Journal of Electroanalytical Chemistry, Vol. 531, No. 1, 2002, pp. 53-60. doi:10.1016/S0022-0728(02)01019-7
- S. G. Kim, S. P. Yoon, J. Han, S. W. Nam, T. H. Lim, I. H. Oh and S. A. Hong, “A Study on the Chemical Stability and Electrode Performance of Modified NiO Cathodes for Molten Carbonate Fuel Cells,” Electrochimica Acta, Vol. 49, No. 19, 2004, pp. 3081-3089. doi:10.1016/j.electacta.2004.01.027
- Y. Wang, J. Zhu, X. Yang, L. Lu and X. Wang, “Preparation of NiO Nanoparticles and Their Catalytic Activity in the Thermal Decomposition of Ammonium Perchlorate,” Thermochimica Acta, Vol. 437, No. 1-2, 2005, pp. 106- 109. doi:10.1016/j.tca.2005.06.027
- X. Li, X. Zhang, Z. Li and Y. Qian, “Synthesis and Characteristics of NiO Nanoparticles by Thermal Decomposition of Nickel Dimethylglyoximate Rods,” Solid State Communications, Vol. 137, No. 11, 2006, pp. 581-584. doi:10.1016/j.ssc.2006.01.031
- D. Y. Han, H. Y. Yang, C. B. Shen, X. Zhou and F. H. Wang, “Synthesis and Size control of NiO Nanoparticles by Water-in-Oil Microemulsion,” Powder Technology, Vol. 147, No. 1-3, 2004, pp. 113-116. doi:10.1016/j.powtec.2004.09.024
- X. Y. Deng and Z. Chen, “Preparation of Nano-NiO by Ammonia Precipitation and Reaction in Solution and Competitive Balance,” Materials Letters, Vol. 58, No. 3- 4, 2004, pp. 276-280. doi:10.1016/S0167-577X(03)00469-5
- X. Xin, Z. Lu, B. Zhou, X. Huang, R. Zhu, X. Sha, Y. Zhang and W. Su, “Effect of Synthesis Conditions on the Performance of Weakly Agglomerated Nanocrysalline NiO,” Journal of Alloys and Compound, Vol. 427, No. 1- 2, 2007, pp. 251-255. doi:10.1016/j.jallcom.2006.02.064
- A. Dierstein, H. Natter, F. Meyer, H. O. Stephan, C. Kropf and R. Hempelmann, “Electrochemical Deposition under Oxidizing Conditions (EDOC): A New Synthesis for Nanocrystalline Metal Oxides,” Scripta Materialia, Vol. 44, No. 8-9, 2001, pp. 2209-2212. doi:10.1016/S1359-6462(01)00906-X
- D. J. Seo, S. B. Park, Y. C. Kang and K. L. Choy, “Formation of ZnO, MgO and NiO Nanoparticles from Aqueous Droplets in Flame Reactor,” Journal of Nanoparticle Research, Vol. 5, No. 3-4, 2003, pp. 199-210. doi:10.1023/A:1025563031595
- C. Lin, S. A. Al-Muhtaseb and J. A. Ritter, “Thermal Treatment of Sol-Gel Derived Nickel Oxide Xerogels,” Journal of Sol-Gel Science and Technology, Vol. 28, No. 1, 2003, pp. 133-141. doi:10.1023/A:1025653607374
- Y. R. Park and K. J. Kim, “Sol-Gel Preparation and Optical Characterization of NiO and Ni1−xZnxO Thin Films,” Journal of Crystal Growth, Vol. 258, No. 3-4, 2003, pp. 380-384. doi:10.1016/S0022-0248(03)01560-4
- Y. Wang, C. Ma, X. Sun and H. Li, “Preparation of Nanocrystalline Metal Oxide Powders with the Surfactant-Mediated Method,” Inorganic Chemistry Communications, Vol. 5, No. 10, 2002, pp. 751-755. doi:10.1016/S1387-7003(02)00546-4
- G. Schmid, “Large Clusters and Colloids. Metals in the Embryonic State,” Chemical Reviews, Vol. 92, No. 8, 1992, pp. 1709-1727. doi:10.1021/cr00016a002
- L. Brus, “Capped Nanometer Silicon Electronic Materials, Capped Nanometer Silicon Electronic Materials,” Advanced Materials, Vol. 5, No. 4, 1993, pp. 286-288. doi:10.1002/adma.19930050414
- B. G. Ershov, E. Janata and A. Henglein, “Growth of Silver Particles in Aqueous Solution Long-Lived Magic Clusters and Ionic Strength Effects,” Journal of Physical Chemistry, Vol. 97, No. 2, 1993, pp. 339-343. doi:10.1021/j100104a013
- P. V. Kamat, “Photochemistry on Nonreactive and Reactive (Semiconductor) Surfaces,” Chemical Review, Vol. 93, No. 1, 1993, pp. 267-300. doi:10.1021/cr00017a013
- K. J. Klabunde, J. Stark, O. Koper, C. Mohs, G. P. Dong, S. Decker, Y. Jiang, I. Lagadic and D. Zhang, “Nanocrystals as Stoichiometric Reagents with Unique Surface Chemistry,” Journal of Physical Chemistry, Vol. 100, No. 30, 1996, pp. 12142-12153. doi:10.1021/jp960224x
- M. R. Hoffmann, S. T. Martin, W. Choi and D. W. Bahnemannt, “Environmental Applications of Semiconductor Photocatalysis,” Chemical Reviews, Vol. 95, No. 1, 1995, pp. 69-96. doi:10.1021/cr00033a004
- J. C. Ireland, P. Klostermann, E. W. Rice and R. M. Clark, “Inactivation of Escherichia coli by Titanium Dioxide Photocatalytic Oxidation,” Applied and Environmental Microbiology, Vol. 59, No. 5, 1993, pp. 1668-1670.
- M. S. Chiou, P. Y. Ho and H. Y. Li, “Adsorption of Anionic Dyes in Acid Solutions Using Chemically CrossLinked Chitosan Beads,” Dyes and Pigments, Vol. 60, No. 1, 2004, pp. 69-84. doi:10.1016/S0143-7208(03)00140-2
- R. Gong, Y. Ding, M. Li, C. Yang, H. Liu and Y. Sun, “Utilization of Powdered Peanut Hull as Biosorbent for Removal of Anionic Dyes from Aqueous Solution,” Dyes and Pigments, Vol. 64, No. 3, 2005, pp. 187-192. doi:10.1016/j.dyepig.2004.05.005
- C. Namasivayam and D. Kavitha, “Removal of Congo Red from Water by Adsorption onto Activated Carbon Prepared from Coir Pith, an Agricultural Solid Waste,” Dyes & Pigments, Vol. 54, No. 1, 2002, pp. 47-58. doi:10.1016/S0143-7208(02)00025-6
- V. Vimonses, S. Lei, B. Jin, C. W. K. Chow and C. Saint, “Kinetic Study and Equilibrium Isotherm Analysis of Congo Red Adsorption by Clay Materials,” Chemical Engineering Journal, Vol. 148, No. 2-3, 2009, pp. 354- 364. doi:10.1016/j.cej.2008.09.009
- M. K. Purkait, A. Maiti, S. DasGupta and S. De, “Removal of Congo Red Using Activated Carbon and Its Regeneration,” Journal of Hazardous Materials, Vol. 145, No. 1-2, 2007, pp. 287-295. doi:10.1016/j.jhazmat.2006.11.021
- F. A. Pavan, S. L. P. Dias, E. C. Lima and E. V. Benvenutti, “Removal of Congo Red from Aqueous Solution by Anilinepropylsilica Xerogel,” Dyes and Pigments, Vol. 76, No. 1, 2008, pp. 64-69. doi:10.1016/j.dyepig.2006.08.027
- I. D. Mall, V. C. Srivastava, N. K. Agarwal and I. M. Mishra, “Removal of Congo Red from Equilibrium Isotherm Analyses,” Chemosphere, Vol. 61, No. 4, 2005, pp. 492-501. doi:10.1016/j.chemosphere.2005.03.065
- H. Chen and J. Zhao, “Adsorption Study for Removal of Congo Red Anionic Dye Using Organo-Attapulgite,” Adsorption, Vol. 15, No. 4, 2009, pp. 381-389. doi:10.1007/s10450-009-9155-z
- M. G. Abd El-Wahed, M. S. Rafat and S. M. El-Megharbel, “Synthesis, Spectroscopic and Thermal Characterization of Some Transition Metal Complexes of Folic Acid,” Spectrochimica Acta Part A, Vol. 70, No. 4, 2008, pp. 916-922. doi:10.1016/j.saa.2007.10.008
- M. Salavati-Niasari, N. Mir and F. Davar, “Synthesis and Characterization of NiO Nanoclusters via Thermal Decomposition,” Polyhedron, Vol. 28, No. 6, 2009, pp. 1111-1114.
- A. Aslani, V. Oroojpour and M. Fallahi, “Sonochemical Synthesis, Size Controlling and Gas Sensing Properties of NiO Nanoparticles,” Applied Surface Science, Vol. 257, No. 9, 2011, pp. 4056-4061. doi:10.1016/j.apsusc.2010.11.174
- K. Anadan and R. V. Rajenderan, “Morphological and Size Effects of NiO Nanoparticles via Solvothermal Process and Their Optical Properties,” Materials Science in Semiconductor Processing, Vol. 14, No. 1, 2011, pp. 43- 47. doi:10.1016/j.mssp.2011.01.001
NOTES
*Corresponding author.