Materials Sciences and Applications
Vol.3 No.8(2012), Article ID:21794,8 pages DOI:10.4236/msa.2012.38075
Synthesis and Spectroscopic Characterization of Undoped Nanocrytalline ZnO Particles Prepared by Co-Precipitation
![]()
Departemen Fisika, FMIPA-Universitas Indonesia, Depok, Indonesia.
Email: *rosari.saleh@ui.ac.id
Received May 8th, 2012; revised June 9th, 2012; accepted July 1st, 2012
Keywords: ZnO nanoparticles; Structural and optical properties; magnetic resonance
ABSTRACT
A series of undoped nanocrystalline ZnO particles were successfully synthesized at various dry temperatures (100˚C - 600˚C) using coprecipitation method. The samples were characterized using a variety of experimental methods such as x-ray diffraction (XRD), energy dispersive x-ray spectroscopy (EDX), thermal analysis TG-DTA, UV-vis spectroscopy, infrared absorption spectroscopy (FTIR) and electron spin resonance spectroscopy (ESR). According to XRD analysis, all of our ZnO samples posses the hexagonal wurzite structure with average crystallite size increased ranging from 19 - 23 nm as dry temperature increased. Optical absorption spectra show that the band gap shifted to the lower energy with increasing crystallite size. ESR measurements showed the resonance of electron centers with the g values of about 1.96. With increasing dry temperature we observed the decrease of the g values and the increase of the intensities of the ESR signal. In addition an increase in dry temperature results in a pronounce decrease of OH local vibrational modes. The results from ESR measurements are well supported by the results obtained from Infrared absorption spectroscopy and thermal analysis measurements.
1. Introduction
Although the interest of research in semiconductor ZnO has started in 1935 [1], it was first in 1950s did it gain more credence mainly due to its optical properties [2]. In many respects ZnO stands somewhat between the heteropolar alkali halides and the homopolar semiconductors group IV elements, and it is often considered as an electronic semiconductor with a large band gap. Thus, replacement of zinc atoms by an element of group I-A or I-B or oxygen atoms by an element group V-A, should result in the formation of acceptor centers, while replacement of zinc atoms by an element of group III-A or oxygen atoms by an element group VII-A, should lead to the formation of donor centers [3] as well as zinc and oxygen vacancies could act as acceptor and donor, respectively. Recently, it was shown that ZnO possess superior properties such as a high exciton binding energy combined with a low lasing threshold density and a good resistance to bombardment with high energy particles [4]. It is one of the promising candidates as a serious alternative to GaN for use in optoelectronic devices and UV lasers operating at high temperatures and harsh environments. However, almost all optoelectronic applications require the control of conductivity from n-type to p-type. One of the major obstacles that have to be overcome to allow for successful development of optoelectronic devices and lasers is the difficulty in finding an efficient p-type dopant.
As grown, ZnO is almost always exhibits n type conductivity, with electrons in the conduction band as the charge carriers. The origin of this conductivity has been discussed for years and is still controversial. Traditionally, the nature of this conductivity has been attributed to native defects. However, Van de Walle [5] in his firstprinciples investigation, based on density functional theory suggested that the presence of hydrogen atom in ZnO can act as a shallow donor. This behavior is unexpected and very different from hydrogen’s role in other semiconductors, in which it acts only as a compensating center counteracting the prevailing conductivity. The presence of hydrogen in the crystal-growth is not surprising and it is very difficult to avoid its incorporation into the sample during the process of the crystal-growth.
In nanoscale semiconductor materials, ZnO is of extraordinary importance and a substantial number of papers have been published reporting on ZnO nanostructure/nanoparticles. As the material becomes smaller it possess additional properties, namely 1) the quantumsize effect, that influences the bandgapsize [6,7], and consequently the optical and electronical properties of the materials, and 2) a large ratio of surface to volume relative to bulk materials. The latter property is relevant to hydrogen storage and catalysis. Several synthesis methods of ZnO nano particles have been reported in the past years, such as sol-gel chemistry [8], sonochemical method [9], hydrothermal method [10], combustion method [11] and coprecipitation method [7]. Controlling the synthesis condition is a critical point, because the properties of the nanoparticles are found to vary with synthesis methods. The variation in optical and electronical properties is assigned to different parameter such as pH, aging time, reaction temperature as well as dry temperatures.
In this article we report the synthesis of nanocrystalline ZnO particles obtained using coprecipitation method at various dry temperature and characterize the structural, optical properties, vibrational modes and magnetic resonance of these nanoparticles. Structure is characterized using x-ray diffraction (XRD), optical properties and vibrational modes are studied by UV-vis and infrared absorption spectroscopy, while magnetic resonance are deployed using electron spin resonance (ESR) spectroscopy. Through these measurements we attempt to correlate one property to the others. Our results are compared with those published in the literatures.
2. Experimental
For the synthesis of undoped ZnO nanoparticles in this study, the zinc sulfate hepta hydrate (99.9%) ZnSO4∙7H2O, 25% aqueous NaOH and ethanol were used which are procured from Aldrich. All of the chemicals used were analytical reagent grade and were directly used without further purification. Synthesis of ZnO nanoparticles was carried out using coprecipitation method. 24.6 mmol analytical grade of ZnSO4∙7H2O from Aldrich was dissolved in 250 ml de-ionized water with vigorous stirring at temperature of 80˚C. Simultaneously, appropriate amount of NaOH was dissolved in 500 ml of de-ionized water. Then, both solutions were mixed with constant stirring at temperature of 80˚C for 30 min until a milky white solution was obtained. After the reaction process, the solution was centrifuged at 3000 rpm for 10 min and washed for several times with deionized water and ethanol to remove the by-product sodium sulfate (NaSO4). The precipitate was cooled and aged at room temperature for 24 h. To obtain various concentration of hydrogen the precipitate was dried in a vacuum oven at various dry temperatures, Td (100˚C - 600˚C) for 4 h. Some samples were annealed at annealing temperature up to 800˚C for 6 h.
The structural characterization has been carried out by using a standard x-ray diffractometer (Philips PW1710) with monochromatic Cu-Kα (λ = 1.54060 Å) radiation operated at 40 kV and 20 mA in the range from 10˚ to 80˚. The calibration of the diffractometer was done using Si powder. The XRD patterns of the specimens were verified by comparison with the JCPDS data. The average size of precipitate crystallites
3. Results and Discussion
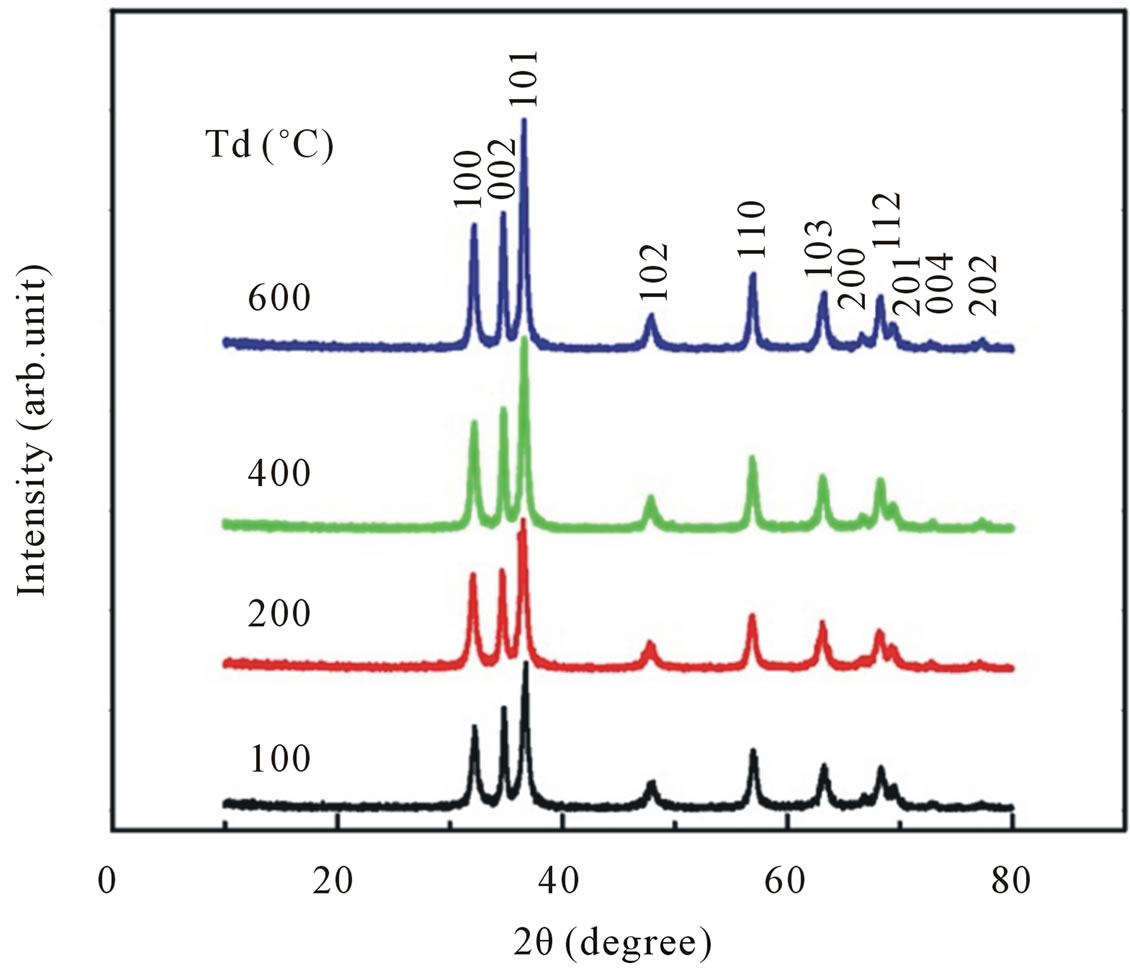
Figure 1(a) shows the XRD patterns of samples synthesized by coprecipitation methods with dry temperature Td of 100˚C, 200˚C, 400˚C and 600˚C for 4 h. The spectra are almost equal to the typical XRD spectra of ZnO nanoparticles reported from other experiments [12, 13]. In all our XRD patterns nine peaks are observed around 2Θ = 32.12, 34.48, 36.6, 47.76, 56.84, 63.02, 66.95, 68.23, 69.24 which correspond to (100), (002), (101), (102), (110), (103), (200), (112) and (201), respectively. For each sample, all observed peaks can be indexed as the hexagonal wurzite structure of ZnO with having space group P63mc. The existence of any impurity compound other than wurzite structure is not observed.
These results are consistent with the results obtained from EDX spectra in Figure 1(b). In addition to an Oxygen peak at 0.6 keV, Zn signals at about 1.01, 8.7 and 9.5 keV was observed, indicative of successful synthesis of ZnO nanoparticles as already confirmed by XRD data.
The values of lattice parameters calculated from XRD data by using the Rietveld refinement analysis are shown in Figures 2(a) and (b), respectively. All available reflections were fitted with the Gaussian distribution. Analysis of XRD patterns Figure 1(a) suggested that the lattice parameters for ZnO obtained with dry temperature Td = 100˚C are a = b = 3.255 Å and c = 5.218 Å. There is no significant difference in calculated lattice parameters as dry temperature is increased from 100˚C to 600˚C. These results are slightly higher than the standard JCPDS parameter for bulk ZnO, a = b = 3.2498 Å and c = 5.206 Å.
 (a)
(a)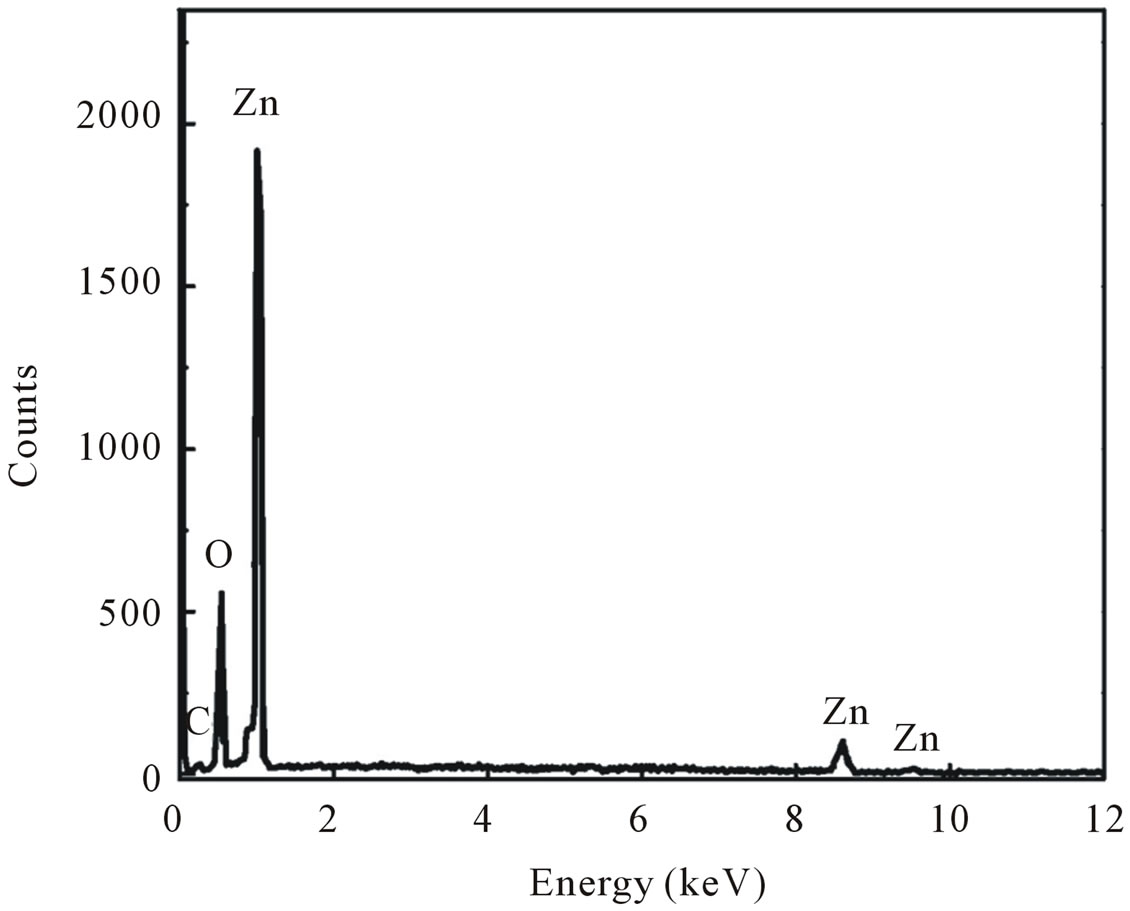 (b)
(b)
Figure 1. (a) X-ray diffraction patterns of ZnO nanoparticles synthesized with different dry temperatures; (b) EDX spectra of ZnO nanoparticles.
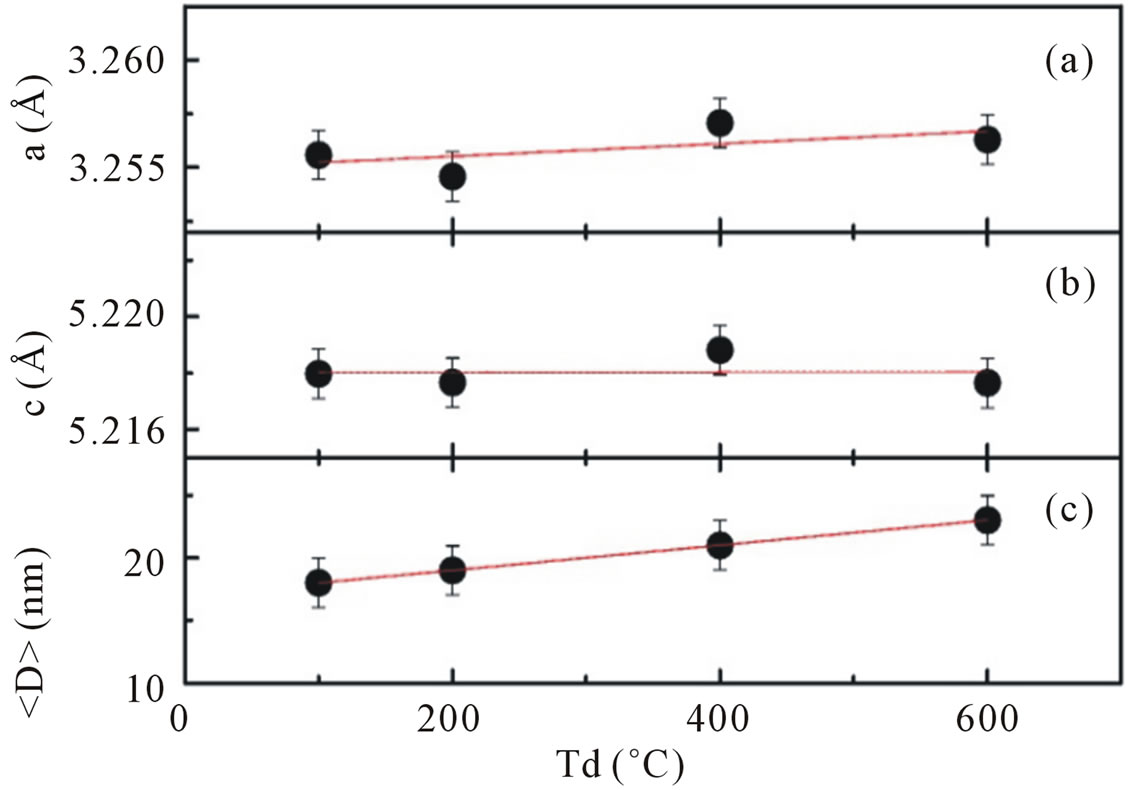
Figure 2. Panel (a) and (b) show lattice parameters a and c of hexagonal wurzite ZnO calculated using the (101) and (002) peaks as a function of dry temperature; panel (c) shows the average crystallite size obtained from Scherrer’s formula. Lines are guides to the eye.
Moreover, a careful analysis of peak positions suggestive a small shifting in its value toward a lower 2Θ with increasing dry temperature, indicating a presence of compressive strain in the samples [14]. It is also shown that for the entire samples the reflection peaks become sharper and the full width at half maximum (FWHM) are slightly decreased with increasing dry temperature.
Using the Scherrer peak broadening method, the average crystallite size obtained are ~18 nm for Td of 100˚C, ~19 nm for Td of 200˚C, ~21 nm for Td of 400˚C and ~23 nm for Td of 600˚C (Figure 2(c)), thus indicating a little enhancement in average crystallite size at higher dry temperature.
In order to reveal the changes that occured during thermal treatment of the precursor, TG-DTA analysis were carried out from room temperature to 600˚C in atmosphere (see Figure 3). According to the TG curve the precursor loses its weight in two major steps.
The first major step is in the temperature range below 100˚C and indicated a loss of 3.2 wt% revealing the dehydrogenation process of surface-adsorbed water molecules.
The second step of weight loss (2.6 wt%) appeared in the range of 100˚C - 220˚C could be associated with out diffusion of OH− ions or hydrogen atoms from the ZnO network. A further out diffusion of OH− ions or H atoms is observed from a slightly decrease of the TG curve at temperatures higher than 220˚C. Since the total weight loss in the entire thermal analysis study was less than 8 wt% indicating the major amount of ZnO formation during synthesis. The DTA curve of the precursor obtained during thermal treatment exhibits two endothermic peaks correspond to two major weight loss steps of TGA curve.
Optical characterization was carried out by measuring
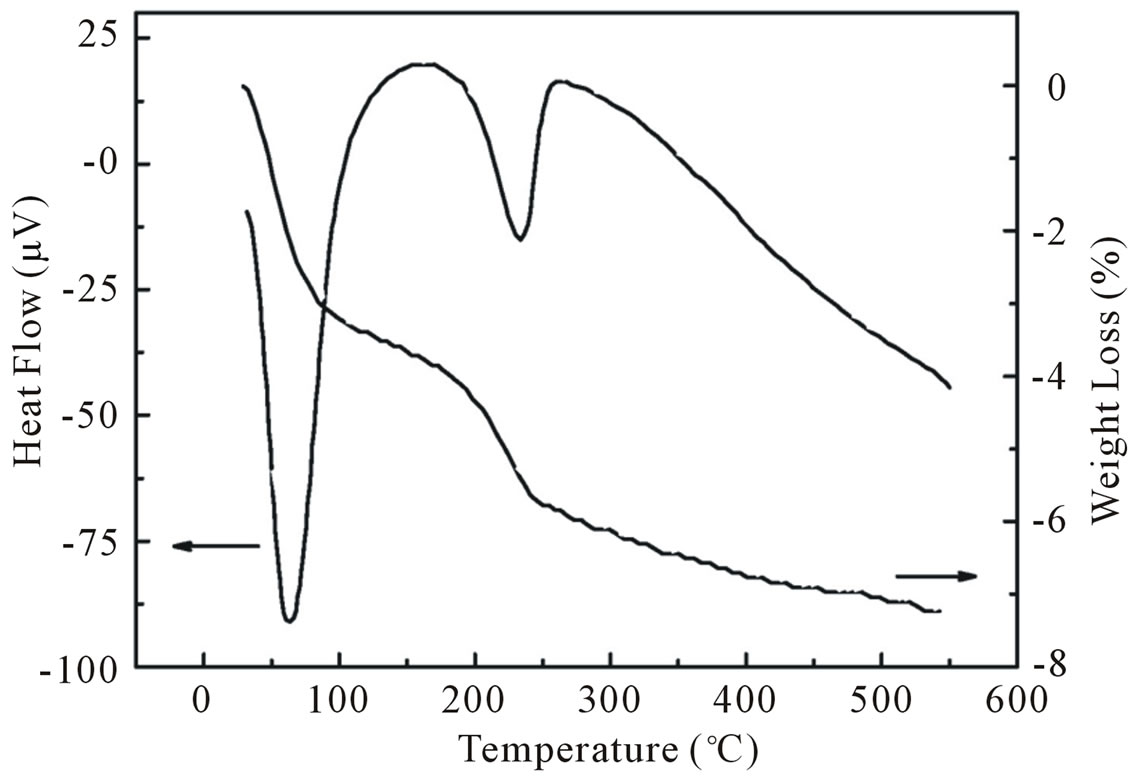
Figure 3. TG curve showing the weight loss for ZnO nanoparticles as a function of temperature and its corresponding DTA curve.
the diffuse reflectance spectroscopy. All spectra were taken in the range of 200 - 800 nm. Figure 4 shows the diffuse reflectance spectra R as a function of wavelength for samples shown in Figure 1(a). Since our samples are powder, the low reflectance values in our spectra indicate high absorption in the corresponding wavelength region. The data collected at room temperature showed a clear difference between the samples in the region of 350 - 800 nm. The significance of this is more visible after applying the Kubelka-Munk function F(R) given by the relation F(R) = (1 − R)2/2R, where R is the magnitude of reflectance [15]. The optical gap (inset of Figure 4) was estimated from diffuse reflectance spectra by plotting the square of the Kubelka-Munk function F(R)2 as a function of energy. To obtained the optical gap the linear part of F(R)2 curve was extrapolated until it intersects the energy axis at F(R)2 = 0.
The optical gap of ZnO dried at 100˚C determined by the above method to be 3.52 eV, which is higher than that for bulk ZnO (3.32 eV). The corresponding optical gaps are seen to be shifted to lower energies with increasing dry temperature. The optical gap of our ZnO samples was found around 3.52 eV for Td of 100˚C, 3.46 eV for Td of 200˚C, 3.38 eV for Td of 400˚C and 3.35 eV for Td of 600˚C. The variation of optical gap in ZnO has been observed by several authors [12,16], who is explained that the change in optical gap on the basis of variation of the average particle size.
A typical ESR spectrum of ZnO dried at Td = 200, 400 and 600˚C are shown in Figures 5(a)-(c), respectively. Almost symmetric resonance was observed, and the resonance shifts to a higher field, which corresponds to the decrease in g-value. The quenching of the linewidth can be seen as the dry temperature is increased. The intensity, on the other hand increased with increasing dry temperature. The ESR signal in the sample dried with Td = 100˚C was found very weak compared to samples dried
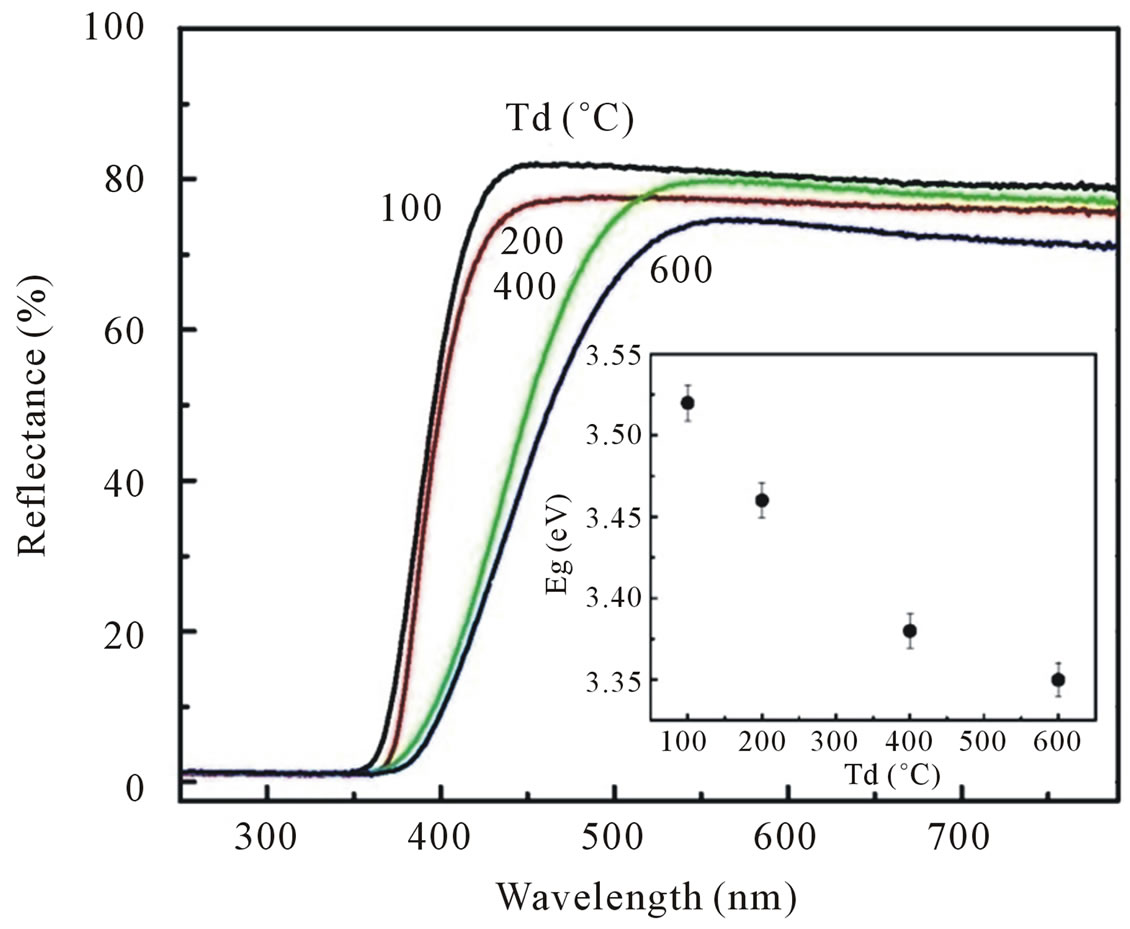
Figure 4. Diffuse reflectance spectra of ZnO nanoparticles synthesized with various dry temperatures. The inset shows the correlated optical gap of ZnO nanoparticles as a function of dry temperatures.
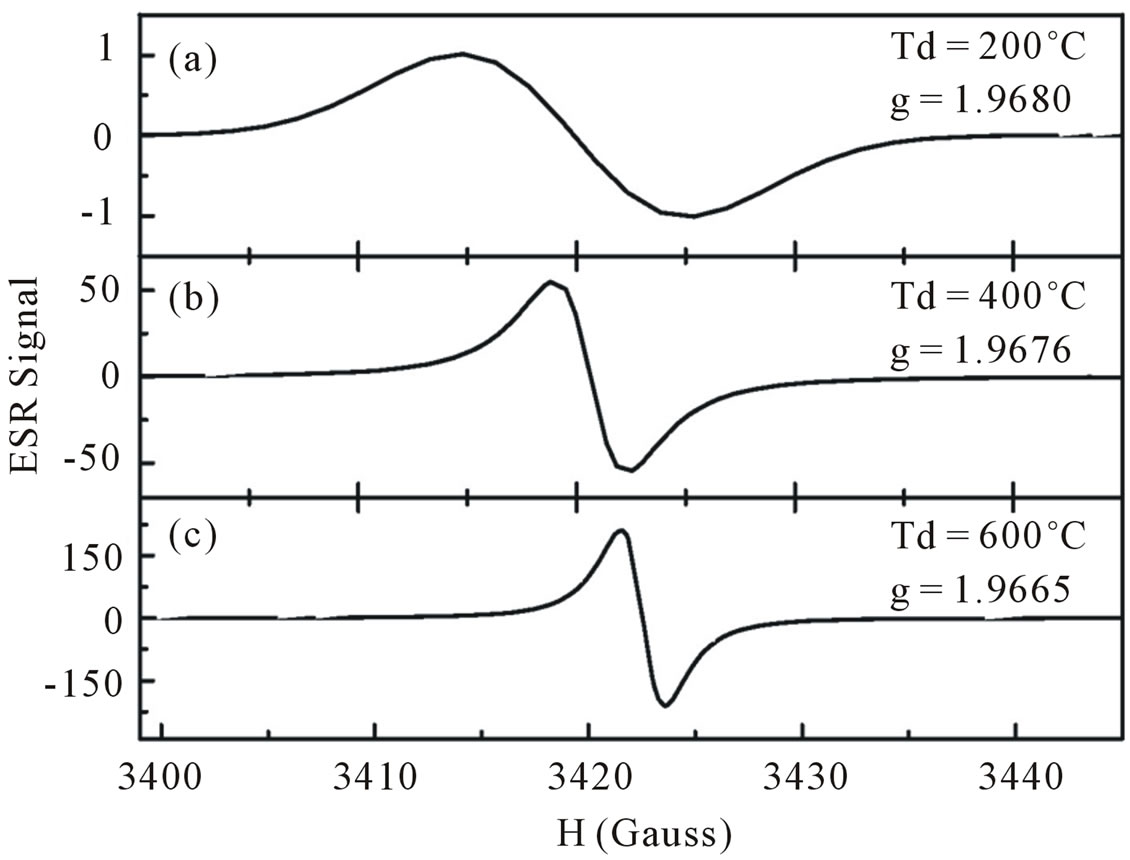
Figure 5. ESR spectra of ZnO nanoparticles dried at dry temperature of (a) 200˚C; (b) 400˚C; (c) 600˚C.
in higher temperatures (not shown in the figure). The resonance position for the spectrum corresponds to a g-value of 1.9680 for sample dried at Td = 200˚C, 1.9676 for Td = 400˚C and 1.9665 for Td = 600˚C.
Although the origin of the signal with these g-values are still unclear, it has been demonstrated in the literature that the paramagnetic signal around g value of 1.96 appears often owing to residual impurities in ZnO (F, Cl, Br and Al, Ga, In; with the g-value being practically independent of the type of impurities) as well as intrinsic defects like oxygen vacancies or Zn interstitial [3,17-23]. Recently, Hoffmann et al. [22] conducted high-field ESR and ENDOR experiment at microwave frequencies of 95 and 275 GHz on ZnO single crystal. Their results showed the ESR signal with g-values of g// = 1.9569 ± 0.00005 and g┴ = 1.9552 ± 0.00005 (g parallel and perpendicular to the crystal c-axis), D1 and D2 centers. Using ENDOR technique, it was shown that hydrogen atom is involved in the D1 center. This result was in good agreement with the prediction of van de Walle [5]. However, the origin of D2 center so far remains unknown. In early publications [3,17,19], it was shown that the g value at 1.96 correlates with electron conductivity and originates from shallow donors. Kasai [3] and Hausmann et al. [18] argued that this line are related to the oxygen vacancies, whereas the EPR signal with the g values of g// = 1.9945 and g┴ = 1.9960 was attributed by Hausmann and Schallenberger [18] to the oxygen atom in the tetrahedral interstitial position. Several authors [21,24-27], however associated the EPR signal at g// = 1.9945 and g┴ = 1.9960 to an oxygen vacancy V0+ charge states, that are observed only in irradiated ZnO crystals under illumination and stable up to 400˚C - 500˚C annealing.
By comparing our results with the results obtained in the literature above we believed that the g values in our samples correlated with the oxygen sublattices that could be occupied with hydrogen atoms.
At lower dry temperature, almost all oxygen sublattices were occupied by hydrogen, made it difficult to detect the ESR signal. Therefore we could only detect weak ESR signal in samples dried with Td lower than 400˚C. At higher dry temperature the occupation number of hydrogen in the oxygen sublattices is reduced, leaving unoccupied and giving rise to an ESR signals. It is also shown that the integrated area increases essentially with an increase in dry temperatures. Our g-values are in line with the value reported previously from the ZnO single crystal, ceramic and powder [3,17,18]. These results showed that the ESR signal at g ~ 1.96 in our samples appears to its fullest intensity without irradiation or/and simultaneous illumination the samples.
To support this hypothesis we have annealed our samples in vacuum in order to diffuse hydrogen out of the samples. The results are displayed in Figure 5. It is seen that annealing the samples above 400˚C had influenced the intensity of ESR signal as well as integrated area. Both are enhanced with increasing temperature annealing indicating that the number of paramagnetic center are increased with increasing annealing temperatures. We believe therefore our ESR results correspond to oxygen sublattices. The hydrogen atoms occupied the oxygen sublattice is considerable lower in our annealed samples than in the as-grown samples. Our ESR results are supported by the results obtained from infrared absorption spectra.
Infrared absorption measurements allow the study of hydrogen bonding configurations of as grown as well as annealed samples. Typical infrared absorption spectra of samples synthesized at different dry temperatures are displayed in Figure 6.
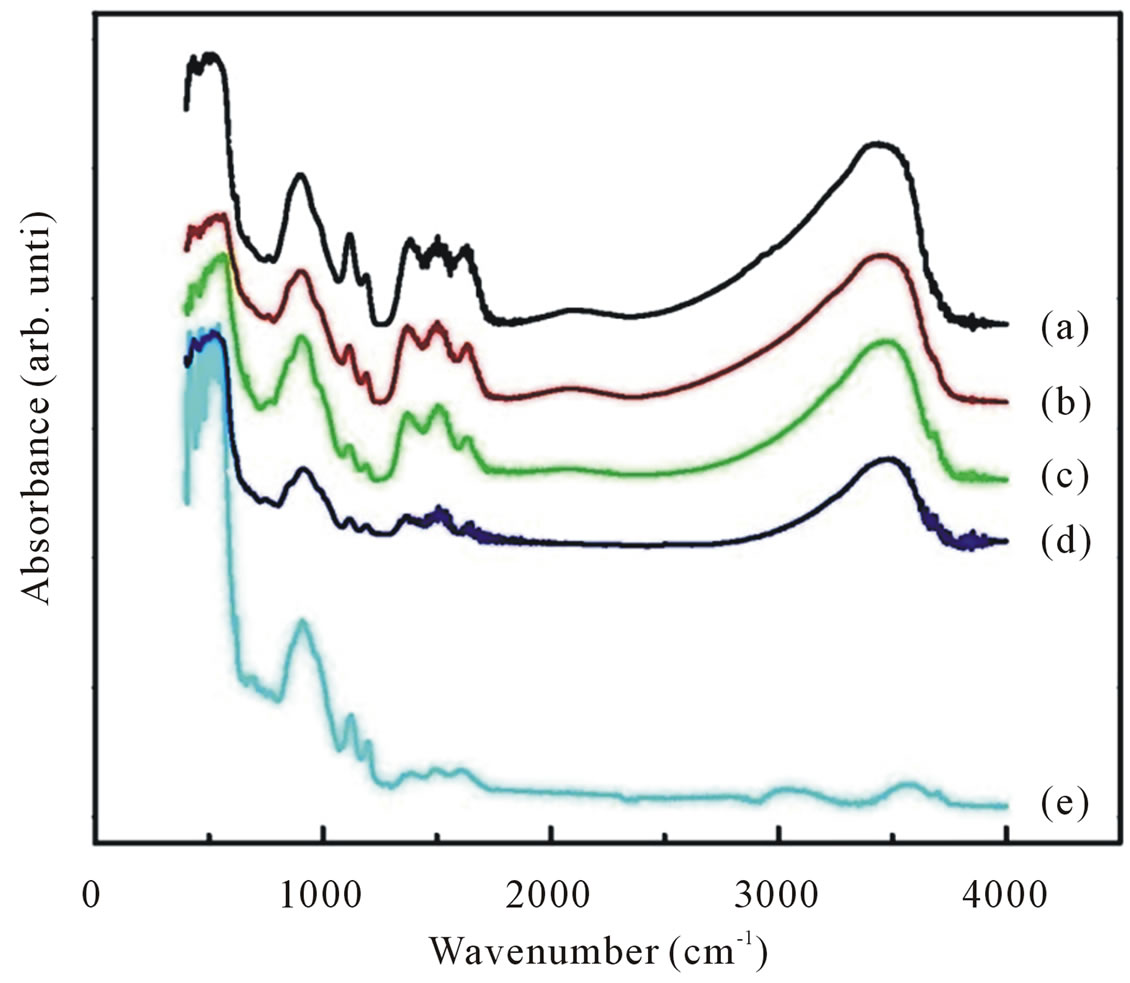
Figure 6. FTIR spectra of ZnO nanoparticles synthesized with various dry temperatures (curve (a)-(e)). Also shown the FTIR spectra of ZnO nanoparticles annealed with temperature annealing of 800˚C.
Also shown is the infrared spectrum for the sample dried at 100˚C for 4 h and further annealed 800˚C for 6 h (curve e). For all as-synthesized samples the strong absorption peaks in the range of 400 - 700 cm−1 could be attributed to ZnO stretching modes [28,29]. These stretching modes are indicative of successful synthesized of nanocrystalline ZnO particles as already confirmed by XRD and EDX studies. At the same time we can also observed an absorption peak around 1646, 1390 and 1121 cm−1 corresponds to OH bending mode, C-OH in-off plane bending and C-OH out-of-plane bending, respectively [30]. A broad band in the region 2900 - 3700 cm−1 can be explained as overlaping of physically absorbed water, O-H stretching modes and C-H stretching modes. C-H local vibrational modes between 2800 and 3100 cm−1 have been observed in a number of semiconductor such as amorphous silicon carbon (a-SiC:H), GaAs, and GaN [31-33]. In these materials the local vibrational modes are assigned to symmetric and antisymmetric C-H stretching modes.
To obtain information more clearly on the local vibrational modes correspond to OH modes we focalized our analysis on the infrared absorption range of interest, namely in a wave number range of 2900 - 3700 cm−1. All spectra can be deconvoluted into two peaks around 2990 cm−1 attributed to CH stretching mode and 3400 cm−1 associated with physically absorbed water and O-H stretching modes (dashed line in Figure 7).
An increase in dry temperature from 100˚C to 600˚C is seen to result in general decrease in the absorption peak height and in significant change of the spectral distribution. In particular a shift of absorption band to the higher wave number. Annealing the samples results in lowering of the peak height and a shift of peaks maximum towards higher wave number even further and the absorption peaks are diminished as the samples were annealed at temperature annealing of 800˚C for 6 h. The spectra of the samples dried at higher temperatures as well as the samples annealed at annealing temperatures lower than 800˚C showed that OH band is still remained indicating that hydrogen remaining are chemically bonded to the oxygen in ZnO network. The total integrated absorption of the CH and OH stretching bands as a function of dry temperatures are plotted in Figure 8. The integrated absorption is evaluated by the sum of absorption
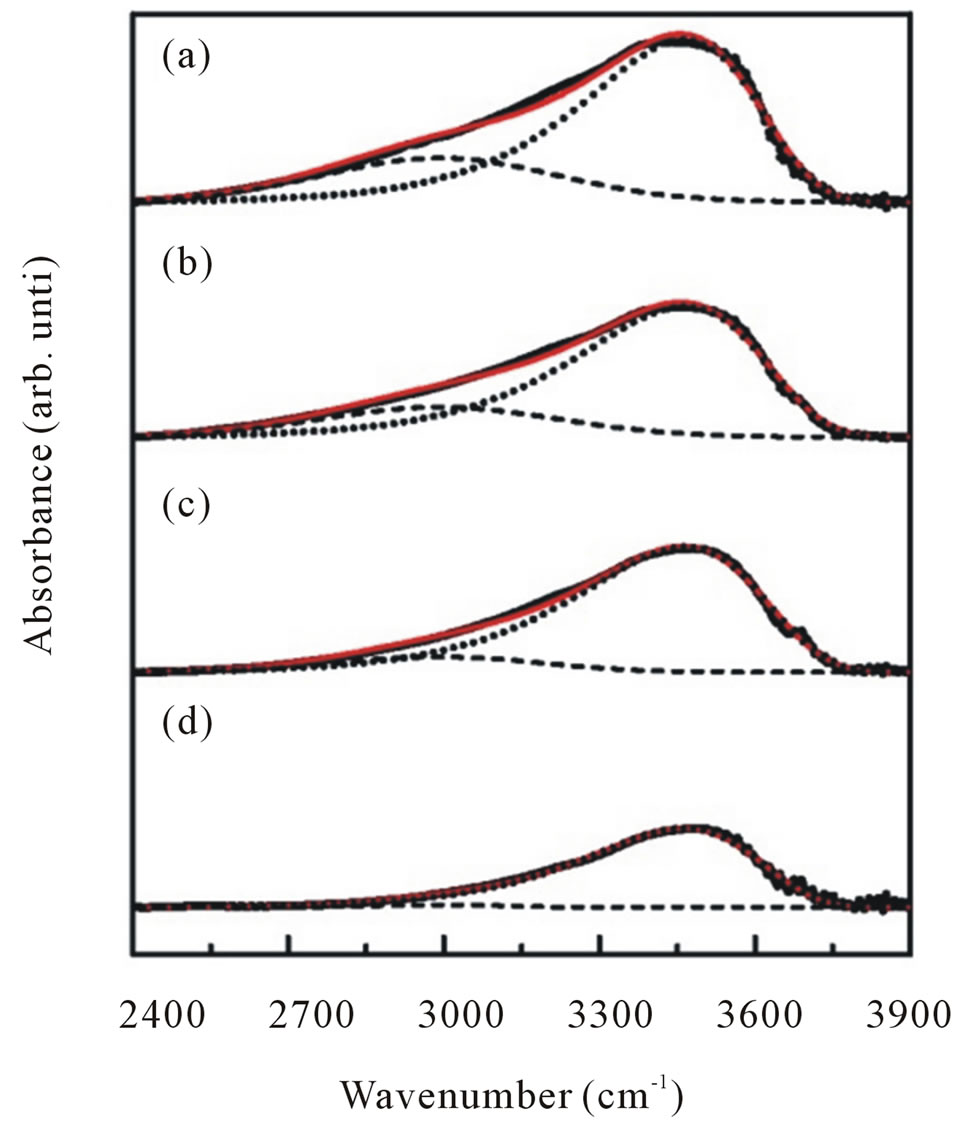
Figure 7. Representative deconvolution of C-H stretching (dash line) and O-H stretching (dotted line) modes of infrared absorption band in the range of 2400 - 3900 cm−1 for ZnO nanoparticles synthesized with various dry temperatures.
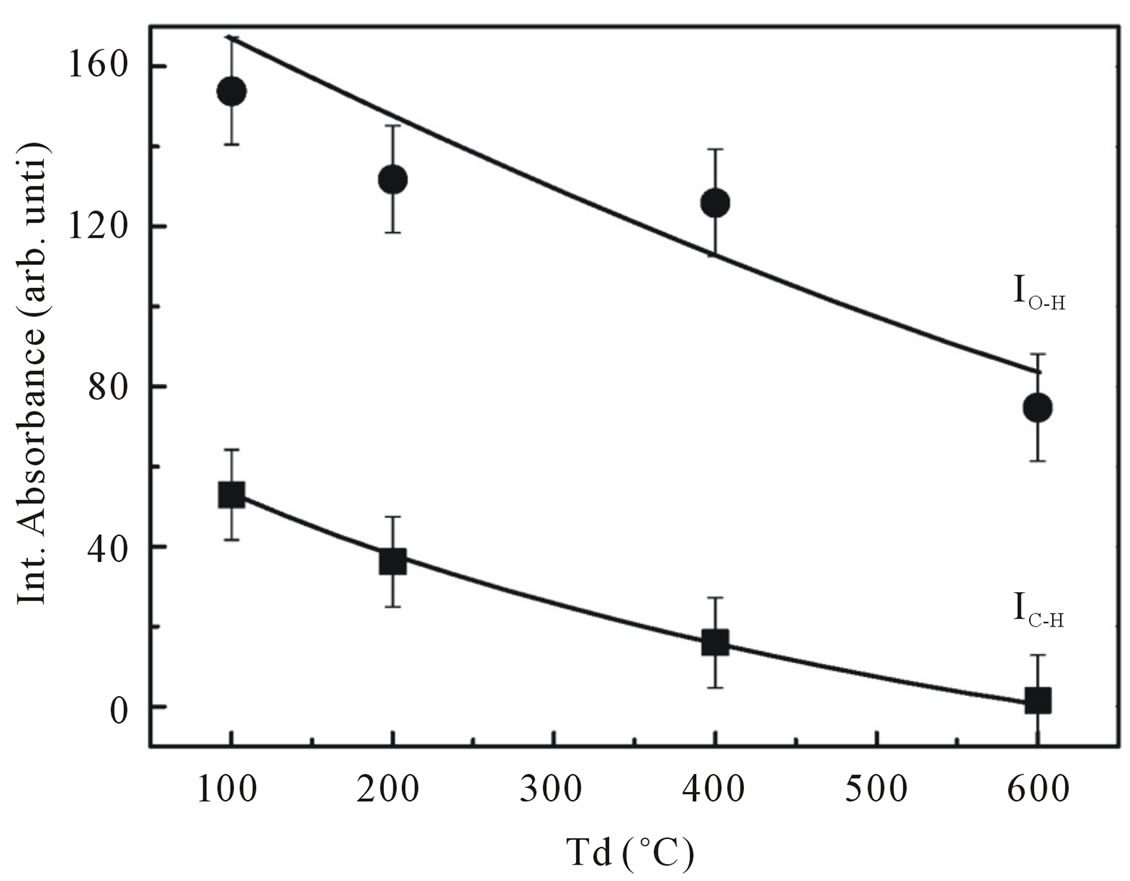
Figure 8. Integrated absorption of C-H stretching mode at 2990 cm−1 and O-H stretching mode at 3400 cm−1.
areas of the fits. As one may observe in Figure 8, most of hydrogen atoms in our samples prefer to bond to oxygen atoms rather than carbon atoms. An increase in the dry temperature resulted in an overall decrease in the integrated absorption. This figure clearly showed that the dry temperature limits the incorporation of hydrogen atom bonded in the shape of OH as well as CH groups. This result is consistent with the ESR results describe previously. The influence of hydrogen incorporation on g-value in our ESR measurements shown in Figures 5 and 9 revealed that our ESR signal is dominated by paramagnetic centers due to oxygen sublattice.
4. Summary
In summary, a series of undoped nanocrystalline ZnO particles were synthesized using coprecipitation method at various dry temperatures. Some samples were annealed at annealing temperature up to 800˚C for 6 h. The properties of as-synthesized and annealed samples were characterized by various methods of measurements. XRD pattern for as-synthesized as well as annealed samples agree well with the standard XRD patern of ZnO with hexagonal wurzite structure. These results are consistent with the results obtained from EDX spectra. Moreover, all diffraction peaks revealed stronger peak intensities, indicating that the obtained ZnO particles have high crystallinity. The as-synthesized ZnO particles have an average of grain size 18 - 23 nm, increased with increasing dry temperatures. UV-vis measurements showed the red shift in the optical absorption band with increasing average grain size. ESR spectra of our ZnO particles show the resonance of electron center with the g-value close to 1.96. We believed that this resonance due to the oxygen sublattices which were occupied with hydrogen atoms. A decrease of the g-value and an increase of the oxygen sublattices were observed with decreasing hy-
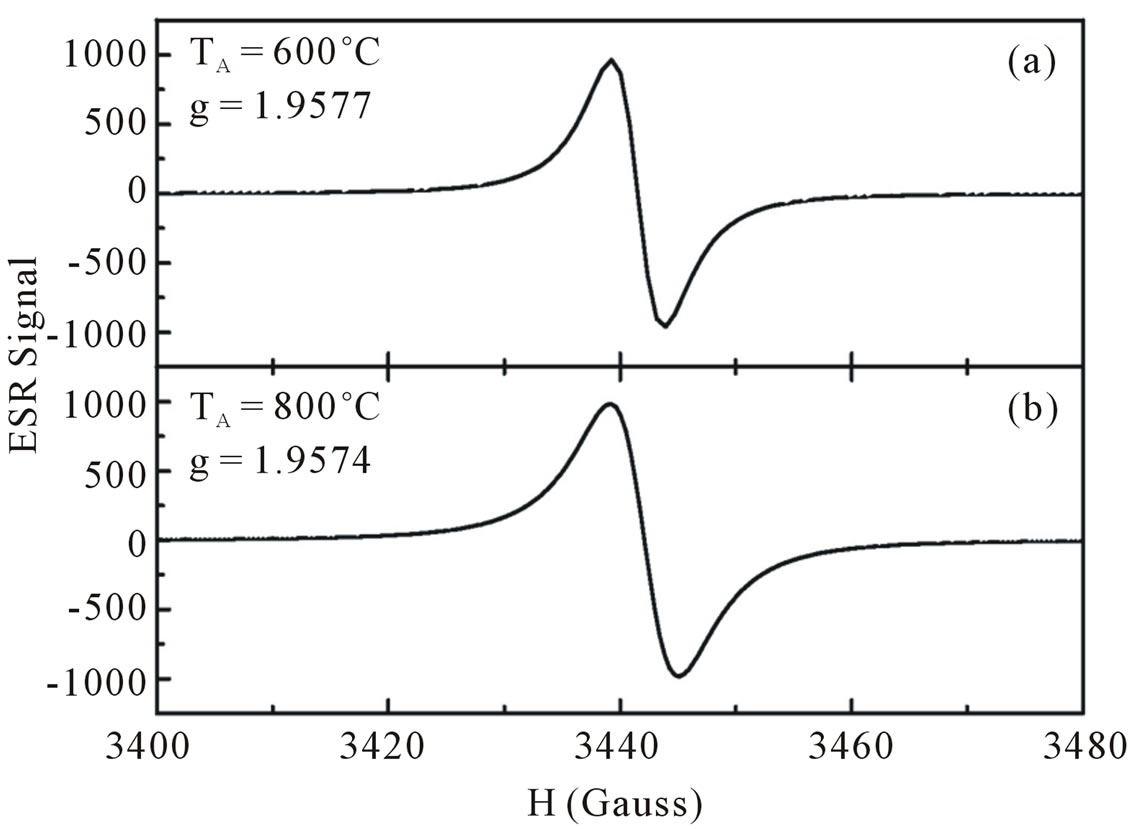
Figure 9. ESR spectra of ZnO nanoparticles annealed with temperature of anneling at 600˚C (a) and 800˚C (b).
drogen incorporated in oxygen atoms, as can be seen from infrared absorption measurement.
REFERENCES
- C. W. Bunn, “The Lattice Dimensions of Zinc Oxide,” Proceedings of the Physical Society, Vol. 47, No. 5, 1935, pp. 835-842. doi:10.1088/0959-5309/47/5/307
- F. Seitz and D. Turnbull, “Solid State Physics: Advances in Research and Application Vol 8,” Academic press Inc., New York, 1959.
- P. H. Kasai, “Electron Spin Resonance Studies of Donors and Acceptors in ZnO,” Physical Review, Vol. 130, 1963, pp. 989-995. doi:10.1103/PhysRev.130.989
- U. Özgür, Y. I. Alivov, C. Liu, A. Teke, M. A. Reshchikov, S. Dogan, V. Avrutin, S. J. Cho and H. Morkoc, “A Comprehensive Review of ZnO Material and Devices,” Journal of Applied Physics, Vol. 98, 2005, Article ID: 041301.
- C. G. Van de Walle, “Hydrogen as a Cause of Doping in Zinc Oxide,” Physical Review Letters, Vol. 85, 2000, pp. 1012-1015. doi:10.1103/PhysRevLett.85.1012
- V. Ischenko, S. Polarz, D. Grote, V. Stavarache, K. Fink and M. Driess, “Zinc Oxide Nanoparticles with Defects,” Advanced Functional Materials, Vol. 15, No. 12, 2003, pp. 1945-1954. doi:10.1002/adfm.200500087
- P. K. Sharma, A. C. Pandey, G. Zolnierkiewicz, N. Guskos and C. Rudowicz, “Relationship between Oxygen Defects and the Photoluminescence Property of ZnO Nanoparticles: A Spectroscopic View,” Journal of Applied Physics, Vol. 106, No. 9, 2009, Article ID: 094314. doi:10.1063/1.3256000
- H. C. Huang and T. E. Hsieh, “Preparation and Characterization of Highly Tansparent UV-Curable ZnO-Acrylic Nanocomposites,” Ceramics International, Vol. 36, No. 4, 2010, pp. 1245-1251. doi:10.1016/j.ceramint.2010.01.010
- K. V. Rajeswari and P. Gomathisankar, “Antibacterial and Photocatalytic Activities of Sonochemically Prepared ZnO and Ag-ZnO,” Journal of Alloys and Compounds, Vol. 508, No. 2, 2010, pp. 587-591. doi:10.1016/j.jallcom.2010.08.128
- Y. Hu and H. J. Chen, “Preparation and Characterization of Nanocrystalline ZnO Particles from a Hydrothermal Process,” Journal of Nanoparticle Research, Vol. 10, No. 3, 2008, pp. 401-407. doi:10.1007/s11051-007-9264-0
- C. S. Lin, C. C. Hwang, W. H. Lee and W. Y. Tong, “Preparation of Zinc Oxyde (ZnO) Powder with Different Types of Morphology by a Combution Synthesis Method,” Materials Science and Engineering: B, Vol. 140, No. 1-2, 2007, pp. 31-37. doi:10.1016/j.mseb.2007.03.023
- P. K. Giri, S. Bhattacharyya, D. K. Singh, R. Kesavamoorthy, B. K. Panigrahi and K. G. M. Nair, “Correlation between Microstructure and Optical Properties of ZnO Nanoparticles Synthesized by Ballmiling,” Journal of Applied Physics, Vol. 102, No. 9, 2007, Article ID: 093515. doi:10.1063/1.2804012
- Gao, Z. Zhang, J. Fu, Y. Xu, J. Qi and D. Xue, “Room Temperature Ferromagnetism of Pure ZnO Nanoparticles,” Journal of Applied Physics, Vol. 105, No. 11, 2009, Article ID: 113928. doi:10.1063/1.3143103
- A. Thurber, K. M. Reddy, V. Shutthanandan, M. H. Engelhard, C. Wang, J. Hays and A. Punnoose, “Ferromagnetism in Chemically Synthesized CeO2 Nanoparticles by Ni Doping,” Physical Review B, Vol. 76, 2007, Article ID: 165206. doi:10.1103/PhysRevB.76.165206
- M. Naeem, S. K. Hasanain and A. Mumtaz, “Electrical Transport and Optical Studies of Ferromagnetic Cobalt Doped ZnO Nanoparticles Exhibiting a Metal-Insulator Transition,” Journal of Physics: Condensed Matter, Vol. 20, No. 2, 2008, Article ID: 025210. doi:10.1088/0953-8984/20/02/025210
- L. Irimpan, V. P. N. Nampoori, P. Radhakrishnan, B. Krishnan and A. Deepthy, “Size-Dependent Enhancement of Nonlinear Optical Properties in Nanocolloids of ZnO,” Journal of Applied Physics, Vol. 103, No. 3, 2008, Article ID: 033105. doi:10.1063/1.2838178
- K. M. Sancier, “ESR Investigation of Photodamage to Zinc Oxide Powders,” Surface Science, Vol. 21, No. 1, 1970, pp. 1-11. doi:10.1016/0039-6028(70)90059-2
- A. Hausmann and B. Schallenberger, “Interstitial Oxygen in Zinc Oxide Single Crystals,” Zeitschrift fur Physik, Vol. 31, 1978, pp. 269-273.
- M. Schulz, “ESR Experiments on Ga Donors in ZnO Crystals,” Phys Status Solidi, Vol. 27, No. 1, 1975, pp. K5-K8. doi:10.1002/pssa.2210270140
- W. E. Carlos, E. R. Glaser and D. C. Look, “Magnetic Resonance Studies of ZnO,” Physical B, Vol. 308, 2001, pp. 976-979. doi:10.1016/S0921-4526(01)00850-X
- V. A. Nikitenko, K. E. Tarkpea, I. V. Pykanov and S. G. Stoyukhin, “EPR and Thermoluminescence in ZnO Single Crystals with Ionic Vacancies,” Journal of Applied Spectroscopy, Vol. 68, No. 3, 2001, pp. 502-507. doi:10.1023/A:1011975028398
- D. M. Hoffmann, A. Hofstaetter, F. Leiter, H. Zhou, F. Henecker and B. K. Meyer, “Hydrogen: A Relevant Shallow Donor in Zinc Oxide,” Physical Review Letters, Vol. 88, 2002, Article ID: 045504. doi:10.1103/PhysRevLett.88.045504
- H. Zhou, A. Hofstaetter, D. M. Hofmann and B. K. Meyer, “Magnetic Resonance Studies on ZnO Nanocrystals,” Microelectronic Engineering, Vol. 66, No. 1-4, 2003, pp. 59-64. doi:10.1016/S0167-9317(03)00025-X
- J. M. Smith and W. E. Vehse, “ESR of Electron Irradiated ZnO Confirmation of F+ Center,” Physics Letters A, Vol. 31, No. 3, 1970, pp. 147-148. doi:10.1016/0375-9601(70)90199-4
- J. M. Meese and D. R. Locker, “Oxygen Displacement Energy in ZnO,” Solid State Communications, Vol. 11, No. 11, 1972, pp. 1547-1550. doi:10.1016/0038-1098(72)90517-0
- L. S. Vlasenko and G. D. Watkins, “Optical Detection of Electron Paramagnetic Resonance in Room-Temperature Electron-Irradiated ZnO,” Physical Review B, Vol. 71, 2005, Article ID: 125210. doi:10.1103/PhysRevB.71.125210
- L. S. Vlasenko, “Magnetic Resonance Studies of Intrinsic Defects in ZnO: Oxygen Vacancy,” Applied Magnetic Resonance, Vol. 39, No. 1-2, 2010, pp. 103-111. doi:10.1007/s00723-010-0140-1
- W. Xie and X. Huang, “Synthesis of Biodiesel from Soybean Oil Using Heterogeneous KF/ZnO Catalyst,” Catalysis Letters, Vol. 107, No. 1-2, 2006, pp. 53-59. doi:10.1007/s10562-005-9731-0
- A. Hernández, L. Maya, E. Sánchez-Mora and E. M. Sánchez, “Sol-Gel Synthesis, Characterization and Photocatalytic Activity of Mixed Oxide ZnO-Fe2O3,” Journal of Sol-Gel Science and Technology, Vol. 42, No. 1, 2007, pp. 71-78. doi:10.1007/s10971-006-1521-7
- J. Das, I. R. Evans and D. Khushalani, “Zinc Glycolate: A Precursor to ZnO,” Inorganic Chemistry, Vol. 48, No. 8, 2009, pp. 3508-3510. doi:10.1021/ic900067w
- R. Saleh, M. Munisa and W. Beyer, “Infrared Absorption in a-SiC:H Films Prepared by DC Sputtering,” Thin Solid Films, Vol. 426, No. 1-2, 2003, pp. 117-123. doi:10.1016/S0040-6090(03)00003-8
- D. M. Joseph, R. Balagopal, R. F. Hicks, L. P. Sadwick and K. L. Wang, “Observation of Carbon Incorporation during Gallium Arsenide Growth by Molecular Beam Epitaxy,” Applied Physics Letters, Vol. 53, No. 22, 1988, pp. 2203-2204. doi:10.1063/1.100281
- M. O. Manasreh, J. M. Baranowski, K. Pakula, H. X. Jiang and J. Lin, “Localized Vibrational Mode of CarbonHydrogen Complexes in GaN,” Applied Physics Letters, Vol. 75, No. 5, 1999, pp. 659-661. doi:10.1063/1.124473
NOTES
*Corresponding author.