Materials Sciences and Applications
Vol.3 No.6(2012), Article ID:19833,8 pages DOI:10.4236/msa.2012.36053
Dielectric Relaxation in Complex Perovskite Oxide Sr(Gd0.5Nb0.5)O3
![]()
1Department of Physics, V. K. S. University, Ara, India; 2Department of Physics, T. M. Bhagalpur University, Bhagalpur, India; 3Department of Physics, Bose Institute, Kolkata, India.
Email: *singh_nk_phy27@yahoo.com
Received February 25th, 2012; revised March 6th, 2012; accepted April 28th, 2012
Keywords: Dielectrics; Perovskite Oxides; X-Ray Diffraction; Scanning Electron Micrograph
ABSTRACT
The complex perovskite oxide a strontium gadolinium niobate (SGN) synthesized by solid-state reaction technique has single phase with tetragonal structure. X-ray diffraction (XRD) technique and scanning electron microscopy (SEM) were used to study the structural and microstructural properties of the ceramics, respectively. The XRD patterns of SGN at room temperature show a tetragonal structure. Studies of the dielectric constant and dielectric loss of compound as a function of frequency (50 Hz to 1 MHz) at room temperature, and as a function of temperature (60˚C to 420˚C) indicate polydispersive nature of the material. The logarithmic angular frequency dependence of the loss peak is found to obey the Arrhenius law with activation energy ~0.18 eV. The small value of activation energy of the compound (~0.18 eV) can be explained by mixed ionic-polaronic conductivity mechanism. The grain size of the pellet sample was found to be 1.92 µm. The frequency-dependant electrical data are analyzed in the framework of conductivity and electric modulus formalisms. The complex plane impedance plot shows the grain boundary contribution for higher value of dielectric constant in the law frequency region.
1. Introduction
The family of compounds with general formula ABO3 is generally called perovskite oxides, as their structural is similar to the naturally obtained CaTiO3. The study on this compounds is important as they find several applications in non-linear optics, memory devices, pyroelectric, piezoelectric sensors etc. apart from the academic point of view due to physical properties they exhibits. The well-known examples are BaTiO3, PbZrO3, PbTiO3 etc. Inherent definition of ferroelectricity is the existence of a polarization state, the direction of which can be reversed by an externally applied electric field [1]. This property makes ferroelectric materials obvious candidates for new device applications [2-4]. First attempt on the synthesis of complex perovskite was reported by Galasso and Pyle [5] and Galasso and Pinto [6] with the modification in the B-site. The structures that result when there exits perfect ordering in B-site with divalent and pentavalent ions in one set of compounds and trivalent and pentavalent ions in the other set of compounds (A = Pb and Ba: B′ = Mg, Zn, Y, Fe, Nd and Gd etc., and B″ = Nb and Ta). Some of the well known complex perovskite are Ba(Zn1/3Nb2/3)O3, Sr(Zn1/3Nb2/3)O3 [7,8], (SrxLa1–x)MnO3
[9], etc. Perovskite materials with high dielectric constants have been used for technological applications such as wireless communication system, cellular phones and global positioning systems in the form of capacitors resonators and filters. Since, most of the devices are operated in the ac electrical mode, the investigation of ac electrical conduction of these materials is interesting. Complete information on correlation of sample topology with its electrical properties can be obtained by the complex impedance spectroscopy (CIS) technique [10-13]. This technique is used to investigate the electrical process occurring in the material on applying ac signal at the input. An analysis of the impedance data provides unique relaxation frequency describing the relaxation process occurring within a polycrystalline sample. High dielectric constant permits smaller capacitive components, thus enabling smaller size of electronic devices [14]. Complex perovskites are very promising for electroceramic applications and many researchers have shown considerable interest in the dielectric properties of these compounds. Materials having a diffuse phase transition (relaxors) have attracted the most attention due to their broad maximum in the temperature dependence of their dielectric constant [15,16]. COMPLEX Impedance Spectroscopy (CIS) allows measurement of the capacitance and tangent loss (tanδ) and/or conductance over a frequency range at various temperatures. From the measured capacitance and tanδ, four complex dielectric functions can be computed: impedance (Z*), electric modulus (M*), permittivity (ε*), and admittance (Y*). Studying dielectric data in the different functions allows different features of the materials to be recognized. The dielectric study of lead-free ternary compounds has been the focus of researchers in recent years and some interesting results have already been reported [17-21]. Recently, our group has also studied the dielectric relaxation behavior of some A(B′B″)O3 type perovskite oxides [22-30]. In this paper we investigate the structural and dielectric relaxation properties of the strontium gadolinium niobate, Sr- (Gd0.5Nb0.5)O3, (SGN) ceramics in the temperature range from 60˚C to 420˚C and in the frequency 50 Hz to 1 MHz by means of dielectric spectroscopy.
2. Experimental Procedures
Polycrystalline samples of SGN have been prepared by conventional solid-state reaction method. High purity reagents of SrCO3 (99.9%), Nb2O5 (99.99%) and Gd2O3 (99.95%), are used for the preparation of SGN. The mixed raw materials are calcined at 1300˚C. First of all we have sintered the pellets at temperature 1350˚C but pellets were broken quickly. So we have annealed at 1100˚C for 10 h and cooled down to room temperature by adjusting the cooling rate. Pellets of SGN are made after mixing with binder (polyvinyl alcohol) using uniaxial press. The dielectric measurement is carried out on a pellet of 2.32 mm thickness and 8.47 mm diameter with silver paste for electrical contacts. After the application of silver paste, the samples are fired at 500˚C for 30 min. From the measurement, we have obtained capacitance (C) and tangent loss (tanδ) by using an LCR meter (Hioki) in the temperature range from 60˚C to 420˚C and in the frequency 50 Hz to 1 MHz. Using(C) and (tand), we have computed dielectric constant ( ) and conductivity (
 ), where
  is the dielectric permittivity in air,
  the ratio of capacitance measured with dielectric and without dielectric,
  the angular frequency and ε″ = tanδε′. The complex electric modulus M* (=
 ) and impedance Z* (=
 ) are obtained from the temperature dependence of the real (ε′) and imaginary (ε″) components of the dielectric permittivity ε* (= ε′ – jε″).
3. Results and Discussion
The room temperature X-ray diffraction (XRD) pattern of Sr(Gd0.5Nb0.5)O3, (SGN) ceramics is shown in Figure 1. The XRD pattern (i.e., peak position and intensity), which is different from those of ingredients, clearly shows
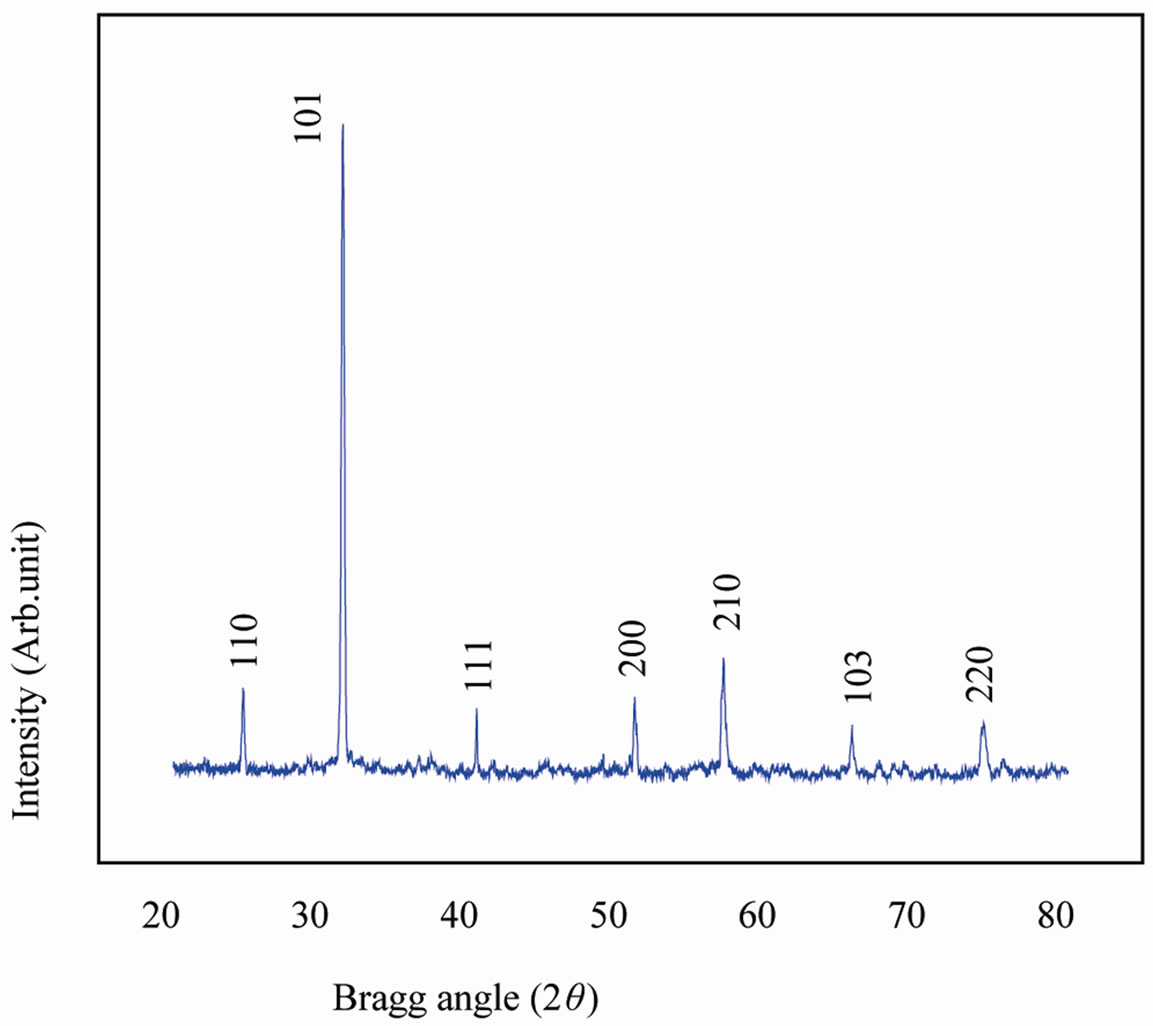
Figure 1. XRD of Sr(Gd0.5Nb0.5), (SGN), ceramics at room temperature.
the formation of a new compound. Using 2θ, interplaner spacing (d) of each peak was calculated. All the peaks were indexed in different crystal systems and cell configurations. The best agreement in observed (obs) and calculated (cal) 2θ and d values ( = minimum) was found for the tetragonal system. The least-squares refined unit cell parameters of the compound are: a = 3.6042 Ǻ, c = 4.6481 Ǻ (with estimated standard deviation in parenthesis).
These values suggest that cubic perovskite unit cell of ABO3 (A = mono/divalent, B = tri-penta valent ions) type has been distorted to the tetragonal structure on the substitution of Gd3+, Nb5+ of different radius at the B-site. Comparison of some observed (obs) and calculated (cal) d-values (in Å) of some reflections of SGN ceramics at room temperature with intensity ratio I/I0 is shown in Table 1.
The scanning electron micrograph of the SGN material at magnification of 2 and 3 µm are shown in Figure 2. The scanning electron micrograph of the sample was recorded by FEI Quanta 200 equipment to check proper compactness of the sample.
The nature of the micrographs exhibits the polycrystalline texture of the material having highly distinctive and compact rectangular/cubical grain distributions (with less voids). The grain size of the pellet sample was found to be 1.92 µm. Careful examinations (scanning) of the complete surface of the sample exhibits that the grains are homogeneously distributed through out the surface of the sample.
The relation of angular frequency ω (= 2πν) with dielectric constant (ε′) and tangent loss (tanδ) at various temperatures for SGN is described in Figure 3 and Figure 4 respectively. The variation of ε′ with frequency
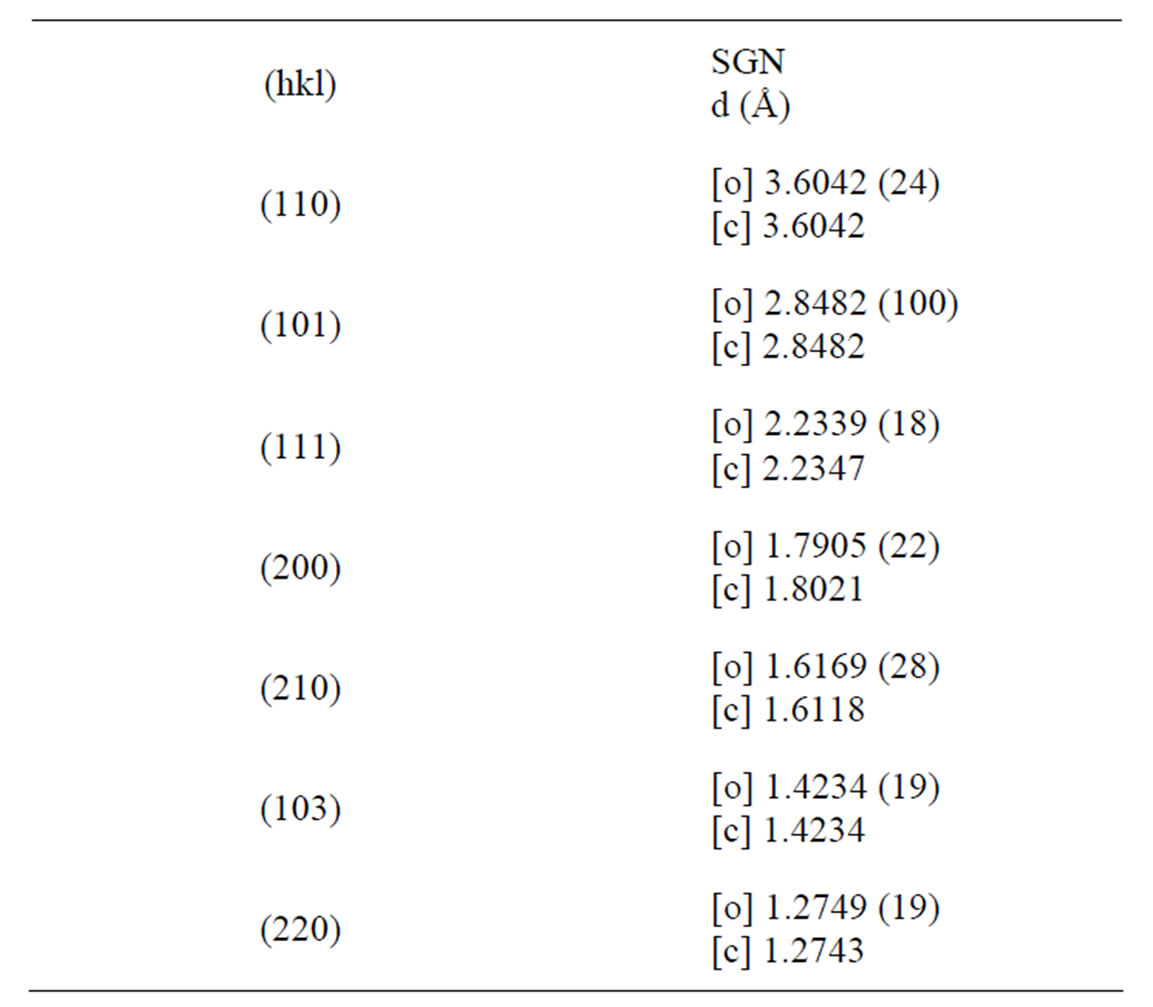
Table 1. Comparison of some observed (obs) and calculated (cal) d-values (in Å) of some reflections of SGN ceramics at room temperature with intensity ratio I/I0.
explains relaxation phenomena of the material, which are associated with a frequency-dependant orientation polarization. The value of ε′ decreases to a constant value with increase in frequency (Figure 3) in the SGN compound, which may be attributed to the fact that, at lower frequency region the permanent dipoles align themselves along the direction of the field and contribute to the total polarization of the dielectric material. On the other hand, at higher frequency the variation in field is too rapid for the dipoles to align themselves in the direction of field, i.e., dipoles can no longer follow the field, so their contribution to the total polarization and hence to the dielectric permittivity be come negligible. Therefore the dielectric constant (ε′) decreases with increase in frequency. The high value of dielectric constant (ε′) at lower frequencies, increases with decreasing frequency and increasing temperature correspond to bulk effect of the system [31].
Dielectric loss is the electrical energy lost as heat in the polarization process in the presence of an applied ac field. The energy is absorbed from the ac voltage and converted to heat during the polarization of the molecule. The dielectric loss is a function of frequency and temperature and is related to relaxation polarization, in which a dipole cannot follow the field variation without a measurable lag because of the retarding or friction forces of the rotating dipoles. Also, due to the change in polarization of the dielectric, a polarizing current flowing in the dielectric is induced by the relaxation rate. This current induces dielectric loss in the material. It is well known that in high frequency alternating fields there is always a phase difference between polarization and field, which gives the dissipation factor tanδ (=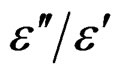 ) and is propor-
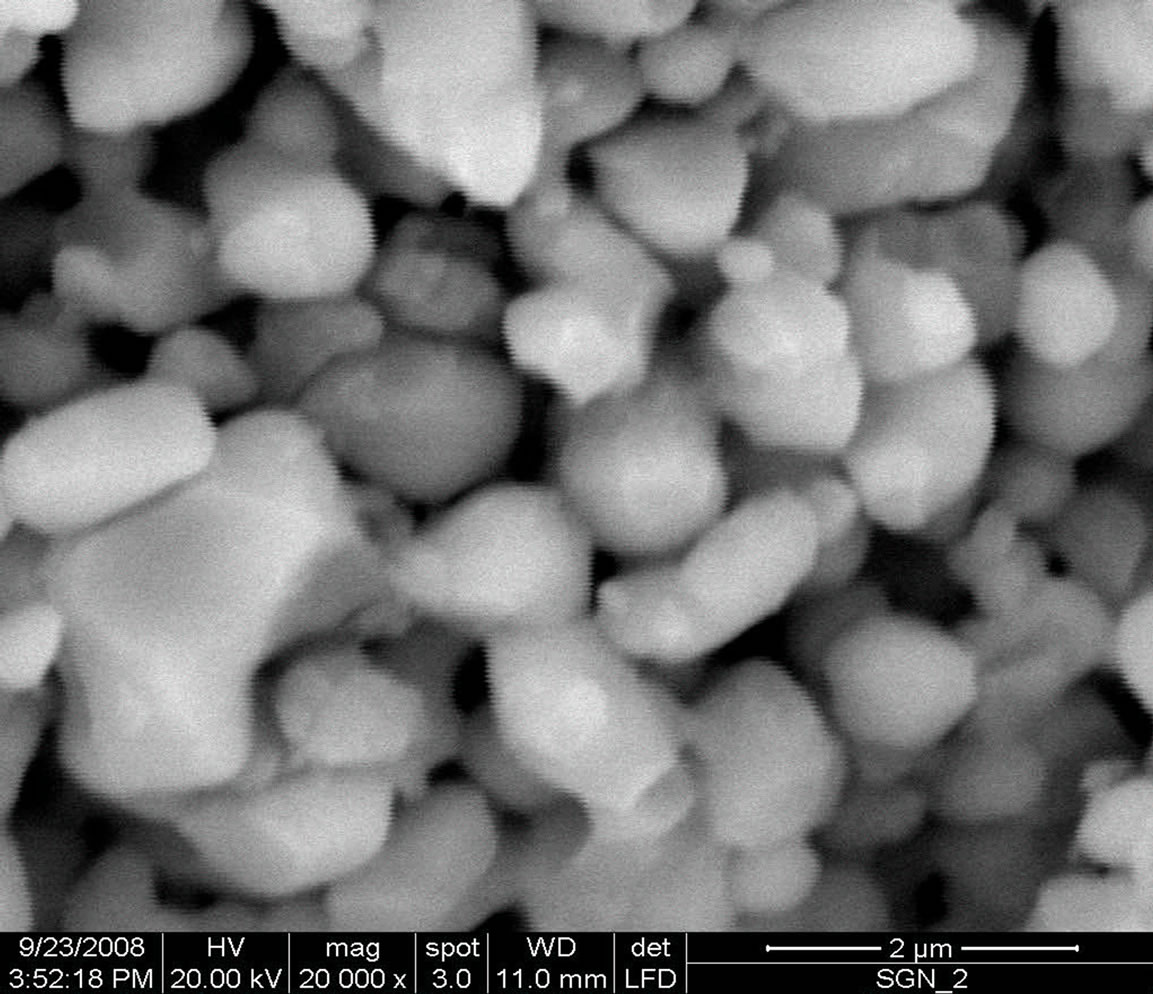
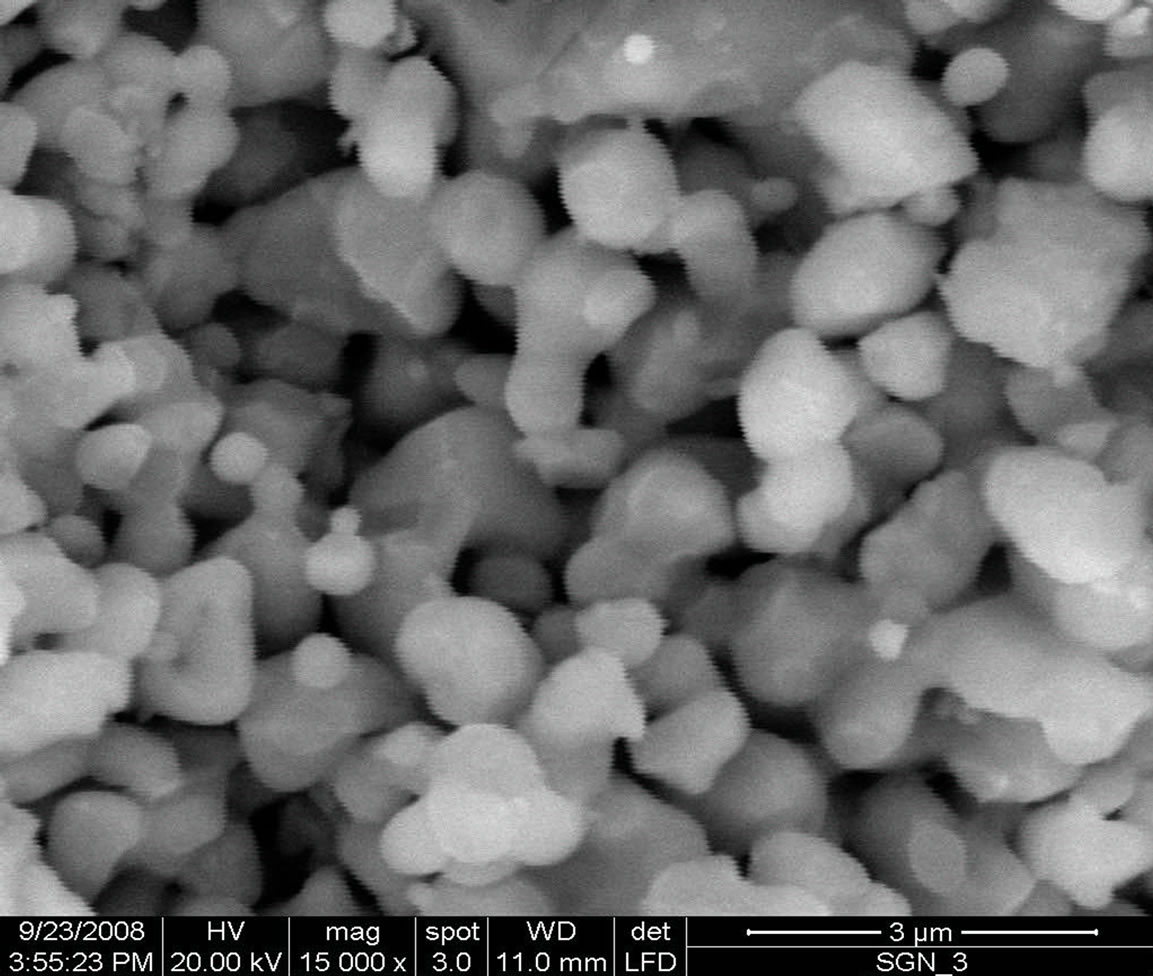
Figure 2. Scanning electron micrographs of Sr(Gd0.5Nb0.5), (SGN), ceramics at 2 and 3 µm.
Figure 3. Frequency dependence of dielectric constant (e¢) of SGN at various temperatures.
tional to the energy absorbed per cycle by the dielectric from the field. It is observed that from Figure 4 tangent loss (tanδ) increases with increasing temperature and decreasing frequency indicating that the concentration of conduction electrons increases as temperature due to thermal activation [18].
The variation of dielectric constant (ε′) of SGN as a function of temperature at few selected frequencies is shown in Figure 5. The variation in ε′ with temperature shows that it is strongly frequency and temperature dependent.
At all the frequencies, the relative dielectric constant increases linearly with rise in temperature. The increase in ε′ is more prominent at lower frequencies. However, no phase transition was observed in SGN in the experi-
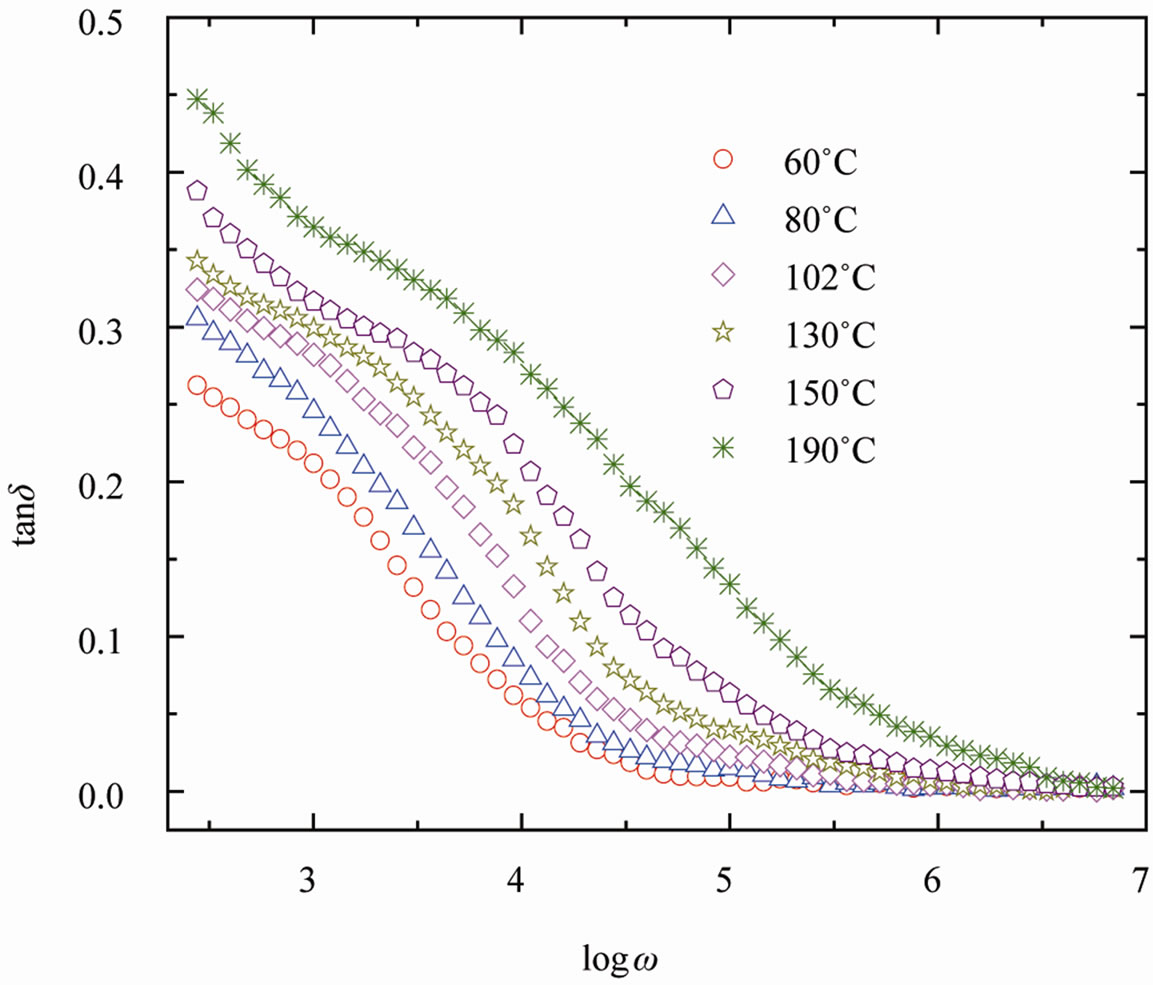
Figure 4. Variation of tanδ with frequency of SGN at various temperatures.
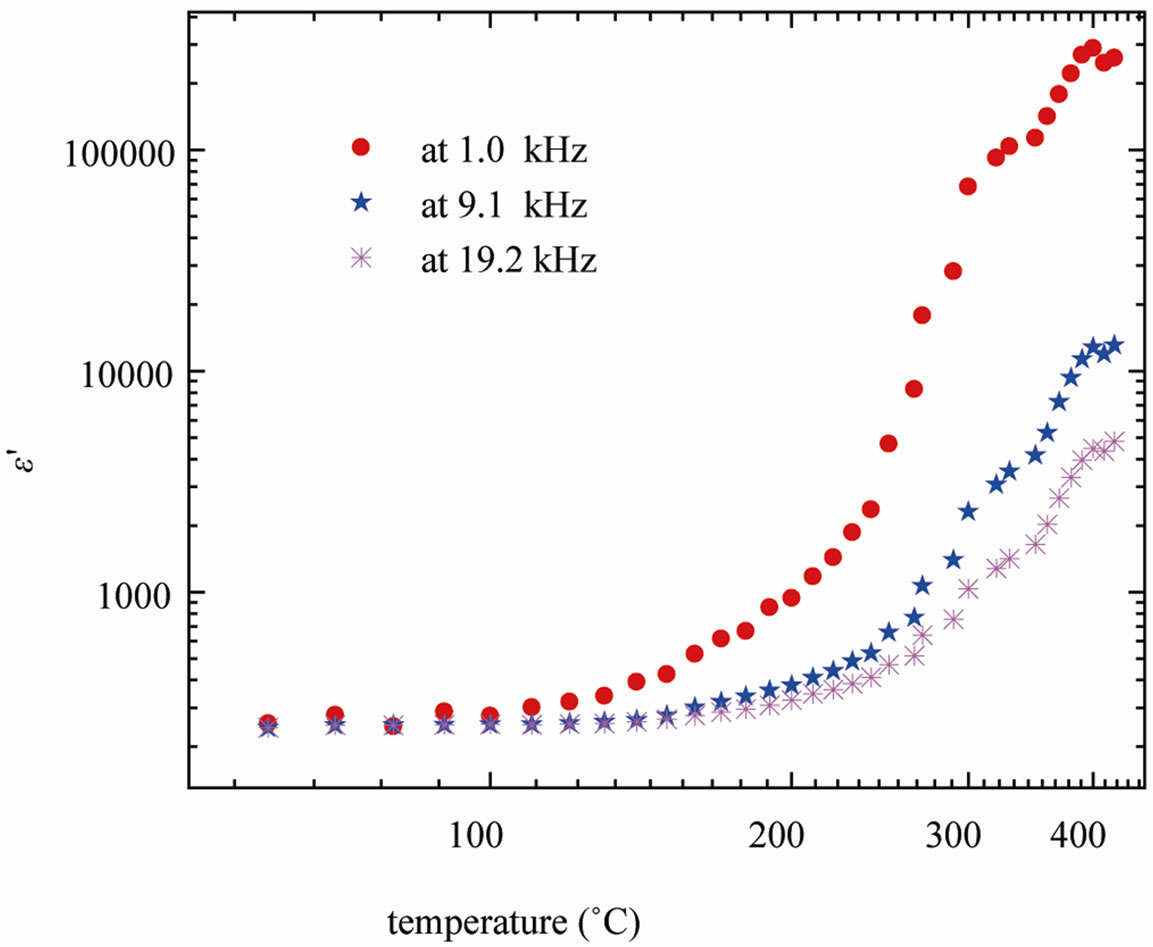
Figure 5. Variation of dielectric constant (ε¢) of SGN with temperature at selected frequencies.
mental temperature range [32].
Figure 6 shows the variation of loss tangent (tanδ) of SGN as a function of temperature at selected frequencies. It revealed 1) a peak in tanδ at a certain temperature for a particular frequency, 2) shift in the peak-temperature towards higher temperature side with rise in frequency, and 3) increase in the broadening of the peak with rise in frequency. It is clear from the figure that a temperature dependent dielectric relaxation is observed at the experimental frequencies (1, 9.1 and 19.2 kHz).
The variation of real (Z′) and imaginary (Z″) part of impedance with frequency at different temperatures is shown in Figure 7. A monotonous decrease in the real part of impedance with frequency up to near about 15 kHz, followed by a (nearly) constant value, was observed at all the temperatures. Similar behavior was found in the variation of Z″ with frequency. The merger/coincidence of the impedance (Z′) at higher frequencies for all the temperatures indicates a possible release of space charge polarization at high temperatures and frequencies.
Complex impedance spectroscopy is a technique that enables us to separate the real and imaginary component of the complex electrical parameters so as to get the true picture of material properties. It is used to characterize microstructural and electrical properties of some electronic and/or ionic materials. Generally, the impedance properties of materials arise due to intragrain, intergrain and electrode processes. The motion of charges could occur in a number of ways: 1) dipole reorientation, 2) space charge formalism and 3) charge displacement. Thus, the complex impedance formalism allows for a direct separation of the bulk, grain boundary and the electrode phenomena.
The plot of the imaginary (Z″) versus real (Z′) parts of the complex impedance (Cole-Cole plot) at temperature 150˚C is shown in Figure 8. For a bulk crystal contain-
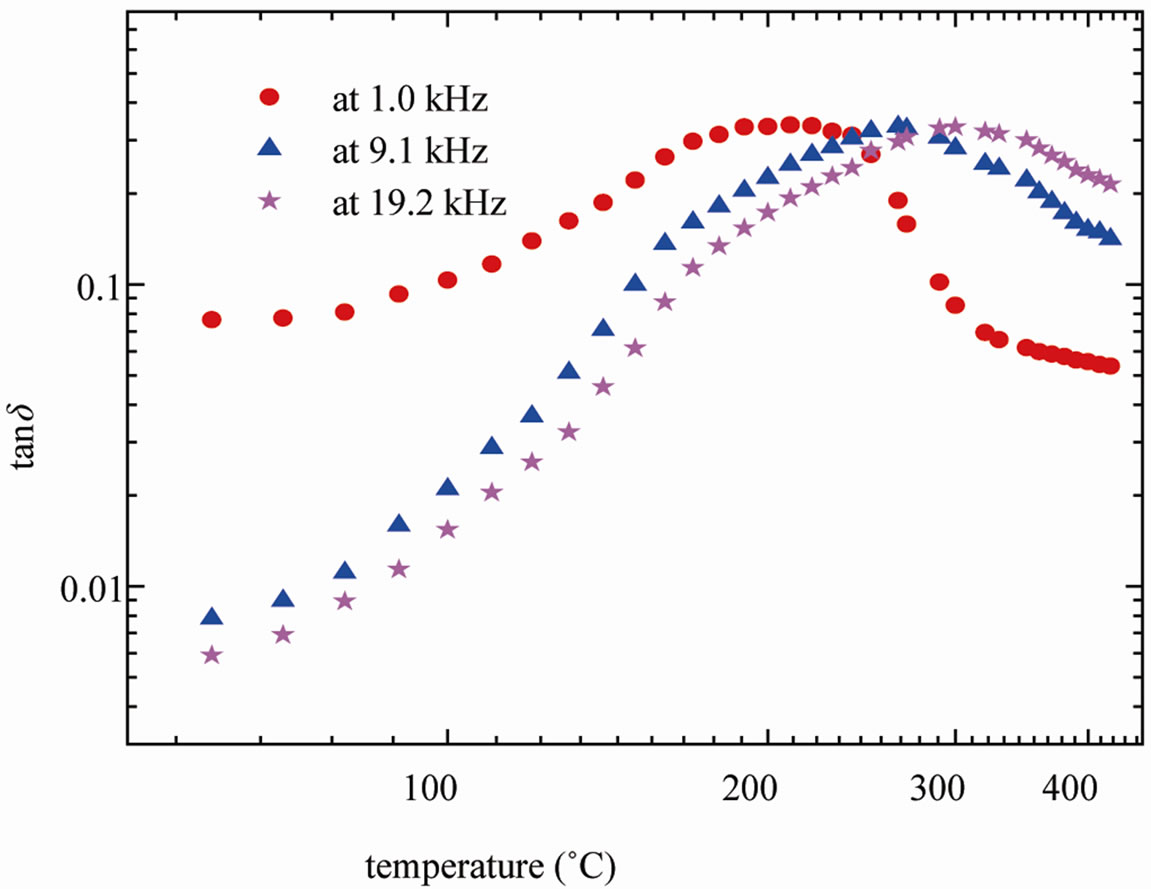
Figure 6. dielectric loss (tanδ) of SGN with temperature at selected frequencies.
ing interfacial boundary layer (grain-boundary), the equivalent circuit may be considered as two parallel RC elements connected in series (inset of Figure 8) and gives rise to two arcs in complex plane, one for bulk crystal (grain) and the other for the interfacial boundary (grainboundary) response [12]. The real (Z¢) and imaginary (Z″) part of total impedance of the equivalent circuit are defined as [33].
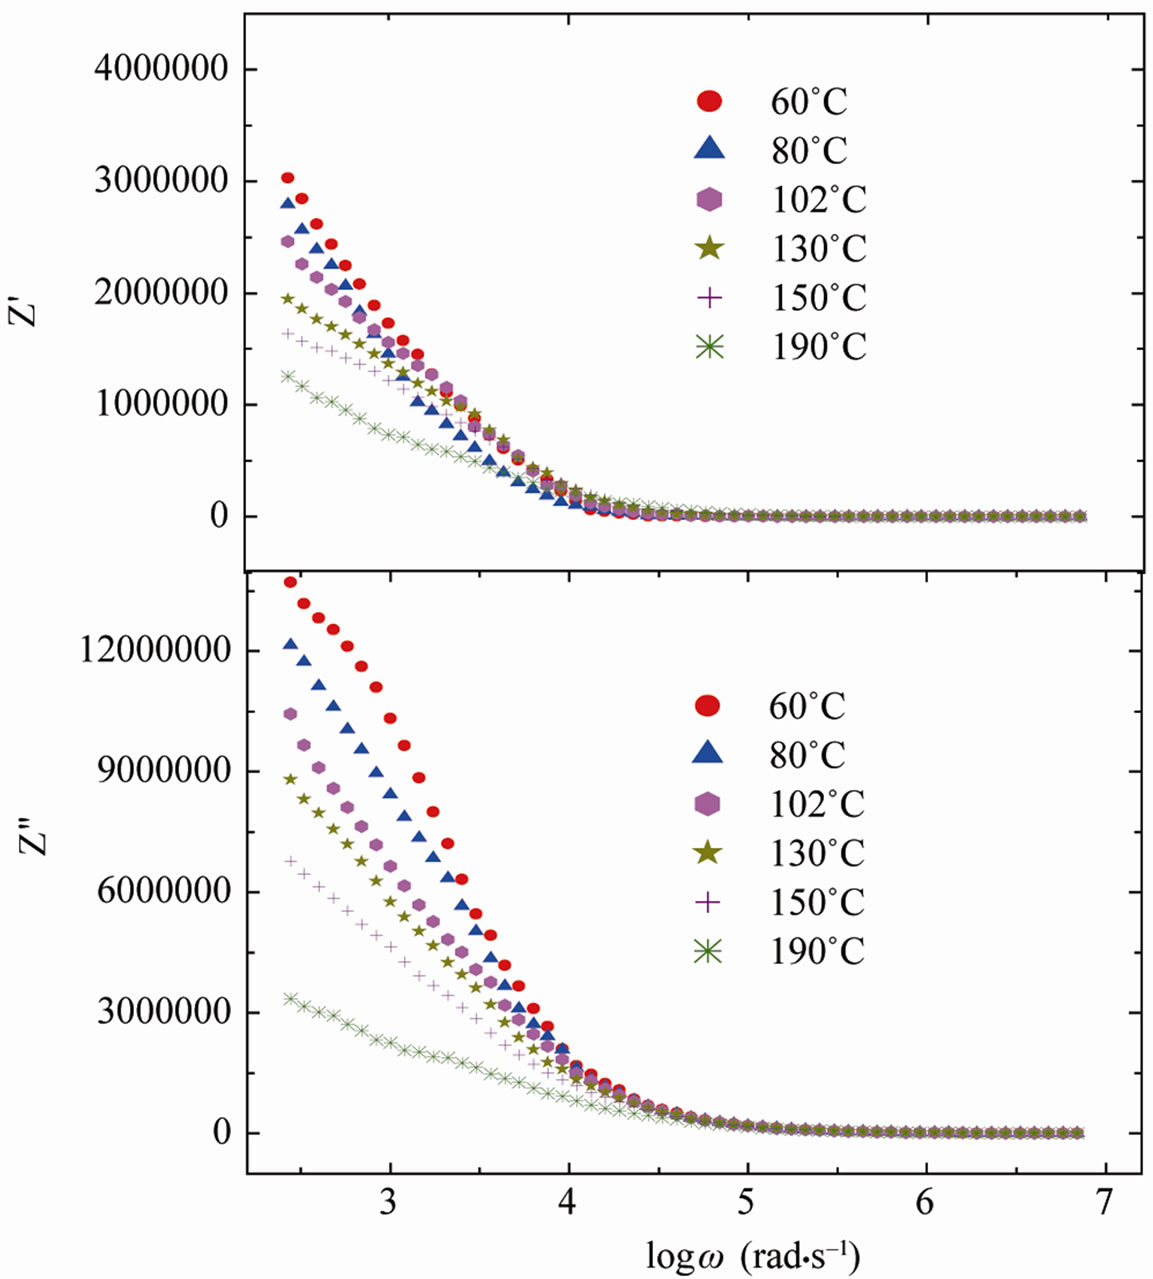
Figure 7. Plots of Z′ and Z″ with frequency at different temperatures of SGN.
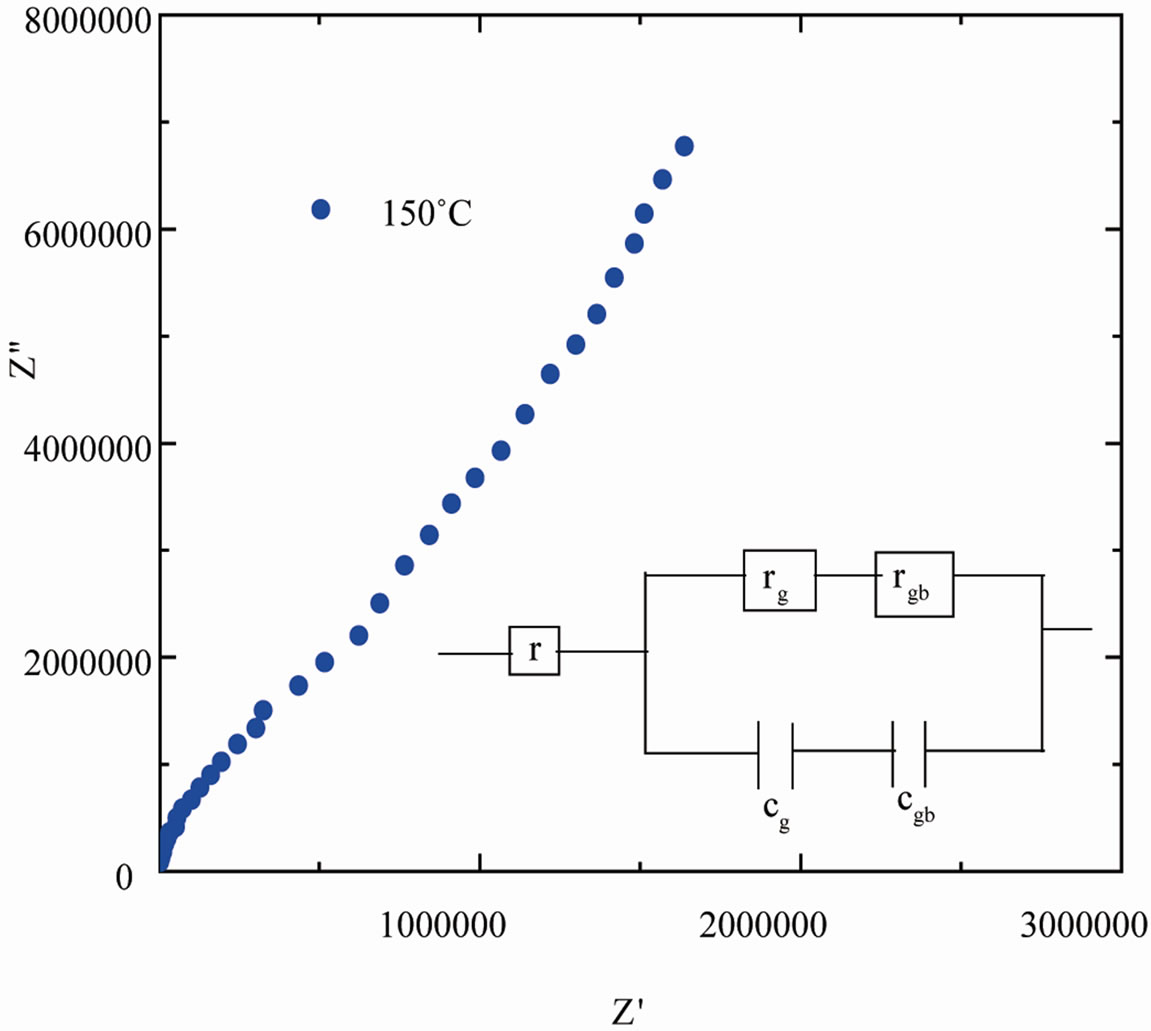
Figure 8. Complex plane impedance plot of SGN at 150˚C and parallel RC equivalent circuit (inset).
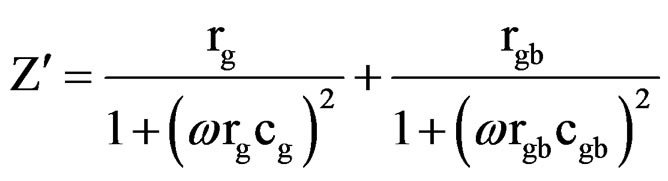 (1)
(1)
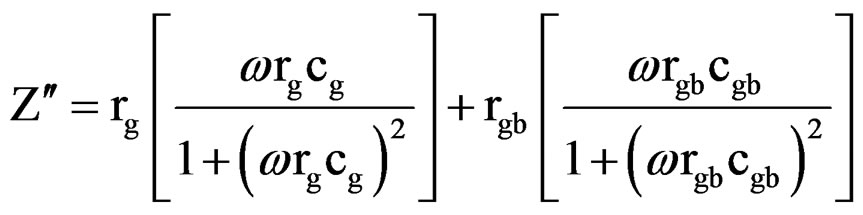 (2)
(2)
where rg, cg are the bulk (grain) resistance and capacitance respectively and rgb, cgb are the corresponding quantities for interfacial boundary (grain boundary). The relative position of the two arcs in a complex plane can be identified by the frequency. The arc of bulk generally lies on the frequency range higher than that of interfacial boundary since the relaxation time  for the interfacial boundary is much larger than that for the bulk crystal. Hence, when the bulk resistance (rg) is much lower and the resistance in the equivalent circuit is dominated by the interfacial boundary resistance (rgb), the arc of bulk (grain) may be masked in the limited frequency range.
Advantage of complex electric modulus formalism is that it can easily distinguish electrode polarization effect from grain boundary conduction process. It is also useful in detecting bulk properties as apparent conductivity relaxation times [34,35].
The complex impedance modulus (M*(ω)) has been calculated from the impedance data using the following relations:
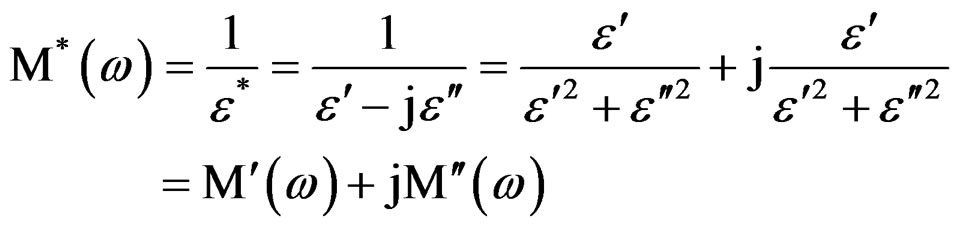 (3)
(3)
where M′ is the real and M″ the imaginary electric modulus, and ε′ the real and ε″ the imaginary permittivity.
Figure 9 shows the angular frequency dependence of M′(ω) and M″(ω) for SGN as a function of temperature. M′(ω) shows a dispersion tending towards M∞ (the asymptotic value of M′(ω) at higher frequencies in Figure 9(a), while M″(ω) exhibits a maximum ( ) centered at the dispersion region of M′(ω). In Figure 9(b) the position of the peak
  shifts to higher frequencies as the temperature is increased. The frequency region below peak maximum M″ determines the range in which charge carriers are mobile on long distances. At frequency above peak maximum M″ the carriers are confined to potential wells, being mobile on short distances.
The most probable relaxation time follows the Arrhenius law given by
 (4)
(4)
where ω0 is the pre-exponential factor and Ea is the activation energy. A plot of logω vs.  is shown in Figure 10, where the symbols are the experimental data points and the solid line is the least squares straight line fit to the data.
Using Equation (4), the calculated value of the activtion energy Ea of the sample was found to be ~0.18 eV.
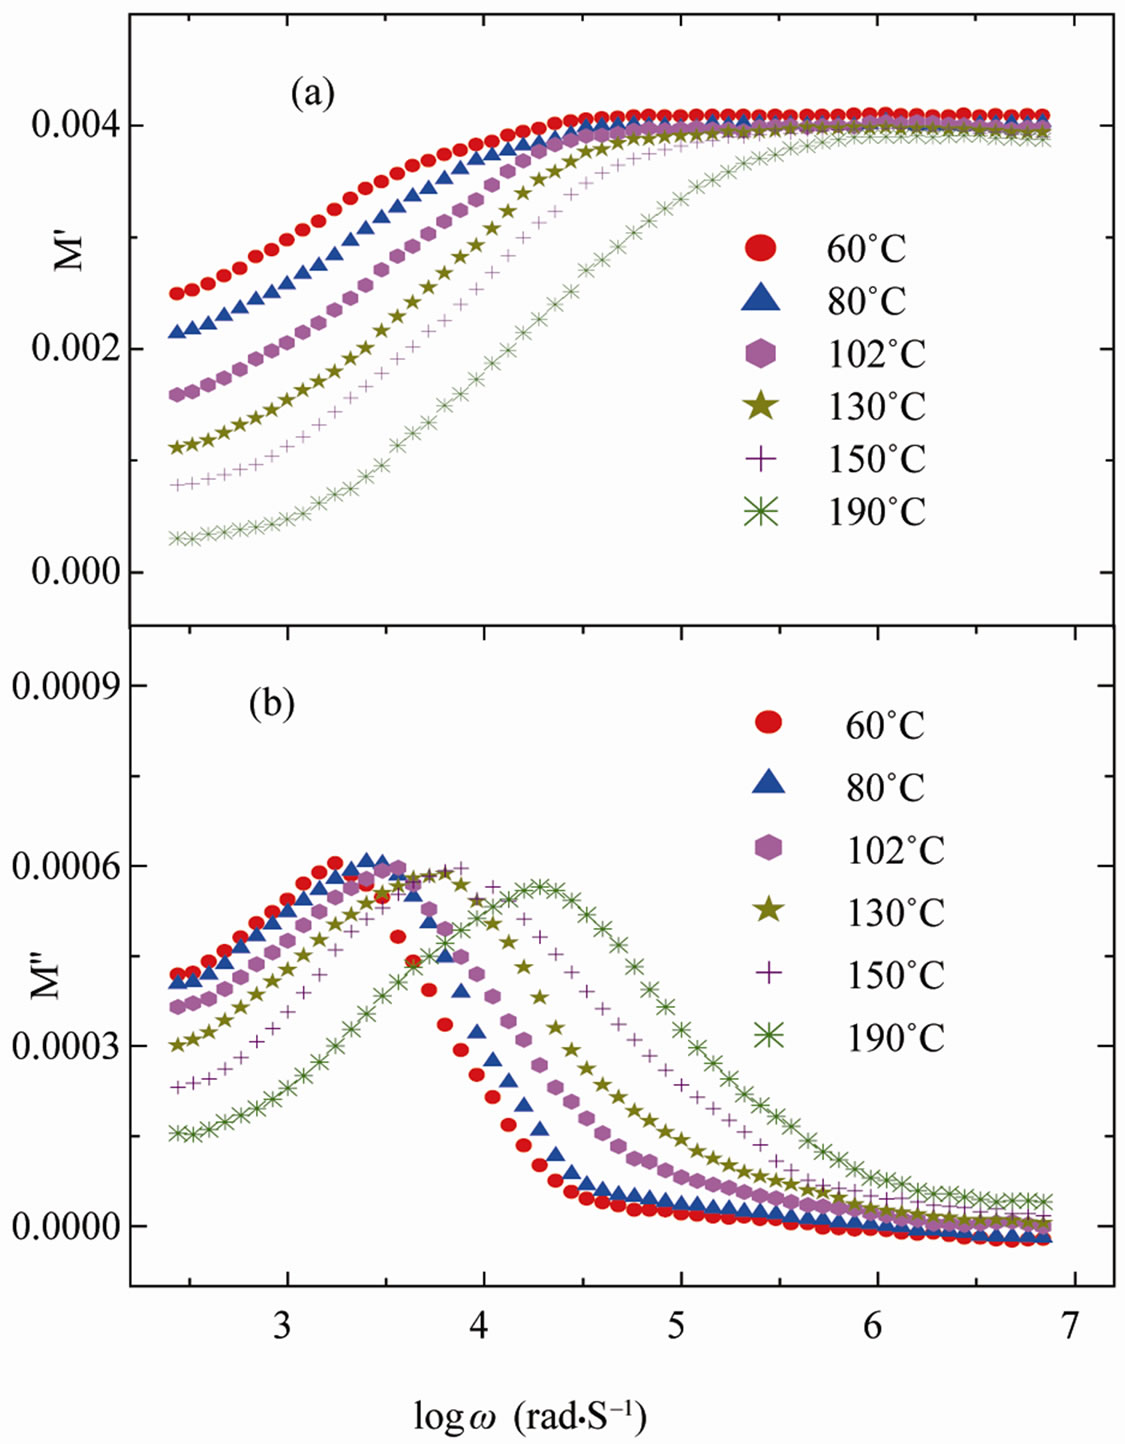
Figure 9. Logarithmic angular frequency dependence of M¢ (a) and M″ (b) of Sr(Gd0.5Nb0.5)O3, SGN at various temperatures.
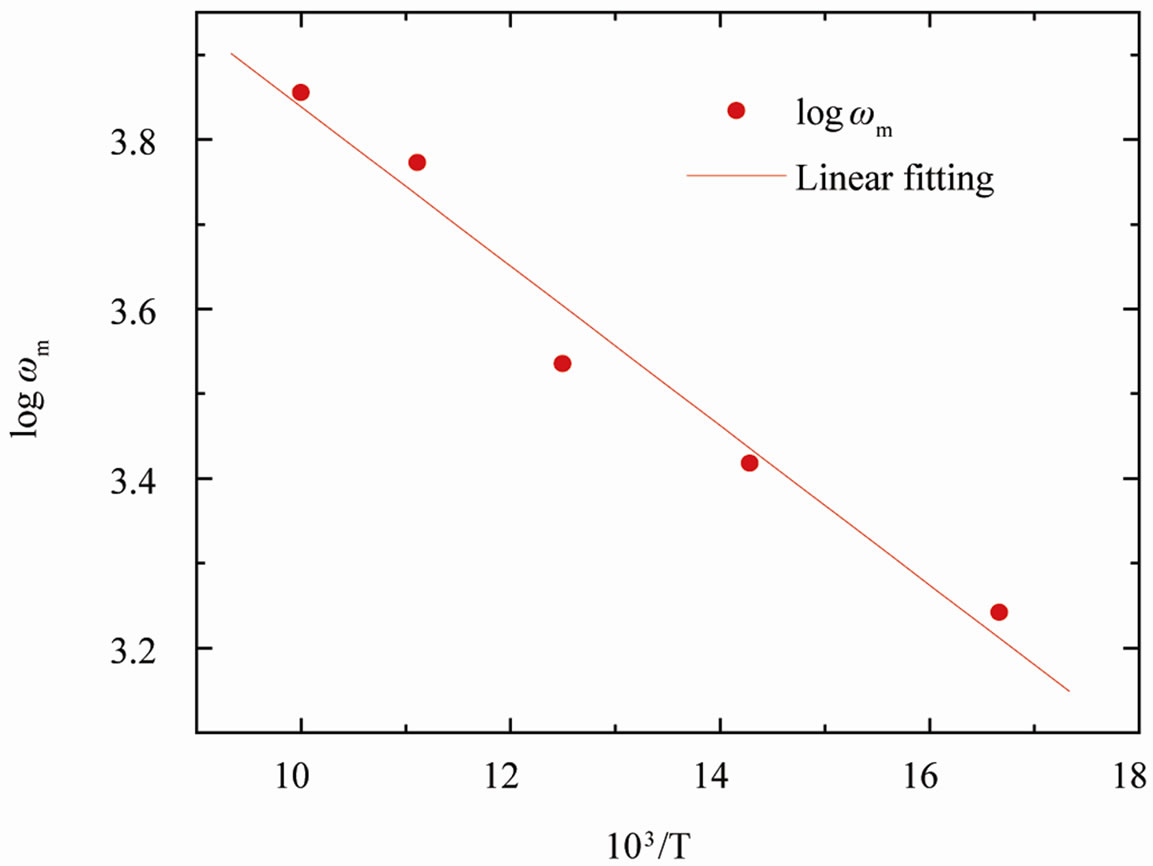
Figure 10. The Arrhenius plot of wm corresponding to M″ for SGN, where symbols are the experimental points and the solid line is the least squares fit to the experimental data.
The low value of activation energy (~0.18 eV), may be due to the single ionized oxygen vacancies. Therefore, the role of the mixed ionic-polaronic conductivity is realized, since it includes the charge carriers generated from the vacancies. In addition, a collective motion of oxygen ions and vacancies play important role in the conduction process [36,37].
Conductivity analysis provides significant information related to transport of charge carriers, i.e., electron/holes or cations/anions that predominate the conduction process and their response as a function of temperature and frequency. If we assumes that all dielectric loss in the temperature range studied are due to conductivity, the conductivity can be expressed as σ(ω) = ωε0ε″, here σ is the real part of the conductivity and ε″ is the imaginary part of complex dielectric permittivity (ε*).
The frequency spectra of the conductivity for SGN at different measuring temperatures are shown in Figure 11. The conductivity shows dispersion which shifts to higher frequency side with the increase of temperature. It is seen from figure that logsac decreases with decreasing frequency but at higher temperature (200˚C), it is observed that logsac becomes independent of frequency after a certain value. Extrapolation of this part towards lower frequency will give sdc. The very basic fact about AC conductivity in SGN is that s is an increasing function of frequency. The real parts of conductivity spectra can be explained by the power law define as [38]
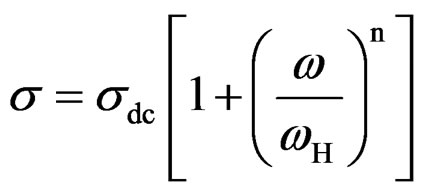 (5)
(5)
where sdc is the DC conductivity, ωH is the hopping frequency of the charge carriers, and n is the dimensionless

Figure 11. Logarithmic angular frequency dependence of conductivity (logsac) for Sr(Gd0.5Nb0.5)O3 at various temperatures.
frequency exponent.
4. Conclusion
The frequency-dependent dielectric dispersion of polycrystalline Sr(Gd0.5Nb0.5)O3, (SGN) ceramic synthesized by a high-temperature solid-state reaction technique is investigated in the temperature range from 60˚C to 420˚C for the first time. The increasing dielectric constant (ε′) with increasing temperature is attributed to the conductivity which is directly related to an increase in mobility of localized charge carriers. The logarithmic angular frequency dependence of the electric modulus loss peak (logwm vs. M″) is found to obey the Arrhenius law with activation energy of ~0.18 eV. The frequency-dependent electrical data are also analyzed in the framework of conductivity and modulus formalisms.
REFERENCES
- M. E. Lines and A. M. Glass, “Principles and Applications of Ferroelectrics and Related Materials,” Clarendon, Oxford, 2001.
- J. F. Scott, “Ferroelectric Memories,” Springer, Berlin, 2000.
- O. Auciello, J. F. Scott and R. Ramesh, “The Physics of Ferroelectric Memories,” Physics Today, vol. 51, No. 7, 1998, p. 22. doi:10.1063/1.882324
- A. K. Singh, S. K. Barik, R. N. P. Choudhary and P. K. Mahapatra, “Ac conductivity and Relaxation Mechanism in Ba0.9Sr0.1TiO3,” Journal of Alloys and Compounds, vol. 479, No. 1-2, 2009, pp. 39-42. doi:10.1016/j.jallcom.2008.12.130
- F. Galasso and J. Pyle, “Ordering in Compounds of the A(B'0.33Ta0.67)O3 Type,” Inorganic Chemistry, vol. 2, No. 3, 1963, pp. 482-484. doi:10.1021/ic50007a013
- F. Galasso and J. Pinto, “Growth of Single Crystals of Ba(B′0.33Ta0.67)O3 Perovskite-type Compounds,” Nature, vol. 207, 1965, pp. 70-72. doi:10.1038/207070b0
- E. L. Colla, I. M. Reaney and N. Setter, “Effect of Structural Changes in Complex perovskite on the Temperature Coefficient of the Relative Permittivity,” Journal of Applied Physics, vol. 74, No. 5, 1993, pp. 3414-3425. doi:10.1063/1.354569
- M. Onada, J. Kuwata, K. Toyama and S. Nomura, “Ba (Zn1/3Nb2/3O3-Sr(Zn1/3Nb2/3)O3, Solid Solution Ceramics with Temperature Stable High Dielectric Constant and Low Microwave Loss,” Japanese Journal of Applied Physics, vol. 21, 1982, pp. 1707-1710. doi:10.1143/JJAP.21.1707
- E. Graado, O. Moreno, A. Gracia, J. A. Sanjurjo, C. Rettori, I. Torriani, S. Oseroff, J. J. Neumeier, K. J. McClallan, S. W. Cheong and Y. Tokura, “Phonon Raman Scattering in R1-xAxMnO3+δ (R = La, Pr; A = Ca, Sr),” Physical Review B, vol. 58, No. 17, 1998, pp. 11435-11440. doi:10.1103/PhysRevB.58.11435
- N. Ortega, A. Kumar, P. Bhattacharya, S. B. Majumder and R. S. Katiyar, “Impedance spectroscopy of multiferroic PbZrxTi1−xO3/CoFe2O4 Layered Thin Films,” Physical Review B, vol. 77, No. 1, pp. 14111-14120. doi:10.1103/PhysRevB.77.014111
- D. Perez-Coll, D. Marrero-Lopez, P. Nunez, S. Pinol and J. R. Frade, “Grain Boundary Conductivity of Ce0.8Ln0.2 O2-δ Ceramics (Ln = Y, La, Gd, Sm) with and without Co-doping,” Electrochimica Acta, vol. 51, No. 28, 2006, pp. 6463-6469. doi:10.1016/j.electacta.2006.04.032
- S. Saha and T. P. Sinha, “Dielectric relaxation in SrFe1/2 Nb1/2O3,” Journal of Applied Physics, vol. 99, No. 1, 2006, Article ID: 014109. doi:10.1063/1.2160712
- A. Shukla, R. N. P. Choudhary and A. K. Thakur, “Thermal, structural and Complex Impedance Analysis of Mn4+ modified BaTiO3 electroceramic,” Journal of Physics and Chemistry of Solids, vol. 70, No. 11, 2009, pp. 1401-1407. doi:10.1016/j.jpcs.2009.08.015
- R. J. Cava, “Dielectric materials for applications in microwavecommunications,” Journal of Materials Chemistry, vol. 11, No. 1, 2001, pp. 54-62. doi:10.1039/b003681l
- U. Intatha, S. Eitssayeam, K. Pengpat, J. D. MacKenzie and T. T. Kenneth, “Dielectric properties of Low Temperature Sintered LiF doped BaFe0.5Nb0.5O3,” Materials Letters, vol. 61, No. 1, 2007, pp. 196-200. doi:10.1016/j.matlet.2006.04.030
- F. Roulland, R. Terras, G. Allainmat, M. Pollet and S. Marinel, “Lowering of BaB'1/3B''2/3 Complex Perovskite Sintering Temperature by Lithium Salt Additin,” Journal of the European Ceramic Society, vol. 24, No. 6, 2004, pp. 1019-1023. doi:10.1016/S0955-2219(03)00553-3
- S. Priya, A. Ando and Y. Sakebe, “Non-lead Perovskite materials Ba(Li1/4Nb3/4)O3 and Ba(Cu1/3Nb2/3)O3,” Journal of Applied Physics, vol. 94, No. 2, 2003, pp. 1171- 1177. doi:10.1063/1.1585121
- I. Levin, J. Y. Chan, J. E. Maslar and T. A. Vanderah, “Phase transitions and Microwave Dielectric Properties in the Perovskite-Like Ca(Al0.5Nb0.5)O3-CaTiO3 system,” Journal of Applied Physics, vol. 90, No. 2, 2001, pp. 904- 914. doi:10.1063/1.1373705
- R. Zurmuhlen, J. Petzelt, S. Kamba, V. V. Voitsekhovskii, E. Colla and N. Setter, “Dielectric materials for Wireless Communication,” Journal of Applied Physics, vol. 77, 1995, p. 5341.
- R. Zurmuhlen, J. Petzelt, S. Kamba, G. Kozlov, A. Volkov, B. Gorshunov, D. Dube, A. Tagantsev and N. Setter, “Dielectric spectroscopy of Ba(B1/2'B1/2'')O3 complex Perovskite Ceramics: Correlations between Ionic Parameters and Microwave Dielectric Properties. II. Studies below the Phonon Eigenfrequencies (102 - 1012 Hz),” Journal of Applied Physics, vol. 77, No. 10, 1995, pp. 5351- 5364. doi:10.1063/1.359290
- S. Saha and T. P. Sinha, “Structural and Dielectric Studies of Ba(Fe0.5Nb0.5)O3,” Journal of Physics: Condensed Matter, vol. 14, No. 2, 2002, pp. 249-258. doi:10.1088/0953-8984/14/2/311
- N. K. Singh, P. Kumar, H. Kumar and R. Rai, “Structural and Dielectric Properties of Dy2(Ba0.5R0.5)2O7 (R = W, Mo) ceramics,” Advanced Materials Letters, vol. 1, 2010, pp. 79-82. doi:10.5185/amlett.2010.3102
- N. K. Singh, P. Kumar, O. P. Roy and R. Rai, “Structural, and Dielectric Properties of Eu2(B'0.5 B''0.5)2O7 (B' = Ba; B'' = Mo, W) Ceramics,” Journal of Alloys and Compounds, vol. 507, No. 2, 2010, pp. 542-546. doi:10.1016/j.jallcom.2010.08.015
- N. K. Singh, R. N. P. Choudhary and B. Banarji, “Dielectric and Electrical Characteristics of Nd2(Ba0.5R0.5)2O7 (R = W, Mo) ceramics,” Physica B: Condensed Matter, vol. 403, No. 10-11, 2008, pp. 1673-1677. doi:10.1016/j.physb.2007.09.083
- P. Kumar, B. P. Singh, T. P. Sinha and N. K. Singh, “Ac conductivity and Dielectric relaxation in Ba(Sm1/2Nb1/2) O3, ceramic,” Physica B: Condensed Matter, vol. 406, No. 2, 2011, pp. 139-143. doi:10.1016/j.physb.2010.09.019
- N. K. Singh, P. Kumar and R. Rai, “Study of Structural, Dielectric and Electrical Behavior of (1−x)Ba(Fe0.5Nb0.5) O3–xSrTiO3 ceramics,” Journal of Alloys and Compounds, vol. 509, No. 6, 2011. pp. 2957-2963. doi:10.1016/j.jallcom.2010.11.168
- P. Kumar, B. P. Singh, T. P. Sinha and N. K. Singh, “Xray and Electrical Properties of Ba(Gd0.5Nb0.5)O3 ceramic,” Advanced Materials Letters, Vol. 2, No. 1, 2011, p. 76. doi:10.5185/amlett.2010.11176
- N. K. Singh, P. Kumar and R. Rai, “Comparative study of Structure, Dielectric and Electrical Behavior of Ba (Fe0.5Nb0.5)O3 ceramics and Their Solid Solutions with BaTiO3,” Advanced Materials Letters, Vol. 2, No. 3, 2011, pp. 200-205. doi:10.5185/amlett.2010.11178
- N. K. Singh and P. Kumar, “Studies of structural and electrical behavior of Samarium Barium Tungstate Ceramics,” Journal of Advanced Dielectrics, Vol. 1, No. 4, 2011, pp. 465-470. doi:10.1142/S2010135X11000495
- N. K. Singh, P. Kumar, A. K. Sharma and R. N. P. Choudhary, “Structural and Impedance Spectroscopy Studies of Ba(Fe0.5Nb0.5)O3-SrTiO3 Ceramic System,” Materials Science and Applications, Vol. 2, 2011, pp. 1593-1600. doi:10.4236/msa.2011.211213
- D. K. Mahato, A. Dutta and T. P. Sinha, “Dielectric relaxation and ac conductivity of Double Perovskite Oxide Ho2ZnZrO6,” Physica B: Condensed Matter, Vol. 406, No. 13, 2011, pp. 2703-2708. doi:10.1016/j.physb.2011.04.012
- R. N. P. Choudhary, D. K. Pradhan, C. M. Tirado, G. E. Bonilla and R. S. Katiyar, “Structural, dielectric and impedance properties of Ca(Fe2/3W1/3)O3 nanoceramics,” Physica B, vol. 393, No. 1-2, 2007, pp. 24-31. doi:10.1016/j.physb.2006.12.006
- A. Dutta, C. Bharti and T. P. Sinha, “AC conductivity and Dielectric Relaxation in CaMg1/3Nb2/3O3,” Materials Research Bulletin, vol. 43, No. 5, 2008, pp. 1246-1254. doi:10.1016/j.materresbull.2007.05.023
- D. C. Sinclair and A. R. West, “Impedance and modulus Spectroscopy of semiconducting BaTiO3 Showing Positive Temperature Coefficient of resistance,” Journal of Applied Physics, vol. 66, No. 8, 1989, pp. 3850-3856. doi:10.1063/1.344049
- I. M. Hodge, M. D. Ingram and A. R.West, “A New Method for analysing the a.c. behaviour of Polycrystalline Solid Electrolytes,” Journal of Electroanalytical Chemistry and Interfacial Electrochemistry, vol. 58, No. 2, 1975, pp. 429-432. doi:10.1016/S0022-0728(75)80102-1
- G. Deng, G. Li, A. Ding and Q. Yin, “Evidence for oxygen Vacancy Including Spontaneous Normal-Relaxor Transition in Complex Perovskite Ferroelectrics,” Applied Physics Letters, vol. 87, No. 192, 2005, p. 905.
- A. Molak, E. Talik, M. Kruczek, M. Plauch, A. Ratuszna and Z. Ujma, “Characterisation of Pb(Mn1/3Nb2/3)O3 ceramics by SEM, XRD, XPS and Dielectric Permittivity Tests,” Materials Science and Engineering: B, vol. 128, No. 1-3, 2006, pp. 16-24. doi:10.1016/j.mseb.2005.11.011
- E. F. Hairetdinov, N. F. Uvarov, H. K. Patel and S. W. Martin, “ Estimation of the Free Charge Carrier Concentration in fast Ion Conducting Na2Sb2S3 glasses from an analysis of the Frequency Dependent Conductivity,” Physical Review B, vol. 50, No. 18, 1994, pp. 13259-13266. doi:10.1103/PhysRevB.50.13259
NOTES
*Corresponding author.