Modern Economy
Vol.5 No.5(2014), Article ID:46069,14 pages DOI:10.4236/me.2014.55048
Exponential GARCH Modelling of the Inflation-Inflation Uncertainty Relationship for Ghana
Alfred Barimah
Department of Economics, University of Ghana, Legon, Ghana
Email: alfredbarimah@yahoo.com
Copyright © 2014 by author and Scientific Research Publishing Inc.
This work is licensed under the Creative Commons Attribution International License (CC BY).
http://creativecommons.org/licenses/by/4.0/


Received 31 March 2014; revised 30 April 2014; accepted 10 May 2014
ABSTRACT
This study examines the asymmetric effects of inflation on inflation uncertainty in Ghana for the period 1963:4 to 2014:2. Exponential Generalized Autoregressive Heteroscedasticity (EGARCH) model is employed on monthly inflation rates to estimate inflation uncertainty. Two complementary approaches are used to determine the empirical relationship between inflation and its uncertainty. In the first approach, inflation dummy is included in the variance equation and in the second, we employ the two-step procedure in which Granger causality test is performed on the monthly inflation rates and the conditional variance generated from the EGARCH model. We find strong support for both Friedman-Ball and Cukierman-Meltzer hypotheses for the full sample as well as the inflation targeting period. Given the current build-up in inflationary pressures in Ghana, our results warn of possible costs of not keeping inflation in check. The major policy implication that follows from this study is that the Bank of Ghana should strive to minimize the gap between actual and target inflation levels so the public will have consistent belief in all announced policy targets.
Keywords:Inflation Uncertainty, EGARCH, Friedman-Ball Hypothesis, Cukierman-Meltzer Hypothesis

1. Introduction
Inflation and its associated costs have attracted considerable research attention by both economists and politicians because of their detrimental effects on economic activities. In economies with greater inflation uncertainty, risk-averse economic agents will attempt to protect their portfolios by shortening the duration of contracts to minimize the losses arising from shocks to inflation that are above their expectations [1] . Since saving and investing involve a contract of a kind, long-term economic growth is expected to be lower when economic agents decide to reduce their savings and investment when faced with greater inflation uncertainty. Thus, as inflation becomes highly unpredictable, saving, investment and growth of real output suffers. By imposing costs on economic agents who strive to extract the correct signal about relative from absolute prices, real time is devoted to unproductive economic ventures [2] .
On the relationship between inflation and inflation uncertainty, Friedman [1] and Okun [3] postulate that increases in inflation may encourage an unpredictable policy response by the monetary authority which accordingly causes more uncertainty about the future rate of inflation. This observation is premised on the empirical regularity that an inflationary economy creates an environment in which major policy changes become more likely and the effects of such policy changes become uncertain. In a developing country like Ghana where there is no perfect indexation of contracts, inflation and uncertainty can have real negative effects on aggregate economic activity. It is thus of utmost importance to determine the extent to which inflation uncertainty is affected by inflation.
In Ghana, the period 1973-1984 was characterised by far the most volatile inflation hikes due largely to myriad of factors including various negative shocks and the expansionary aggregate demand policies that disregarded the government budget constraint. It is therefore not surprising that the inflationary effects of the higher fiscal deficits manifested in the highest ever inflation rate of 174% in June 1983. The chronic and fluctuating inflation the country experienced in this period meant that the business environment was entangled in high uncertainty.
With the inception of Economic Recovery Programme (ERP) in 1983 and Structural Adjustment Programme (SAP) in 1986, the huge inflation hikes witnessed over the pre-ERP period were largely removed. Even though the actual inflation outturn during the post-ERP period came nowhere near the targets that were set for each fiscal year, the removal of the wide fluctuations in the inflation rate was instrumental in reducing average monthly inflation and its standard deviation to 1.79% and 2.24% respectively (Table 1).
Beginning from May 2007 when Ghana formally adopted inflation targeting (IT) as the main monetary policy thrust, average monthly inflation and its standard deviation have followed a downward trend to reach all-time lows of 1.03% and 1.23% respectively. Over the same period too, the deviation of inflation from its growth maximizing level of 9% has been less than four percentage points, which is by far less than the 25 percent value that prevailed in the ERP period1. While not analysing the determinants of inflation over the period 1963-2014, it is important to ascertain how inflation uncertainty, which is one of the costs of inflation, varies with the differing inflation rates over the pre-ERP, post-ERP and IT periods. The main purpose of this study is to examine the varying volatility dynamics of monthly inflation series in Ghana over the period 1963:04-2014:02. In order to determine which inflation uncertainty hypothesis (Friedman-Ball or Cukierman-Meltzer) holds for the Ghanaian inflation data, we generate a measure of monthly inflation uncertainty and investigate the causality relationships between inflation and inflation uncertainty for the full sample period (1963:04-2014:02) and the IT period (2007:06-2014:02).

Table 1. Inflationary trend for sub-periods.
Although the literature on the EGARCH models is quite extensive [5] -[7] , to our knowledge, no paper has yet examined inflation uncertainty in Ghana using this method. The EGARCH model is more applicable because the inflation data reveal that the number of times the monthly inflation rate has increased over the adjacent month’s rate is not statistically different from the number of months it has decreased over the adjacent month’s rate. These numbers are 310 months and 301 months respectively when inflation rate is calculated on month-onmonth basis (Table 2, rows 1 and 2 respectively)2. A similar trend is observed when the year-on-year calculation is used (288 verses 312). Given that the monthly inflation rate has been changing in both directions, it remains to be determined if inflation uncertainty is affected differently by positive and negative changes in the inflation rate. The main objective of the paper is therefore to ascertain whether inflation uncertainty is asymmetric to positive and negative changes in inflation.
As the first paper to measure and analyze asymmetric effects of inflation on inflation uncertainty in Ghana using an EGARCH model, our paper also makes several contributions to the literature. First, our datasets span 611 months (i.e. 51 years—1963:04-2014:02). As far as we know there is no study in the inflation-inflation uncertainty literature that uses the inflation data for this extended period of time—our paper’s conclusions will thus be applicable to all periods when large or small swings in the inflation rate have effects on inflation uncertainty. Second, we also control for seasonal effects in our inflation series by explicitly including seasonal terms in the conditional mean equation and finally, the issue of whether inflation uncertainty is low under the IT period is investigated for the sub-period 2007:06-2014:02. The rest of the paper is organized as follows. Section 2 provides a brief review of the theoretical and empirical literature on the inflation-inflation uncertainty nexus. The methodology, the description of the data and the time series properties of the data are provided in Section 3. Section 4 contains the estimation results, and finally, Section 5 concludes.
2. Literature Review
The relationship between inflation and inflation uncertainty, and their effect on the real sector have been given great enormous research efforts. This is due to the fact that persistent inflation makes the value of future nominal payments uncertain. Thus, much of the observed reduction in consumption, investment and economy growth in countries suffering from high inflation volatility could be attributed to inflation uncertainty [8] .
Regarding the relationship that exists between inflation and its uncertainty, four hypotheses offer competing explanations. These hypotheses are 1) the Friedman-Ball hypothesis [1] [9] , 2) the Cukierman and Meltzer hypothesis [10] [11] , 3) the Pourgerami and Maskus hypothesis [12] and 4) the Holland hypothesis [13] .
The Friedman-Ball hypothesis predicts that causality runs from inflation to inflation uncertainty and in the Cukierman and Meltzer hypothesis causality runs from inflation variability to higher inflation. There are also the “Pourgerami and Maskus” and “Holland” hypotheses that reject the harmful effect high inflation has on the predictability of prices so a negative relation between inflation and inflation uncertainty is thus postulated. As a means to minimize prediction errors in periods of high inflation, Pourgerami and Maskus [12] argue that rational economic agents invest in forecasting models that make use of all available information. Therefore, with rising inflation, agents may forecast inflation better due to the improved prediction capacity so inflation uncertainty would be expected to be lower. Similarly, Pourgerami and Maskus [12] assert that higher inflation variability lowers inflation due to the stabilization motives of policymakers. In the “Stabilizing Fed hypothesis”, Holland assumes that because central banks have the singular mandate to achieve price satiability, all available contractionary monetary policy tools are employed in high inflationary periods in order to reduce the welfare costs high
Table 2. Frequency of inflation changes.
inflation uncertainty imposes on the economy [13] .
In the empirical literature, the use of survey-based cross-sectional dispersion of individual forecasts and moving standard deviation of inflation to proxy inflation uncertainty has been discarded because of their inability to model inflation uncertainty as a time-varying process [14] . Autoregressive and Generalized autoregressive conditional heteroscadasticity (ARCH & GARCH) models estimate the time-dependent volatility as a function of observed prior volatility and several ARCH models have been introduced in the literature following the expository introduction by Eagle [15] . Some of these ARCH models include the Generalised ARCH (GARCH), Integrated GARCH (IGARCH), GARCH-Mean (GARCHM), exponential GARCH (EGARCH), component GARCH (CGARCH) and threshold ARCH (TARCH).
Applying GARCH models to datasets from various countries, the studies that have examined the linkages between inflation and inflation uncertainty can be grouped into those that support or reject the aforementioned hypotheses. Whilst majority of these studies support the Friedman-Ball Hypothesis much more than CukiermanMeltzer Hypothesis, there is very little support for the Pourgerami & Maskus and Holland Hypotheses.
By providing an explanation for the asymmetric relationship between inflation and inflation uncertainty, Caporale and Caporale [16] employed a TARCH model on monthly US inflation data for the period 1961:01- 2000:03 and conclude that negative inflationary shocks result in greater inflation uncertainty than positive shocks. For the UK, Kontonikas [17] uses inflation data spanning the 1972-2002 period to support FriedmanBall hypothesis. Upon controlling for the indirect effects of lower average inflation in the inflation targeting periods, it is found that the adoption of an explicit target eliminates inflation persistence and reduces long-run uncertainty.
Wilson [7] employed a bivariate EGARCH-M model on Japanese post-war data to investigate how inflation, inflation uncertainty and output growth are related. The key finding was that increases in inflation uncertainty increases with both higher average inflation and lower average growth. On whether the conditional variances of inflation and output growth are affected equally by positive and negative shocks, it is further established that negative shocks raise both inflation uncertainty and growth uncertainty more than positive shocks.
For the Turkish economy, Berument [6] modelled inflation uncertainty using EGARCH model on monthly CPI inflation over the period 1987:1 to 2007:5. By controlling explicitly for the seasonality effects in both the mean and volatility equations, it is established that monthly seasonality has a significant effect on inflation uncertainty, a conclusion which had not been previously derived from prior studies. The positive sign for the leverage term in the variance equations is interpreted to mean that positive shocks have greater effect on uncertainty rather than negative shocks with the same magnitude in Turkey.
Examining the asymmetric relationship between inflation and inflation uncertainty relationship for Iran, Pourshahabi et al. [18] utilise EGARCH model to show that shocks to inflation uncertainties do not rapidly vanish. Thus, positive shocks have a greater effect on uncertainty rather than negative shocks. Their Granger Causality test revealed that inflation Granger causes inflation uncertainty.
In a paper by Henry et al. [19] , the level and asymmetric effects of inflation on inflation volatility is tested for the G7 economies. While it is established that higher inflation rates induce greater inflation uncertainty for Canada, the US and UK, there was further evidence of asymmetric impact of inflation on inflation uncertainty for the UK and Canada. Fountas [20] employ a GARCH-in-Mean (GARCH-M) model in which the conditional variance equation is augmented with lagged inflation to provide support for the Cukierman-Meltzer hypothesis for 22 industrial countries. Contrary to popular belief that inflation uncertainty is growth-reducing, Fountas [20] finds no such effect for these industrialised countries.
For five MENA countries (Iran, Egypt, Morocco, Syria and Jordan), Samimi et al. [21] examined the inflation-inflation uncertainty nexus using monthly data spanning 1991:10 to 2010:5. Their results showed that there is an asymmetric relationship between inflation and inflation uncertainty for these countries. With the exception of Egypt, the Friedman-Ball hypothesis holds for all countries, that is, there was strong evidence that inflation uncertainty responds positively to changes in the rate of inflation.
Using EGARCH Model to establish the asymmetric relationship between inflation and uncertainty of inflation for South East Asian countries, Farhan et al. [22] confirm the Cukierman-Meltzer hypothesis for the period 1960-2010. For a group of emerging and developing countries which have moved away from monetary targeting to inflation targeting, Tas [23] demonstrates that inflation along with inflation uncertainty are significantly lower after these countries had adopted inflation targeting as the main monetary policy framework.
Using GARCH framework to examine the inflation-inflation uncertainty nexus for twenty two emerging economies spanning the period 1968-2010, Sintim-Aboagye et al. [24] take the unidirectional links that exist between inflation and uncertainty to conclude that the Friedman-Ball hypothesis holds in the short run for countries with high central bank independence. On the other hand, the low central bank independent countries display a bi-directional causal links in the short run, thus providing support for both the Friedman-Ball and Cukierman-Meltzer hypothesis. In the long run however, both low and high independent central bank countries either separately or jointly provided significant evidence that supported the Friedman-Ball hypothesis. Their empirical investigation suggests that the degree of central bank independence does not determine the applicability of the Friedman-Ball hypothesis. Rather, the determining factor is the time span; the Friedman-Ball hypothesis is discernible only in the long run.
By employing exponential GARCH models and impulse-response functions, Hegerty [25] uses monthly data from 1976 to 2011 to examine inflation and inflation uncertainty links for nine Sub-Sahara African countries (that is, Burkina Faso, Botswana, Cote d’Ivoire, Ethiopia, Gambia, Kenya, Nigeria, Niger and South Africa). Inflation increases are found to raise inflation uncertainty in all countries, while reverse causality running from inflation uncertainty to inflation was found for half of the countries (that is, Burkina Faso, Gambia, Kenya and Nigeria). Also, multi-country Granger causality tests suggest that regional spill-overs are weak except for South Africa and country pairs such as Burkina Faso and Cote d’Ivoire.
Barimah and Amuakwa-Mensah [8] examine the relationship between inflation and inflation uncertainty in Ghana from 1964 to 2012. By using AR (3)-GARCH (1, 2)-M model on year-on-year inflation rates, two main results followed from their paper. First, there is strong statistical support for the Friedman-Ball hypothesis in that inflation significantly raises inflation uncertainty in Ghana over the full sample period and two sub-periods at different lag lengths. Second, the evidence that inflation uncertainty affect inflation was found at lags exceeding seven months which suggests that in the short run, the Cukierman and Meltzer hypothesis does not hold for Ghana. The finding that inflation uncertainty is lower in the period 2007-2012 implies that the Bank of Ghana should continue its inflation targeting efforts as the long run benefits from the declining and lower inflation rates would lower price expectations and reduce inflation forecast errors in the long run.
In a related study on Ghana, Oteng-Abayie and Doe [26] use GARCH model to investigate the relationship between inflation and inflation uncertainty for the period 1984-2011. By employing the two-step procedure of Granger causality test, it was found that inflation uncertainty rises in the high inflationary periods and that inflation uncertainty Granger causes inflation, which is in support of Cukierman-Meltzer hypothesis. Upon using the Full Information Maximum Likelihood (FIML) technique to estimate an alternative GARCH-M model, the significance of inflation uncertainty in the inflation equation confirmed the Granger causality results that higher inflation uncertainty raises inflation. The study recommends that the monetary authority should be seen to be credible in announcing target rates for inflation.
As far as the empirical literature on Ghana is concerned, there is as at now no study that uses the long span of the Ghanaian inflation data (1963:04-2014:02) to investigate the dynamics of inflation uncertainty using an EGARCH model that also controls for seasonal effects on monthly inflation. We therefore propose using an AR-EGARCH model to investigate how inflation and inflation uncertainty are related over the full and some important sub-periods that are identified by policy and political regimes.
3. Methodology and Model
3.1. The Model
Given that the behaviour of inflation uncertainty could be asymmetric, we follow Berument [6] and estimate the following AR (p)-EGARCH (1, 1) model for monthly inflation series
 (1)
(1)
 (2)
(2)
In Equation (1) which is the conditional mean equation, πt denotes inflation rate; mit stands for the monthly dummies3  that account for the monthly seasonal effect and et is the error term at time t, which is assumed to have general error distribution with mean zero and variance
 ![]() and p is the lag order of the autoregressive process. In Equation (2), which is the variance equation, β1 measures the asymmetric effect of inflation on inflation uncertainty, β2 measures the symmetric effect of inflation changes and β3 is a measure of the persistence of volatility. A significant positive β1 coefficient is an indication of leverage effect—inflation uncertainty is affected more by a positive change in the rate of inflation than by a negative change of equal magnitude. We report in Section 4 the estimation results of the two equations.
and p is the lag order of the autoregressive process. In Equation (2), which is the variance equation, β1 measures the asymmetric effect of inflation on inflation uncertainty, β2 measures the symmetric effect of inflation changes and β3 is a measure of the persistence of volatility. A significant positive β1 coefficient is an indication of leverage effect—inflation uncertainty is affected more by a positive change in the rate of inflation than by a negative change of equal magnitude. We report in Section 4 the estimation results of the two equations.
3.2. Data
The data used in this study is sourced from Ghana Statistical Service and the inflation rate is calculated on a month-on-month (m-o-m) basis by taking the percentage change in the CPI with its value from the corresponding month:

The sample period for the study covers April 1963 to February 2014 and includes 611 monthly observations. Figure 1 shows that the monthly inflation rate series is highly volatile; most of the volatility clustering occurred within 1977-1984 period.
Table 3 contains the summary statistics for the monthly inflation rates for full sample period.
With average inflation rate at 2.02, the monthly inflation rate rises by approximately 2 percent per month within the study period. The minimum inflation rate (−15.17) was recorded in August 1966 and the maximum was in May 1983 (23.45). The range for monthly inflation, which is very high at 38.62 percent, confirms the erratic nature of volatility clustering of inflation in Ghana as indicated by the standard deviation value (3.31) which is higher than the mean inflation figure. The positive skewness also implies that the inflation rate is nonsymmetric towards the right tail of the distribution. The Kurtosis statistic (11.62) shows that the distribution of the inflation rate is leptokurtic and skewed to the right. The non-normality of the inflation series is indicated by the significance of the Jarque-Bera and Shapiro-Wilk test statistics (125.86 & 0.87 respectively) at the 0.0 level.
3.3. Unit Root Tests
Before settling on an appropriate GARCH model for our inflation series, we first establish that our inflation data is stationary.
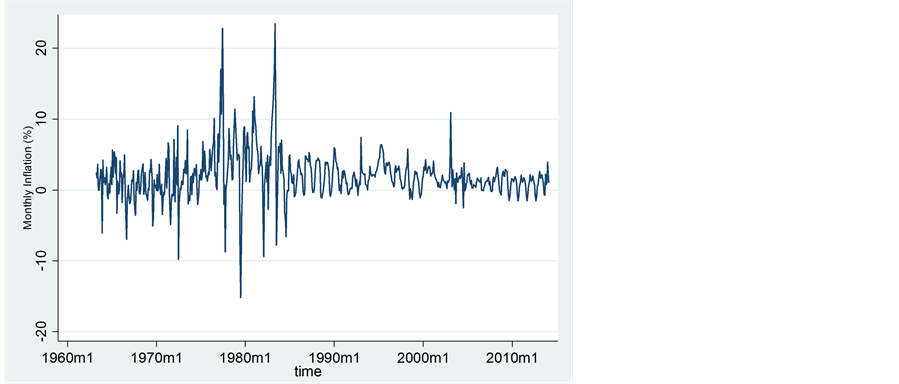
Figure 1. Monthly inflation rates, 1963-2014.
Table 3. The summary statistics of monthly inflation rate.
We identify the integration characteristics of the inflation series by using the Augmented Dickey-Fuller (ADF), Phillips and Perron (PP), Zivot-Andrews (ZA) and Clemente-Montanes-Reyes tests. The ADF and the PP tests have, however, been found to be biased toward non-rejection of the null hypothesis when the series under consideration has structural breaks. We therefore use the Zivot-Andrews (ZA) and Clemente-MontanesReyes (CMR) tests which allow for structural breaks in the series4. These tests consider the null hypothesis of unit root with no break against the alternative of a stationary process with break(s).
Panel A in Table 4 shows the results for the ADF and PP tests for both the cases with constant and constant plus trend regressor. The low values of the test statistics in both cases signifies that our inflation series is stationary (integrated of order zero, or I (0)). In Panels B and C, the results from the ZA and Clemente-MontanesReyes tests show that the null hypothesis of a unit root with no break against the alternative of a stationary process with break(s) is rejected. The break date turns out to be July of 1977 for the ZA test and for the Clemente-Montanes-Reyes test; June 1977 and May 1982 are the two break dates.
4. Results and Discussion
Before estimating parameters of the volatility model, we use standard Box-Jenkins techniques to find the best fitting time series model for Ghanaian inflation over the full sample period and the resultant residuals are tested for ARCH effects. Table 5 contains the OLS estimation results that include three lags of inflation (the first, fifth and eleventh lags respectively) and eleven monthly dummies. There is significant inertia in the rate of inflation as all three autoregressive terms are significant at the 0.01 level. Though only three monthly dummies are significant (July, August and September), a joint test of significance is not rejected at the 5 percent level. For Ghana, the results for these months confirm the generally observed fact that food inflation is much lower in bumper seasons (July, August and September).
As indicated by the Ljung-Box Q-statistics on the residuals, there are no signs of autocorrelation at lags of at lags 6 and 12. To determine whether the squared residuals are significantly time-varying, Ljung-Box Q2-statistics on the squared residuals from the OLS estimation indicate significant presence of conditional heteroskedasticity at lags 6 and 12. Therefore, the null hypothesis of a constant error variance is rejected at the 0.01 level of significance5.
Table 4. Unit root test results.
Given that ARCH effects are present in the monthly inflation series, we have to test whether volatility responds asymmetrically to changes in the rate of inflation. This is achieved by conducting Engle and Ng [27] size and sign bias tests on the residuals from GARCH (1, 1) model6. We present in Table 6 below the tests results for “sign bias”, “positive size bias” and “negative size bias” as can be seen in columns 1, 3 and 4, the conditional volatility of monthly inflation rate is sensitive to the sign and size of the innovation7. In particular, there is strong evidence of sign and positive size bias in the inflation volatility, and the joint test for both sign and size bias is highly significant. The high and significant value for the sign bias test statistics indicate that positive and negative inflation shocks have different impacts on future uncertainty. For the sign bias test statistics, while there is strong evidence of positive sign bias, there is no evidence of negative sign bias as indicated by the 1.16 test statistic value in column 2. This means that positive inflation shock will have more destabilizing effects than negative inflation shock of equal magnitude. Lastly, the results for the presence of sign and size effects are confirmed by the high value of the joint tests statistic (column 4). These results are taken jointly to conclude that the ARCH process in the inflation series is asymmetric.
Given the strong evidence of sign and positive size bias in the conditional variance of inflation, asymmetric GARCH model(s) would adequately fit Ghana’s inflation data. We therefore find the following as the best fitting AR-EGARCH model for both the mean and variance of our inflation data:
 (3)
(3)
 (4)
(4)
The inclusion of the INFDUM8 term is to explore how extreme high inflation affects inflation uncertainty. It
Table 5. Ordinary least squares estimation of monthly inflation rate: 1963:4-2014:2.
*Insignificant monthly dummies in the mean equation have been dropped to conserve space.
is generally believed that macroeconomic uncertainty was generally higher in the pre-ERP period than in the other periods. The INFDUM dummy captures the impact the favourable macroeconomic outturn that prevailed in the post-ERP period had on uncertainty. A priori, INFDUM is expected to be negative.
To determine which hypothesis, Friedman-Ball or Cukierman-Meltzer hypothesis is applicable in the Ghanaian situation, we use two complementary approaches: In the first approach, the sign and significance of the INFDUM term provides a direct way of determining how inflation affects inflation uncertainty. In the second approach, we exclude the INFDUM from Equation (4) and conduct Granger non-causality analysis between inflation and the estimated conditional variance of inflation . The Granger non-causality hypotheses are tested with Wald statistics at lag interval to be specified by appropriate lag length selection criterion.
Table 7 reports the joint estimates of Equations (3) and (4)9. Diagnostics results show that AR (1, 5, 11)
Table 6. Engle and Ng (1993) tests for sign and size bias in variance.
Table 7. Estimated coefficients for conditional mean inflation and variance equations.
Insignificant monthly dummies in the mean equation have been dropped.
EGARCH (1, 1) model seems adequate at modelling the serial correlation structure in the conditional mean and conditional variance of the inflation series as the Qand Q2-statistics are insignificant at conventional levels. In column 1, where the variance equation is augmented with the INFDUM term, all four coefficients are significant at conventional levels. The positive and significant value of the β1 coefficient implies that unanticipated price increases are more destabilizing than negative unanticipated price decreases of equal magnitude—there is a strong indication for a leverage effect. The symmetric effect (0.227) is substantially larger than the asymmetric effect (0.118). Though, the relative scales of the two coefficients imply that positive leverage is completely outweighed by the symmetric effect, failure to control for asymmetry would have raised the β2 coefficient above its true value. Though β3 is less than unity, the higher value implies the persistence in volatility is very long. In fact, the value of β3 (0.925) implies that the contribution of lagged inflation uncertainty to current inflation uncertainty completely outweighs the symmetric and leverage effects.
The INFDUM coefficient turned out to be significant at the 0.01 percent—the market-determined policies pursued by the Bank of Ghana and the central government under the ERP, SAP and inflation targeting periods have all led to significant reduction in inflation uncertainty. This result confirms Friedman-Ball hypothesis that higher inflation raises inflation uncertainty for our sample period so the excessive monetary accommodation within the pre-ERP period that led to high level of inflation also imposed huge costs to economic agents through the inflation uncertainty channel.
Figure 2 indicates that inflation and inflation uncertainty reached their peak levels during the period 1973-1983—this happens to be the very period in which the Ghanaian economy was subjected to myriad of macroeconomic, political and social instability unrivalled in the history of the economy. At a monthly inflation rate of 1.76 percent, the lowest inflation uncertainty (0.42) in the inflation targeting period is recorded in May 2011.
A clearer picture is provided in Table 8 where inflation and the uncertainty of inflation are compared for various sub-periods. While there is declining trend for average inflation and inflation uncertainty over adjacent periods, a sub-period’s mean inflation and standard deviation of inflation uncertainty are statistically lower than the corresponding value for the full sample only in the post-inflation targeting period. In fact, a comparison of the second and fourth rows shows that average inflation rate and average inflation uncertainty in Ghana are lower in the IT period. In contrast, during the periods from the late 1970s to the early 1980s when Ghana was under severe macroeconomic imbalances, the average inflation uncertainty is quite high.
On the basis of the above analysis, there is consistent evidence that inflation uncertainty is higher in periods when average inflation rate is higher; we estimate the EGARCH model without the INFDUM term. We then use
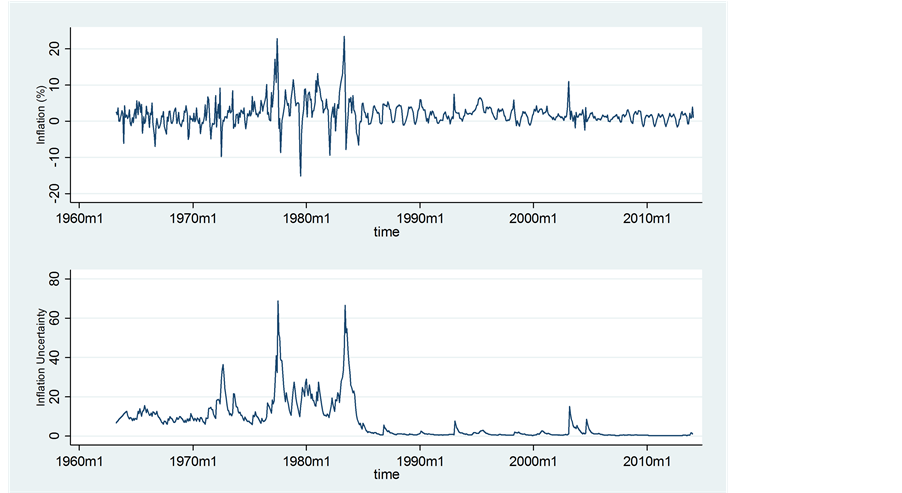
Figure 2. Inflation-inflation uncertainty, 1963-2014.
Table 8. Descriptive statistics for inflation and inflation uncertainty.
the estimated conditional variance of inflation to perform Granger-causality tests in order to determine the exact causality relationship that exists between inflation and inflation uncertainty.
Granger-Causality Results
In this sub-section, we conduct Granger-causality analysis for the full sample as well as three sub-periods. The estimated coefficients for the full sample period are presented in column 2, Table 710. The results in Panel B of Table 9 shows that over the full sample period, the null hypothesis that inflation does not Granger-cause inflation uncertainty is rejected at the 0.01 level using lag 4, 8, and 12. Moreover, the sum of the coefficients is positive in all cases, these results indicate that an increase in the inflation rate “Granger-causes” greater inflation uncertainty. By confirming the finding from the previous section that inflation uncertainty is lower in the postERP era, the positive effect provides a further support to the Friedman-Ball hypothesis which has previously been established for Ghana by Barimah and Amuakwa-Mensah [8] and Oteng-Abayie and Doe [26] .
In Panel B, the results for whether inflation uncertainty lowers or raises subsequent inflation are mixed—the null hypothesis that inflation uncertainty does not Granger-cause inflation is rejected at the 0.01 level for lags 4 and 12 but not for lag 8. The bi-directional causality that exists between inflation and its uncertainty at the eighth lag indicates that increased inflation uncertainty leads to higher future inflation. By supporting the Cukierman and Meltzer hypothesis, the implication is that higher/lower inflation uncertainty translates into higher/ lower inflation only in the medium run. Thus, economic agents will benefit from lower inflation rates only in the medium run by which time they would have concluded on the sustainability and credibility of the announced inflation figures.
We next investigate the relationship between inflation and inflation uncertainty in three sub-periods and report these results in panels A, B and C in Table 10. These sub-periods are the 1973-1983, 1984-2001 and 2007:5-2014:2 periods. The first sub-period covers the political and economic turbulent period where political upheaval and macroeconomic instability reached their peak levels. For the second period, our aim is to verify if Granger causality tests would support the observation from Figure 2 that inflation uncertainty seemed to have been reduced in the post-ERP period. Finally, in the third sub-period which pertains to the inflation targeting period, we are particularly interested in determining the impact the low inflation rates will have on inflation uncertainty. In each sub-period, the best time series model for Equations (3) and (4) is re-estimated and diagnostic tests are performed using standard Box-Jenkins techniques.
For all three sub-periods, the null hypothesis that inflation does not Granger-cause inflation uncertainty is rejected at the 0.01 level using lag 4, 8, and 12. Given that the sum of the coefficients is positive in all cases, we find that higher inflation uncertainty is unambiguously associated with higher average inflation. Therefore, we find strong statistical support for the Friedman-Ball hypothesis. The contextual interpretation for the Friedman-Ball hypothesis for the first sub-period is that the higher average inflation in the period (4.12%) imposed huge costs on economic agents in the turbulent years of the 1973-1983. For the post-ERP period, the benefit an economy enjoys from comprehensive market reforms is seen in the lower inflation uncertainty during this period; average inflation saw a significant reduction from its higher value in the turbulent first sub-period. Finally, the low and declining inflation uncertainty in the inflation targeting period lend strong support for Bank of Ghana’s continued efforts at making inflation its number one policy target.
Table 9. Granger causality test: 1963:04-2014:02.
Note: ***indicates significance at the 0.01 level.
Table 10. Granger causality tests for inflation and inflation uncertainty for sub-periods.
The effect inflation uncertainty has on inflation is provided by the bi-directional causality results for the inflation targeting period (2007:5-2014:2, Table 10, Panel B). At the 1 percent significant level and at all lag lengths, both the Friedman-Ball and Cukierman and Meltzer hypotheses hold as the the sum of the coefficients on lagged uncertainty in the inflation equation is positive and the sum of the coefficients on lagged inflation in the uncertainty equation is also positive. With Granger causality running both ways, there is a feedback process between inflation and its associated uncertainty, so while economic agents gain from lower inflation uncertainty, inflation expectations are accordingly revised downwardly to the benefit of the monetary authority’s fight against credibility. This result for Ghana is similar to the findings reported by Kontonikas [17] for the UK. Our results also confirms that of Tas [23] who demonstrated that inflation uncertainty is significantly lower after the adoption of inflation targeting policies for both emerging and developed countries.
5. Conclusions
This study used AR-EGARCH model to examine the asymmetric relationship between inflation and inflation uncertainty in Ghana over the period 1963:4-2014:2. The result from the variance equation, which indicates that inflation uncertainty varies directly with the rate of inflation in highly inflationary periods, provides an empirical support for the Friedman-Ball hypothesis. The Granger causality results from the two step procedure also confirms the above finding as increases in the inflation rate “Granger-causes” greater inflation uncertainty.
The bi-directional causality that was found to exist between inflation and its uncertainty at the eighth lag indicates higher inflation uncertainty translates into actual inflation only in the medium run.
The results from all three sub-periods show that higher inflation uncertainty is unambiguously associated with higher average inflation. Similarly to the results for the full sample, we find strong statistical support for the Friedman-Ball hypothesis in all sub-periods. The contextual interpretation for the Friedman-Ball hypothesis in the inflation targeting period is that the lower inflation rates translate into lower inflation uncertainty. Within the same sub-period, we find bi-directional causality relationship exists between inflation and its uncertainty. At the 1 percent level and at all lag lengths, Granger causality is found to run in both ways, so there is a feedback process between inflation and its associated uncertainty which thus provides support for both Friedman-Ball and Cukierman-Meltzer hypotheses.
By supporting both the Friedman-Ball and Cukierman-Meltzer hypotheses for the inflation targeting period, one main policy recommendation follows directly from our study. Given that the Bank of Ghana has often missed its inflation targets, improvements in the Bank’s forecasting capacity that are able to minimize political business cycle related spending programmes would be crucial in reducing the huge macroeconomic costs economic agents face as a result of the higher than expected inflation outcomes in ensuing months. By revising downwards their inflation expectations, the greater credibility to be gained from such revision exercise would help prevent any abrupt change in monetary policy stance in the face of any unanticipated shocks to aggregate demand. As witnessed in the reversal of the downward trend in the rate of inflation and given the higher rate at which inflationary pressures are currently building up, our results warn of possible costs of not keeping inflation in check.
References
- Friedman, M. (1977) Nobel Lecture: Inflation and Unemployment. Journal of Political Economy, 85, 451-472. http://dx.doi.org/10.1086/260579
- Makin, H.J. (1981) Anticipated Money, Inflation Uncertainty and Real Economic Activity. The Review of Economics and Statistics, 17, 126-134.
- Okun, A. (1971) The Mirage of Steady Inflation. Brooking Papers on Economic Activity, 2, 485-498. http://dx.doi.org/10.2307/2534234
- Apaloo, L.K. (2001) Inflation Growth and Seignorage Revenue: The Ghanaian Experience. Centre for Policy Analysis, Accra.
- Fountas, S. (2001) The Relationship between Inflation and Inflation Uncertainty in the UK: 1885-1998. Economics Letters, 74, 77-83. http://dx.doi.org/10.1016/S0165-1765(01)00522-5
- Berument, M.H. and Sahin, A. (2010) Seasonality in Inflation Volatility: Evidence from Turkey. Journal of Applied Economics, 13, 39-65. http://dx.doi.org/10.1016/S1514-0326(10)60003-7
- Wilson, B.K. (2006) The Links between Inflation, Inflation Uncertainty and Output Growth: New Time Series Evidence from Japan. Journal of Macroeconomics, 28, 609-620. http://dx.doi.org/10.1016/j.jmacro.2004.11.004
- Barimah, A. and Amuakwa-Mensah, F. (2012) Does Inflation Uncertainty Decrease with Inflation? A GARCH Model of Inflation and Inflation Uncertainty for Ghana. West African Journal of Monetary & Economic Integration, 12, 32- 61.
- Ball, L.P. (1992) Why Does High Inflation Raise Inflation Uncertainty? Journal of Monetary Economics, 29, 371-388. http://dx.doi.org/10.1016/0304-3932(92)90032-W
- Cuikerman, A. and Meltzer, A. (1986) A Theory of Ambiguity, Credibility and Inflation under Discretion and Asymmetric Information. Econometrica, 54, 1099-1128. http://dx.doi.org/10.2307/1912324
- Cukierman, A. (1992) Central Bank Strategy: Credibility and Independence. MIT Press, Cambridge.
- Pourgerami, A. and Maskus, K. (1987) The Effects of Inflation on the Predictability of Price Changes in Latin America: Some Estimates and Policy Implications. World Development, 15, 287-290. http://dx.doi.org/10.1016/0305-750X(87)90083-0
- Holland, A.S. (1995) Inflation and Uncertainty: Test for Temporal Ordering. Journal of Money, Credit and Banking, 27, 827-837. http://dx.doi.org/10.2307/2077753
- Crawford, A. and Kasumovich, M. (1996) Does Inflation Uncertainty Vary with the Level of Inflation? Bank of Canada, Working Paper, Ottawa.
- Engle, R.F. (1982) Autoregressive Conditional Heteroskedasticity with Estimates of the Variance of UK Inflation. Econometrica, 50, 987-1007. http://dx.doi.org/10.2307/1912773
- Caporale, B. and Caporale, T. (2002) Asymmetric Effects of Inflation Shocks on Inflation Uncertainty. Atlantic Economic Journal, 30, 385-388. http://dx.doi.org/10.1007/BF02298781
- Kontonikas, A. (2004) Inflation and Inflation Uncertainty in the UK: Evidence from GARCH Modelling. Economic Modelling, 21, 525-543. http://dx.doi.org/10.1016/j.econmod.2003.08.001
- Pourshahabi, F., et al. (2010) Asymmetry Effect of Inflation on Inflation Uncertainty in Iran: Using from EGARCH Model, 1959-2009. American Journal of Applied Sciences, 7, 535-539. http://dx.doi.org/10.3844/ajassp.2010.535.539
- Henry, Ó.T., Olekalns, N. and Suardi, S. (2007) Testing for Rate Dependence and Asymmetry in Inflation Uncertainty: Evidence from the G7 Economies. Economics Letters, 94, 383-388. http://dx.doi.org/10.1016/j.econlet.2006.08.024
- Fountas, S. (2010) Inflation, Inflation Uncertainty and Growth: Are They Related? Economic Modeling, 27, 869-899. http://dx.doi.org/10.1016/j.econmod.2010.06.001
- Samimi, A.J., Mohamadreza, A. and Ghader, S. (2012) Inflation and Inflation Uncertainty: Evidence from MENA. Universal Journal of Management and Social Sciences, 2, 57-62.
- Farhan, A.M., et al. (2012) Inflation, Inflation Uncertainty and Output Growth, Are They Related? A Study on South East Asian Economies, 1960-2010. Journal of Basic and Applied Scientific Research, 2, 6108-6114.
- Tas, K.O. (2009) Inflation Targeting and Inflation. TOBB University of Economics and Technology, Working Paper, No. 09-07, Ankara.
- Sintim-Aboagye, H., et al. (2012) Uncertainty of Inflation and Inflation Rate: Does Credibility of Inflation Policy Matter? Economic Issues, 17, 95.
- Hegerty, S.W. (2012) Does High Inflation Lead to Increased Inflation Uncertainty? Evidence from Nine African Countries. African Economic and Business Review, 10.
- Oteng-Abayie, E.F. and Doe, S.K. (2013) Inflation and Inflation Uncertainty in Ghana. Journal of Business Management and Economics, 4, 259-266.
NOTES

1Apaloo has pegged the growth maximizing inflation rate at 9%.

2The month-on-month (m-o-m) inflation for a particular month in a year is calculated by computing the percentage change in CPI with its value in the previous month in the same year. Similarly, the year-on-year (y-o-y) inflation for a particular month in a year is calculated by computing the percentage change in CPI for the same month in the previous year.

3December dummy is excluded to avoid the dummy variable trap problem.

4While the ZA test is more suited for series which have one break data, the CMR test is applied on series with two break dates. The advantage of these tests is that they do not require an a priori knowledge of the structural break dates; the ZA and CMR tests determine the actual dates of structural breaks within the system.
5We also used the Crawford & Kasumovick technique to confirm the existence of GARCH effects.

6Various GARCH models were estimated out of GARCH (1, 1) became the parsimonious model.
7See Engle and Ng for details on the three equations and the testing procedures used to determine whether the ARCH process is asymmetric.
8Following Caporale and Caporale , the INFDUM dummy controls for the impact of the high political and economic uncertainty on macroeconomic uncertainty witnessed in the Ghanaian economy for most part of the late 1970s and early 1980s. INFDUM = 1 after the pre-ERP period and 0 otherwise.

9Quasi-maximum likelihood estimation technique is used and robust standard errors are reported.

10The estimated conditional variance of inflation from Equation (2) is used as our time series measure of inflation uncertainty.