Modern Economy
Vol. 3 No. 1 (2012) , Article ID: 16804 , 11 pages DOI:10.4236/me.2012.31005
How Do Foreign and Domestic Demand Affect Exports Performance? An Econometric Investigation of Indonesia’s Exports
Graduate School for International Development and Cooperation, Hiroshima University, Hiroshima, Japan
Email: rudyrahmaddi@hiroshima-u.ac.jp
Received September 27, 2011; revised November 5, 2011; accepted November 28, 2011
Keywords: Exports; Demand and Supply for Exports; Domestic Demand Pressure; Indonesia; Simultaneous Equations
ABSTRACT
This paper explores the impacts of foreign and domestic demand on Indonesia’s exports within demand and supply frameworks using aggregate data of 1971-2007. In contrast to many previous studies employing a single equation model, the paper investigates such relationship by dealing with plausible simultaneity between quantity and price within demand and supply of exports using a simultaneous equation framework, which also enables one to distinct between pull (foreign demand) and push (cost) factors of exports. To capture effects of secular and cyclical movements on exports, we dissect income variables into trend and business cycle as proxies of productive capacity and capacity utilization rate, respectively. Our results suggest that both demandand supply-price elasticity are elastic, and secular and cyclical movements may have contrast effects on exports. The production capacity is positively attributed to exports performance, while the capacity utilization negatively affects exports, which confirms the customary version of domestic-demand pressure hypothesis. Some economic shocks and policies also play roles in determining exports performance. All estimated coefficients are statistically stable over the period under study. The findings draw policy implications namely the importance of price-based policy, provision of adequate and sound infrastructures, and further development of human capital-based industrialization.
1. Introduction
A large number of empirical studies have been devoted during the last three decades to scrutinize the roles of export on economic performance on the ground of inquiry whether an outward-oriented or export promotion (EP) policy is preferable to an inward-oriented or import substitution (IS) trade policy. Nevertheless, any preference over either EP or IS policy requires a thorough comprehension on the demand and supply of a country’s trade. [1] emphasized that either imports substitution or export promotion strategy depends crucially on a clear knowledge of trade demand function and the magnitude of the relevant elasticities. For the stability of the balance of payments in Marshall-Learner condition, [2] pointed out that a country should have the sum of import and export demand price elasticities in absolute term to be higher than one. A country with higher income elasticity of demand for its imports than that of its export demand will experience a more rapid import growth, condition of which will deteriorate its balance of trade and give more pressure on its exchange rate. Thus, an efficient trade management of a growing economy truly requires a sufficient comprehension on the elasticities of imports and exports.
Many previous studies of the exports behavior have been conducted based on single equation model.1 Estimates of export price elasticities in such studies mostly focus on the demand side, while supply relationship have typically been handled by assumption that the export and import supply price elasticities facing any individual country are infinite or at least large. [6] argued that such assumption of an infinite price of elasticity seems reasonable a priori in case of world supply of imports to single country, but, far less applicable to an individual country’s supply of exports. [7] further argued that reliance on single equation methods has obscured the distinction between push (foreign demand) and pull (cost or supply) factors of exports. Thus, the inclusion of driving forces of foreign and domestic demand in exports analysis is deemed necessary since the former affects export performance from demand side and the latter from supply side. As conesquence, an appropriate empirical investigation should take such issues into consideration.
In addition, variations in domestic demand pressure may have indirect effect on export performance through affecting the supply-side or availability for exports. [8] argued that at relatively high levels of domestic demand, among other things, the quantity of resources devoted to exports is lower than would have been the case at lower levels of internal demand. The argument is based on the view that export will be relatively unprofitable compared to home sales during condition of high level of domestic demand. They further argued that a rise in overall demand pressure may create strong competition for resources, which would have been devoted to exports if the pressure of internal demand had been lower even if home and export sales are equally profitable. Thus, the interrelationship between domestic demand and exports may have some implications on trade policy developments in terms of international business cycle synchronization, domestic and external adjustment.
The purpose of our current study is to investigate price and income responsiveness within demand and supply frameworks, both of which represent foreign demand and domestic demand impacts on Indonesia export commodeties using aggregate data of the period of 1971 to 2007. Our study proposes contribution to the existing literature in several ways. First, in contrast to most previous empirical studies employing a single equation model, the current study estimates elasticities of demand and supply for exports in a simultaneous equation framework. Second, the study makes a separation of trend and cyclical movements of real income to explore each plausible impact on export supply including testing for domestic pressure hypothesis as argued by [7] and [9]. To our best knowledge, this attempt has not been explicitly conducted in empirical trade study of Indonesia. This paper attempts to fill this gap. Third, it captures the possible related important events during period of observation into the model that might affect to exports behavior. Lastly, the findings add inputs to policy formulation, for Indonesia in particular.
The rest of paper is organized as follows. Section II provides profile of Indonesia economy at glance, emphasizing on the pattern of export performance and industrialization process in Indonesia during period of observation. Section III reviews the data and methodology used in this study. The penultimate section IV elucidates the empirical results as well as draws some policy implications. Section V provides some concluding remarks.
2. Overview of Indonesia’s Economy from 1971 to 2007
Started from 1970, after suffering from deep economic crisis triggered by heavy political turbulence over the 1960s period, Indonesia embarked on new development strategy emphasizing on economic development as the main priority. The economic structure during 1970s was dominated by primary sector (including agriculture) with a minuscule proportion of industry sector. The economy was mostly fueled by exports of natural resource intensive (NRI) particularly petroleum exports (75 percent of merchandise exports and 66.67 percent of government revenue) reaping benefit from quadrupled world oil price. It recorded 6.9 percent of GDP growth during 1971 to 1985, which reached its peaks of 11.3 percent in 1973.
Like in first development phase of most developing countries, the industrialization strategy adopted during this period was Import Substitution Industrialization (ISI) strategy marked by heavy protection focusing to serve for domestic market. Tariffs were increased, but more importantly the government embarked on heavy industrialization program underpinned by increased resort to protection measures and petroleum exports. Such a strategy persisted for about a decade. The fall in oil prices in the period of 1982-1986 wiped out the gains to Indonesia from oil boom in the mid 70s. This weakened oil prices significantly reduced export earnings, budget revenues as well as her balance of payment. During 1980-1985, GDP grew by 4.76 percent per annum slower than the 8.94 percent during 1975-1980 periods. In response to this condition, the government undertook some required actions, one of which was by embarking on a series of major reforms including trade liberalization [10]. Until the end of ISI era, share of exports of manufactured-commodities to total exports were remain negligible at 11 percent.2 Study of [12] indicates that Indonesia’s GDP grew at 6.9 percent p.a. on average for the period of 1971 to 1985, which was mainly contributed by growth in domestic demand mostly dominated by domestic consumption (Figure 1).
The era of export promotion (EP) strategy in Indonesia was embarked in the aftermath of the decline in oil price in the mid 1980s.3 During this period, Indonesia’s economy began to feel the impact of rapid increases in foreign direct investment owing to bold and decisive series of liberal economic reforms introduced from the mid- 1980s onward. This reform covered the exchange rate management including two large nominal depreciations in 1983 and 1986; prudent fiscal policy; comprehensive tax reform; a more open posture towards foreign investment; and financial deregulation including in banking sector.4
The private sector and exports became the main engine of the development of the manufacturing sector for the first time ever. Exports of manufactures grew five-fold
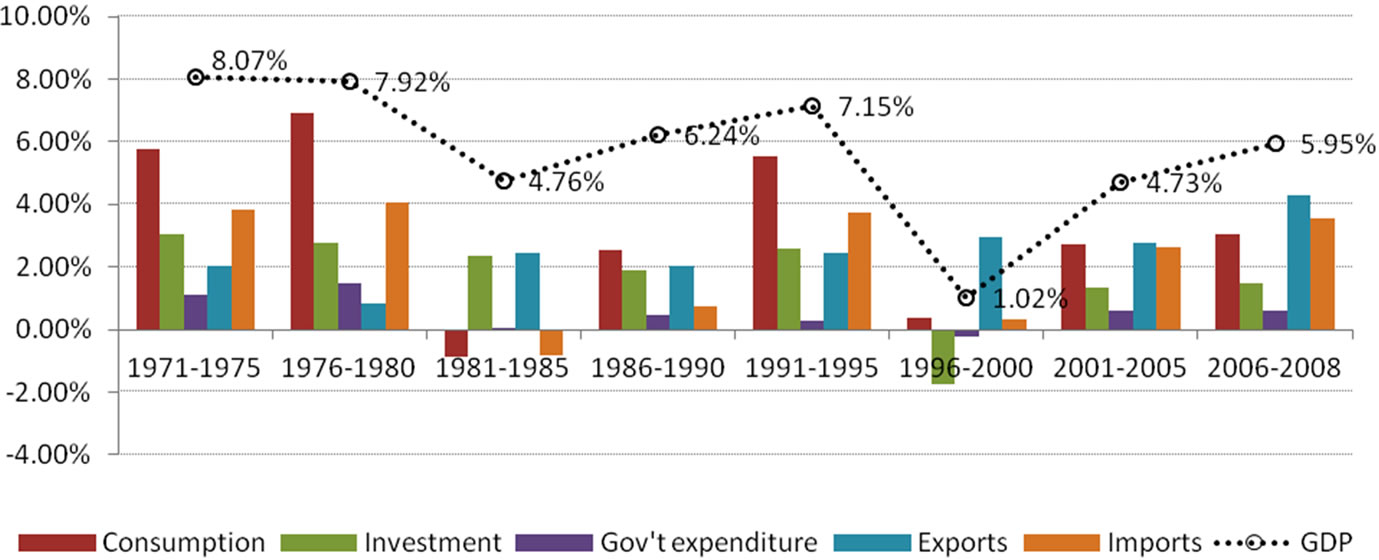
Figure 1. Contribution of growths of expenditure components to GDP growth (Source: World Development Indicators 2010, calculated).
over 9 years from that of 1985 owing to a string of liberalization packages on trade and investment including relaxation of foreign investment restrictions, tariff cuts, and the abolition of non-tariff trade barriers. Companies designated as export-oriented firms based on the export ratios of products were accorded preferential treatment in the equity ratio of foreign capital, operations in bonded export processing zones and procurement of raw materials. The government also restored the drawback system, under which import tariffs imposed on raw materials and parts are refunded when finished products are exported. These significant reforms may have some significant effect to the increases in exports of manufacturing. The portion of manufactured exports in total exports increased overtime and reached its peak of 68 percent in 2007.5 From 1986 to 1997, share of export rose significantly to 33.7 percent compared to that of 25.7 percent during ISI era contributing to 6.6 percent GDP growth on average. Such condition persisted until Indonesia was hit by economic crisis in 1998.6
The existence of Asian economic crisis in 1998 and its long recovery process in Indonesia resulted in slowing GDP growth at 4.9 percent on average of 1986 to 2008 due to significant slump in domestic demand. However, in the exports sector, there was a competitive boost in exports sectors performance especially primary exports due to the sharp depreciation in exchange rate during crisis.7 Nevertheless, [17] argue that the rupiah depreciation may have failed to boost exports as no significant competitive price advantage may have accrued to Indonesia. [18] find that such large exchange rate depreciations in Asian economies following the 1997 Asian crises contributed to exports performance with a notable less effect. They propose two following main explanations, namely 1) the competitive depreciation by other countries in the region neutralized the effects on demand for exports, and 2) the pressure in domestic economy in form of contraction in domestic credit affected supply of exports. [19] adds that one explanation for Indonesia’s export failure, among other things, is serious infrastructure bottlenecks in the economy. In spirit of the latter, [12] using GDP decomposition analysis, reveals that throughout period exports grew in expense of domestic demand (Figure 2). These findings propel this study to formally investigate the plausible significance of domestic demand pressure on export performance in Indonesia.
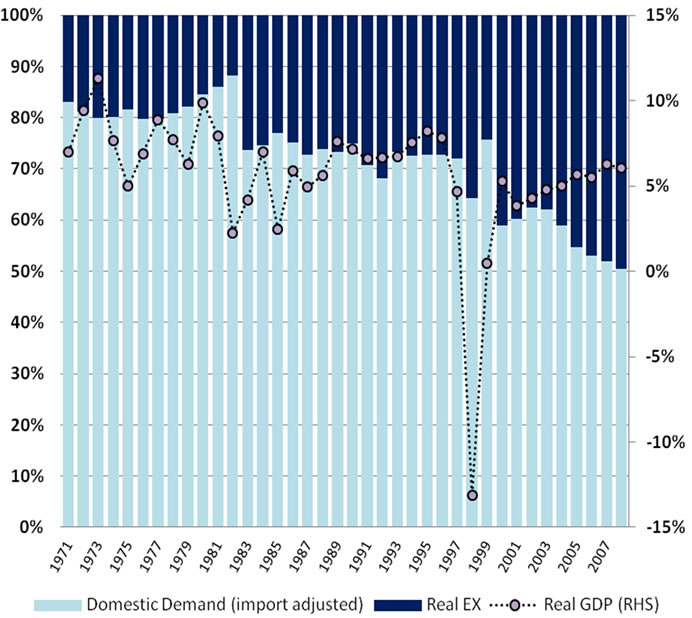
Figure 2. Contribution of domestic demand and exports to GDP growth (Source: World Development Indicator 2010, calculated).
3. Methodology
3.1. The Data
The analysis used in this study covers annual time series of 1971 to 2007, which should be sufficient to capture the long-run behavior of exports behavior in the demand and supply model.8 The data set consists of observation for several variables. These are real exports value as proxy exports quantity (Qt); proxy of exports price index (PXt) obtained by computing the ratio of real exports value in constant US$ to its current US$; trend and cycle of world real GDP (TYwt) and (CYwt), respectively; wholesale price index as proxy of domestic price (PDt); trend level of country’s real output obtained by fitting a linear time trend to the logarithm of real output (TYt); and the deviation from trend income (CYt).9
Since our observation period crosses some related events plausibly affect to exports behavior, we also employ several dummy variables, namely exports shock in 1999 (D99t), oil price shocks (DOIL), trade liberalization (DTLt), and Asian economic crisis (D98t). All data set are taken from World Development Indicators CD-ROM. All variables, except dummies, are in natural logarithms.
3.2. Model Specification
In assessing long-term determinants of exports, this study adopts the standard specification of export demand and supply as well explained in [9]. Quantity of export demanded in a period is defined as a function of the price of exports (PXt), world income separated into its trend (TYwt) and cycle movements (CYwt), and the price of goods in the rest of the world (Pwt). Here, we follow [6] and [1] among others, by assuming exports is homogenous of degree zero in prices. In order to isolate shocks effect in exports performance during 1999 (Figure 3), we employ a qualitative dummy10 into demand function.
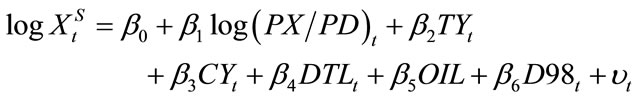
Symbolically, the function may be specified in loglinear with random error term as follows:
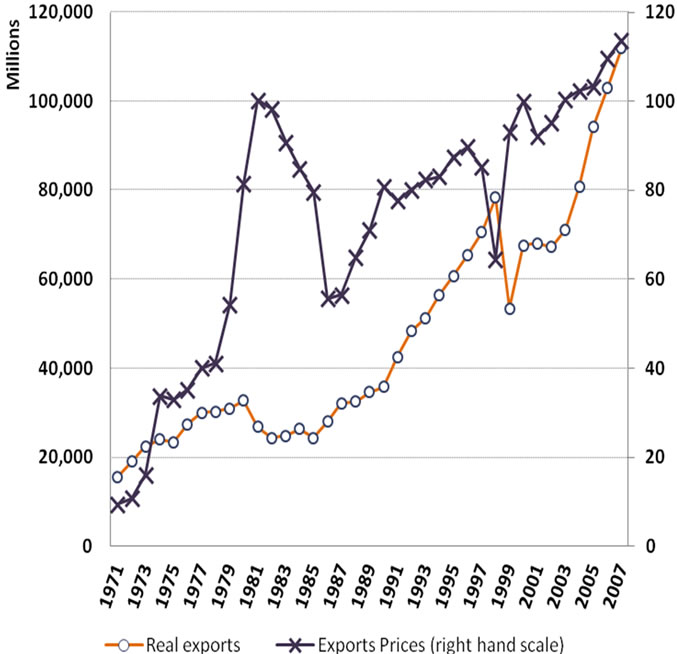
Figure 3. Indonesia’s exports value and price (Source: World Development Indicators 2010).
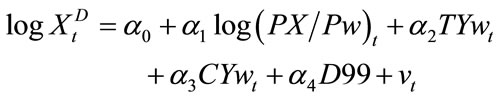 (1)
(1)
Since we assumed exports to be homogeneous of degree zero in prices, change in the two price variables is considered to be equal in size yet opposite in sign. Thus, relative price elasticity (α1) is expected to have negative sign. On the other hand, the income variable in demand model can also be distinguished into trend and cycle movements to analyze each effect on exports. The elasticities of trend (α2) and cycle (α3) of world income are expected to have positive signs.11
Similarly, the supply of exports is specified as a log-linear function of the relative price of exports (ratio of exports prices, PXt, to domestic prices, PDt12 and domestic activity variable. The domestic activity (real income) variable is separated into TYt and CYt to allow a distinction between secular and cyclical movements’ effects on the level of exports, both of which allow one to test for domestic pressure hypothesis. To capture some important economic events plausibly attribute to export supply, we employ a set of qualitative dummies of trade liberalization, DTL (1 for 1986 to 2007, zero otherwise), oil price shock dummy, DOIL (1 for 1974, 1981, and 2005, zero otherwise), and dummy for Asian economic crisis, D98 (1998 equals to 1, zero otherwise). The inclusion of oil price shocks dummy is justified since exports of oil and gas still comprised one-quarter of Indonesia’s exports.13 Thus, export supply function with error terms can be written as follows:
 (2)
(2)
Equation (2) is the general model of export supply in our study. This specification assumes that firms are price takers and postulates that supply of exports is attributed to relative prices of export and domestic inputs, trend level of real income, the deviations from this trend, and any related economic policy and shocks. The model embodies the hypothesis that as the exports prices increases relative to domestic input prices, exports activities will be more profitable, and accordingly, exporters will have an incentive to supply more. In addition, exports are conjectured to rise, when there is an increase in country’s capacity to produce, which represents any advances in factor supply, infrastructure, and total factor productivity in the economy. In contrast, any increases in the deviation of secular trend may capture the development of bottlenecks, which would affect negatively to the supply of exports. Therefore, the elasticity of relative price (β1) and secular income (β2) are expected to have positive signs, while elasticity of cyclical movements of real income (β3) is posited to be negative. The Equation (2) can be normalized for the price of exports, PXt, to yield:14
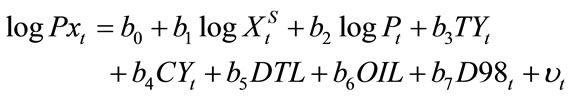 (3)
(3)
where:
b0 = –β0/β1 | b1 = 1/β1 | b2 = β1/β1 | b3 = –β2/β1 |
b4 = –β3/β1 | b5 = –β4/β1 | b6 = –β5/β1 | b7 = –β6/β1 |
In such supply-price specification model, we expect all coefficients (excluding dummies) are positive, except b3. Meanwhile, b0 is intercept.
3.3. Disequilibrium Model
To capture dynamic behavior among the observed variables within the demand and supply models for exports, we utilize the adjustment mechanism suggesting that exports do not adjust instantaneously to their long-run equilibrium level following a movement in any of their determinants [6,1] argued that such a non-instantaneous adjustment is due to several reasons, namely (1) the significant distances between the suppliers and the buyers exist. Consequently, not only delivery times are expanded, but also, information regarding desires of suppliers and buyers are known only with lags (2) supplies of imported goods are contracted over a period of time, thus, the foreign consumers as well as domestic suppliers may not respond immediately to changes in prices, costs and/ or incomes.
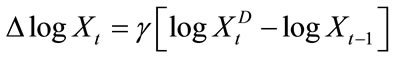
Following [6], export quantities are assumed to adjust to the discrepancy between world demand for a country’s exports in the current period and the actual flow of exports in the previous period. This implies that quantity of exports adjusts to conditions of excess demand in the rest of the world. Meanwhile for supply model, using supplyprice specification, the price of exports is assumed to adjust to conditions of excess supply.15 These disequilibrium models of demand and supply are as indicated in Equations (4) and (5), respectively.
 (4)
(4)
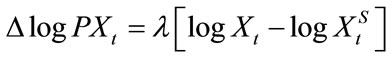 (5)
(5)
where γ and λ are coefficient of adjustment (assumed to be positive) and Δ is a first difference operator. In Equation (5), it implies that an increase in excess supply will reduce the price of exports. On the other hand, a decrease in excess supply will facilitate the price of exports to rise.
Substituting Equations (1) to (4) yields the following disequilibrium export demand equation:
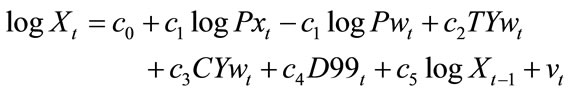 (6)
(6)
where:
c0 = γα0 | c1 = γα1 | c2 = γα2 |
c3 = γα3 | c4 = γα4 | c5 = (1 – γ) |
The average time lag in such exports adjustment is equal to γ–1 and can be derived from the parameter estimates of Equation (6) as 1/(1 – c5).
Likewise, by substituting Equations (3) to (5) yields the following disequilibrium export price in supply equation:
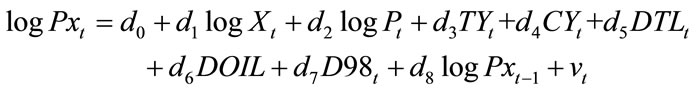 (7)
(7)
where:
d0 = –λβ0/(1 + λβ1) | d1 = λ/(1 + λβ1) |
d2 = λβ1/(1 + λβ1) | d3 = –λβ2 /(1 + λβ1) |
d4 = –λβ3/(1 + λβ1) | d5 = λβ4/(1 + λβ1) |
d6 = λβ5/(1 + λβ1) | d7 = λβ6/(1 + λβ1) |
d8 = 1/(1 + λβ1) |
Equations (6) and (7) are our final models of disequilibrium demand and supply for exports, respectively. These equations are consistent with the fact that Indonesia is price taker in most export commodities, while being price setters in others [26].
The reduced-form equations obtained from Equations (6) and (7) are as follows:16
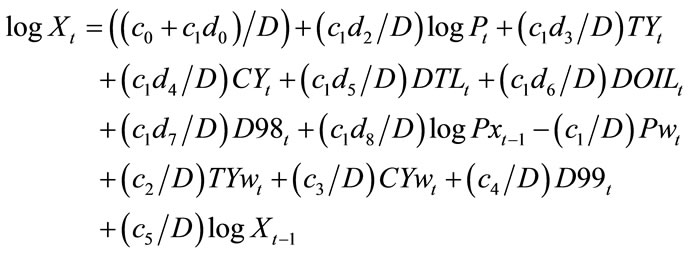 (8)
(8)
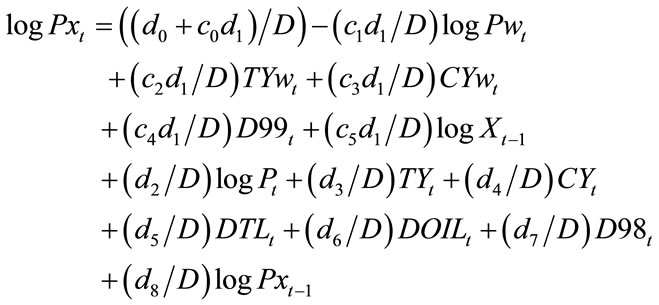 (9)
(9)
where D = 1 – c1d1.
The order conditions of demand- (8 ≥ 1) and supplyequation (5 ≥ 1) both are over-identified. Viewed as a system of simultaneous equations, Equations (6) and (7) have two endogenous variables, log Xt and log PXt. There are 12 exogenous variables, namely Pwt, TYwt, CYwt, PDt, TYt, CYt, 4 dummies, and 2 lagged of endogenous variables. The order condition in demand and supply equations both are over-identified. Therefore, we apply the twostage least squares (2SLS) as an appropriate method of estimation. Note that in Equation (6), the absolute value of coefficient of log PXt and Pwt has to be in equal if the relative price model is a valid assumption.
To deal with the possibility in any time series study that the coefficients of the variables may be unstable overtime, we apply a Farley’s stability test developed by [27] and [28]. The calculated values of Farley’s F-ratio for demand and supply equations are provided in notes attached in Tables 1 and 2.
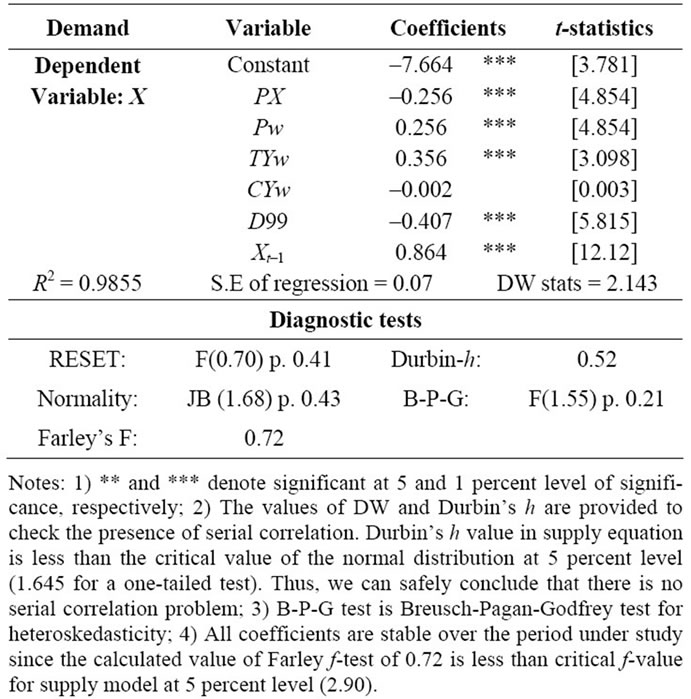
Table 1. 2SLS estimates of the demand for exports.
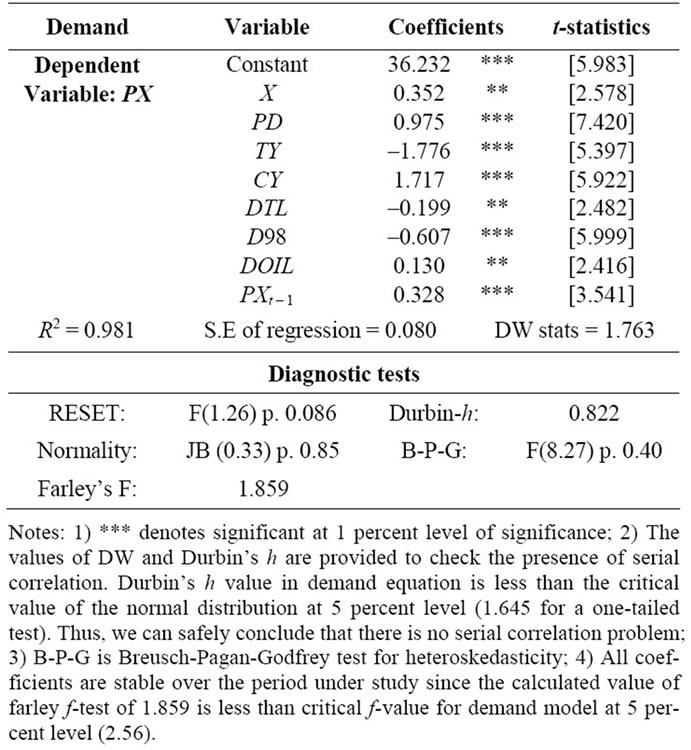
Table 2. 2SLS estimates of the supply for exports.
4. Empirical Results and Policy Implication
The results of disequilibrium models of demand and supply outlined in the previous section are presented in Tables 1 and 2, respectively. We also examine the signs, statistical significance, and several diagnostic criteria for plausible misspecification bias, homogeneity assumption, heteroskedasticity and autocorrelation problems, as indicated in each table.
Statistically, the results of Equations (6) and (7) are quite impressive and all coefficient signs are as expected. The estimated adjustment parameter of lagged exports volume and price both are also as expected. They are positively less than one, and significantly different from zero at 1 percent significance level implying degree of dynamic adjustments in demand and supply of exports. The formal test for parameter estimates stability using Farley’s procedure generates values of F-ratio of 0.42 and 1.859 for demand and supply equation, respectively. Thus, we can safely conclude that all coefficients in both demand and supply models are stable over period under study.
Importantly, the empirical findings presented in Table 1 support the hypothesis that the relative export price and foreign income plays a significant role in determining demand for Indonesia exports. The estimated relative exports price elasticity, which is assumed to be homogenous in degree zero, carries the expected negative sign and significantly different from zero at 1 percent significance level. The estimated long-run price elasticity of demand for export commodities, whose magnitude is –1.88 (price-elastic) implies that 1 percent increase in relative price will reduce world demand for Indonesia exports by more than proportionate at 1.88 percent suggesting that demand is considerably responsive to price in long-run. This price-elastic elasticity of export demand implies that Indonesia export commodities have been shifting from basic, natural resource-intensive (NRI) commodities towards more manufactured products17. It is worth noting that share of NRI products to total exports has gradually been decreased from about 77 percent to 28 percent during 1981-1985, whereas manufactured exports presently contribute about 50 percent of total exports basket. This makes exports more sensitive to changes in relative export prices [5].
The estimated trend income elasticity of demand carries the expected positive sign and significantly different from zero at 1 percent significance level, while the cycle income elasticity is not significantly different from zero. The estimated long-run trend income elasticity of demand for export commodities with 2.62 magnitude implies that 1 percent increase in foreign (world) income will facilitate an increase in world demand for Indonesia exports by 2.62 percent suggesting that demand is highly responsive to income (income-elastic) in long-run. This implies that ceteris paribus, a rise in world economic activity raises the demand for Indonesia exports more than proportionate and Indonesia exports are treated as normal to luxury goods by their importing country confirming the condition that Indonesia exports are shifting towards more manufactured exports composition. Exports shock in 1999 is also significant at 1 percent significance level implying that any economic shock is attributed to affect the Indonesia’s demand for export commodities. Both long-run elasticities of price and income of export demand are presented in Table 3.
The estimated adjustment parameter in demand model is less than one and significantly positive at 1 percent significance level implying a degree of dynamic adjustment. It suggests that 86.4 percent of total adjustment of quantity demanded is achieved in first period. The average time lag adjustment for adjustment of exports to changes in the independent variables of 7.35 years is obtained by calculating γ–1, where γ is derived from (1 – c4). The mean time lag of our demand model is in contention with [6], which suggests that it is quite short. Nevertheless, this long time lag adjustment is quite similar with that of [26], who found 6.7 years of average time lag of demand for Malaysia. In this regard, [6] pointed out that some of the studies may find very long lags in export behavior especially when relative price appears as explanatory variable. They further argued that this is also plausibly due to the limitation of the partial adjustment model, which imposes the same (declining) geometrically weighted lag for all explanatory variables.
The estimates of export supply function as reported in Table 2 also yield useful information. The coefficient on lagged export prices in supply model is also as expected, significantly positive at 1 percent level of significance and less than one, all of which implies a degree of dynamic adjustment suggesting that this variable may play role in explaining the dynamic changes in export prices. The price-quantity relationship in supply model is significantly different from zero at 5 percent level of signifycance with positive-sloped. The estimated price elasticity of export supply is estimated from Equation (7) by first obtaining values of λ and then putting it into (λ – d1)/(λd1) to get β1, where d1 is equal to λ/(1 + λb1) , or just simply β1 is as (1 – d8)/d1. The value of 1.9118 in long run is as
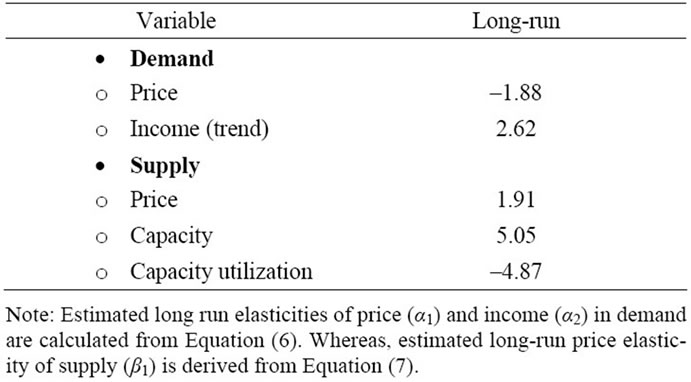
Table 3. Estimated long run elasticities of exports.
presented in Table 3. The higher magnitude of price elasticity of supply compared to that of demand suggests that Indonesia exports are more supply-determined. This evidence supports [18] and [20] conjectures that supply side rather than demand side is the more relevant determinants of Indonesia export performance.
In addition, domestic price has a positive and significant effect on export price implying the significance of prices of factor inputs in determining the export price. The estimated coefficients of secular and cyclical income variables representing the significance of productive capacity and capacity utilization, respectively, both are significantly different from zero at 1 percent level of significance and carry expected signs.
The parameter estimate of trend income bears negative sign confirming the argument that an increase in productive capacity, which is associated with advances in factor supply, infrastructure, and total factor productivity, will facilitate to reduce production cost of exportable. These advances will eventually provide an incentive for exporters to increase production of exportable at any given level of export prices due to increasing profit margin. The latter is confirmed by a positive long-run coefficient of productive capacity (β2) on exports quantity with magnitude of 5.05 (recall that result of d3 is negative), which is obtain from d3 = – λβ2/ (1+ λβ1) in Equation (7). In accordance with [7] insights, such a greater than unity magnitude of trend measure of capacity variable also implies a growing openness of the economy, which confirms the significance of the existing trade liberalization program unleashed in mid’80s on facilitating exports in Indonesia.
The coefficient of cyclical income variable carries positive sign. This evidence is in accordance with domestic pressure hypothesis implying that a high level of capacity utilization, which captures development of bottlenecks, is associated with an increase in export price. Recall that d4 = – λβ3/(1 + λβ1) and estimated d4 is positive, thus, the long-run coefficient of cyclical income (β3) is –4.87, which confirms the customary version of the capacity pressure hypothesis suggesting that a high level of capacity utilization (domestic demand) will choke off production of exportable in Indonesia. This also implies the existence of competition between exportsand domestic-sector towards scarce economic resources in Indonesia. Our previous finding as indicated in Figure 2 displays supporting evidence to our current finding in regards to conforming domestic demand pressure hypothesis on exports performance. It revealed that throughout period of 1971 to 2008 exports grew in expense of domestic demand, except period of 1986 to 1990 (Figure 2).
Our current finding is also in accordance with study of [31] arguing that one explanation for Indonesia’s export failure, among other things, is serious infrastructure bottlenecks in the economy.19
In Table 4, we provide a summary of the estimated longrun elasticities of this study compared with those of other previous studies. Our estimate of price elasticity of demand for exports is higher than those of [26] and [5], yet is lower than that of [30]. While our estimate of income elasticity of export demand can be comparable with those of two others, [22] did not find any significance of foreign income on demand for Indonesia exports. In supply estimates, our estimated price elasticity of exports supply is higher than that of [30], yet, it is still lower than that estimated by [26]. Those differences are plausibly attributed to several factors, namely (1) specification of the single equation model (2) data characteristics in terms of the composition of exports commodity (aggregated or disaggregated), and data frequency.
The government reforms to facilitating trade are significantly attributed to reducing export price at 5 percent significance level. This is plausibly due to combination of some factors, i.e. the devaluation of rupiah currency against US dollar in 1986, which was followed by a continuous flexible exchange rate management afterwards; facilitation on foreign investment; a string of trade liberalization packages including significant alleviation on trade barrier; and efficiency on trade bureaucracy. All of above factors contribute to ease what so-called “high cost economy”20 that eventually reduce the exports price. This evidence also confirms previous findings of [20] on the importance of trade liberalization policy taken by the government of Indonesia (GOI) to facilitate export performance.
Two last other dummies of Asian economic crises and oil price shocks are also significantly contributed to export performance at 1 percent and 5 percent level of significance, respectively. The Asian economic crises carry negative relationship with export price. Part of this negative relationship is contributed to a sharp depreciation on rupiah from 2500 to 17,500 against US dollar by January 1998—the fastest depreciation of a currency value in any of the crisis countries in the region21—boosting exports during such crises. During such crises, Indonesia’s exports especially exports of primary commodities rose contributing a positive portion to overall GDP growth. Nevertheless, it is worth noting that the Asian economic crises not only brought an opportunity to induce increasing exports, but also generates some structural problems that
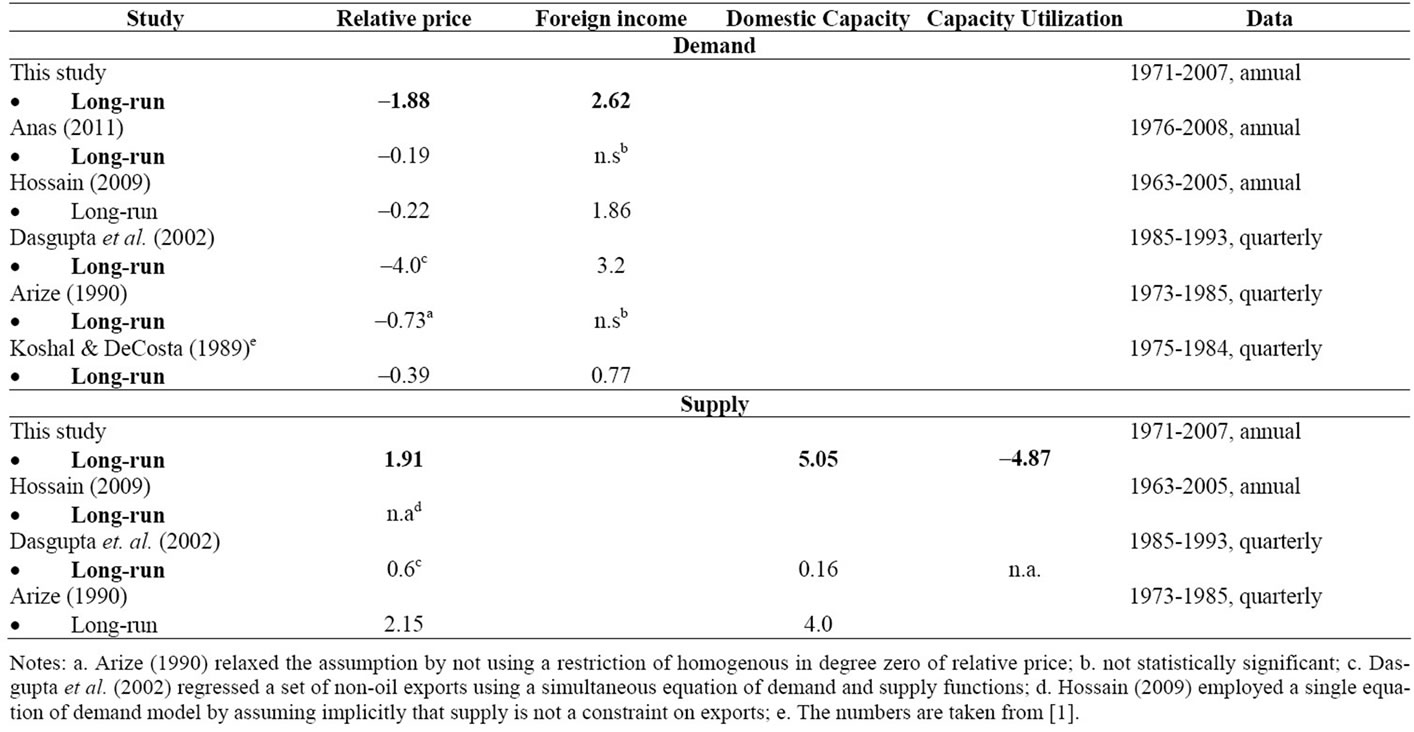
Table 4. Comparison of elasticities of demand and supply for Indonesia’s exports.
may inhibit exports. Some are included high lending interest; insolvent banking sector; domestic credit crunch; capital flows from export sector; and notwithstanding some political unrest that depress business certainty level.22 Dummy oil price shocks positively affect to exports price. This is plausibly due to, despite of growing significance of manufacturing exports commodities, oil and gas exports still comprised for one-quarter of total Indonesia’s exports. From supply perspective, oil price significantly contributes to production cost of exportable since an increase in oil (fuel) and gas price will induce other prices of factor input to rise. Statistics of Indonesia (2008) recorded CPI (WPI) by commodity on gas and fuel of 152.64 (243) was higher than national CPI (WPI) of 150.55 (195) during 2007 (2002 = 100).
Policy Implications
The above mentioned empirical results address some policy implications. Since demand is price-elastic, pricebased measures are worth pursuing to maintain export competitiveness. Conversely, if price competitiveness is weakened, Indonesia will suffer from a large decline in the volume of exports. Thus, exchange rate management becomes one of critical measures in maintaining export competitiveness. Competitive exchange rate management can be conducted through effective & prudent macroeconomic policy. [5], among others, emphasizes on the disciplined economic policies and managed-inflation monetary policy to maintain competitive exchange rate management.
In addition, the highly elastic price elasticity of demand also implies that GOI should facilitate the industrialization process particularly in exports sectors towards human-capital based products and remain less dependent on resource based/standardized manufactured products. This requires Indonesia to devise a long-term strategy aimed to improve the quality of Indonesia’s exportables. In so doing, GOI may encourage the adaptation of better technology and persistently deliver continuous supports to business climate, all of which can facilitate the productivity improvement in exports sector. These efforts can be pursued simultaneously with an encouragement of foreign investment in moderately high-value-added industries. Apart from price, world income growth will also lead to large increase in demand for Indonesia exports. In the event of a slowdown in world income growth, Indonesia can still maintain high growth of exports by improving competitiveness. Despite of the significant impact of world economic shocks to export demand that has to be taken into account, Indonesia is worth seeking an alternative to maintain export performance through diversification and expansion of export markets.
The significances of demand and supply price elasticity as well as secular and cyclical movements imply that both foreign and domestic demands play roles in determining the performance of Indonesia exports. Higher magnitude of secular income than that of cyclical income implies that export is more attributed to productive capacity. Higher magnitude of price elasticity of supply than that of demand suggest that Indonesia export are more supply-determined. This supports previous conjectures arguing that supply side rather than demand side is the more relevant determinants of Indonesia’s exports. Based on all these evidences, GOI should facilitate the improvement on productivity of factor inputs by removing economic bottlenecks, providing more attention on the improvement of infrastructures condition, and facilitating investment in export sector to boost export performance.
5. Concluding Remarks
In this paper, we investigate the aggregate export demand and supply behavior in Indonesia for the period of 1971- 2007. In contrast with some previous studies that treat one function by assumption, we explicitly deal with simultaneity between exports quantity and price by employing a simultaneous equation framework. All variables under consideration are significant at least in 5 percent level of significance, and carry expected signs. Our result suggests that relative price and world income are significant factors playing roles in determining demand for Indonesia’s exports. The magnitude of relative price and income elasticities both are higher than one implying that world demand for exports are highly responsive to price and income. Exports price also significantly contributes to the long-run supply for Indonesia exports, whose magnitude of elasticity are higher than that of demand. This supports previous conjectures arguing that supply side rather than demand side is the more relevant determinants for Indonesia export performance. The attempt to dissect income into secular and cyclical movements enables us to test for domestic demand pressure hypothesis. Our result indicates that productive capacity and capacity utilization rate have significant impact on supply of Indonesia’s exports. Statistically, the estimated coefficients are stable over the period under study and all findings draw some significant policy implications including macroand microeconomic policies, all of which are crucial to maintain and improve the demand and supply of Indonesia’s exports. Nevertheless, since this study is performed based on aggregated data, it might be useful for future research to extend the analysis to see the behavior and determinants of exports by employing more disaggregated data.
6. Acknowledgements
We express our sincere gratitude to the conference participants of the Singapore Economic Review (SER) Conference 2011 for their critical comments and discussion on preliminary version of this paper. Any remaining errors are completely ours.
REFERENCES
- R. K. Koshal, V. S. Shukla and G. P. Koirala, “Demand and Supply of Indian Exports: A Simultaneous Equation Approach,” Journal of Asian Economics, Vol. 3, No. 1, 1992, pp. 73-83. doi:10.1016/1049-0078(92)90005-J
- H. S. Houthakker and S. P. Magee, “Income and Price Elasticities in World Trade,” Review of Economics and Statistics, Vol. 51, No. 2, 1969, pp. 111-125. doi:10.2307/1926720
- M. Bahmani-Oskooee, “The Determinants of International Trade Flows,” Journal of Development Economics, Vol. 20, No. 1, 1986, pp. 107-123. doi:10.1016/0304-3878(86)90007-6
- R. Faini, “Export Supply, Capacity and Relative Prices,” Journal of Development Economics, Vol. 45, No. 1, 1994, pp. 81-100. doi:10.1016/0304-3878(94)90060-4
- A. A. Hossain, “Structural Change in the Export Demand Function for Indonesia: Estimation, Analysis and Policy Implications,” Journal of Policy Modeling, Vol. 31, No. 2, 2009, pp. 260-271. doi:10.1016/j.jpolmod.2008.06.003
- M. Goldstein and M. S. Khan, “The Supply and Demand for Exports: A Simultaneous Approach,” Review of Economics and Statistics, Vol. 60, No. 2, 1978, pp. 275-286. doi:10.2307/1924981
- J. A. Dunlevy, “A Test of the Capacity Pressure Hypothesis within a Simultaneous Equations Model of Export Performance,” Review of Economics and Statistics, Vol. 62, No. 1, 1980, pp. 131-135. doi:10.2307/1924281
- R. J. Ball, J. R. Eaton and M. D. Steuer, “The Relationship between U.K. Exports Performance in Manufactures and the Internal Pressures of Demand,” Economic Journal, Vol. 76, No. 303, 1966, pp. 501-518. doi:10.2307/2229518
- M. Goldstein and M. S. Khan, “Income and Price Effects in Foreign Trade,” In: R. Jones and P. Kenen, Eds., Handbook of International Economics, Vol. 2, Elsevier, New York, 1985.
- M. C. Basri and H. Hill, “Ideas, Interest and Oil Prices: The Political Economy of Trade Reform during Suharto’s Indonesia,” The World Economy, Vol. 27, No. 5, 2004, pp. 633-656. doi:10.1111/j.0378-5920.2004.00619.x
- H. Hill, “Indonesia’s Industrial Policy and Performance: Orthodoxy Vindicated,” Economic Development and Cultural Change, Vol. 45, No. 1, 1996, pp. 147-174. doi:10.1086/452261
- R. Rahmaddi and M. Ichihashi, “Exports and Economic Growth in Indonesia: A Causality Approach Based on Multivariate Error Correction Model,” Journal of International Development and Cooperation, Vol. 17, No. 2, 2011, pp. 53-74.
- H. Aswicahyono and M. Pangestu, “Indonesia’s Recovery: Exports and Regaining Competitiveness,” The Developing Economies, Vol. 38, No. 4, 2000, pp. 454-489.
- M. Ishida, “Industrialization in Indonesia Since the 1970s,” IDE-JETRO Research Paper No. 5, Chiba-shi, 2003, pp. 1-65.
- A. A. Hossain, “Macro-Economics Developments, Policies and Issues in Indonesia 1950-2005,” Malaysian Journal of Economic Studies, Vol. 43. No. 1-2, 2006, pp. 19- 67.
- BPS, “Statistics of Indonesia,” BPS, Jakarta, various years.
- R. Siregar and R. S. Rajan, “Impact of Exchange Rate Volatility on Indonesia Trade Performance in the 1990s,” Journal of Japanese International Economics, Vol. 18, No. 2, 2004, pp. 218-240. doi:10.1016/S0889-1583(03)00050-9
- R. Duttagupta and A. Splimbergo, “What Happened to Asian Exports during the Crisis?” IMF Staff Paper, Vol. 51, No. 1, 2004, pp. 72-95.
- P. C. Athukorala, “Post-Crisis Export Performances: The Indonesia Experience in Regional Perspective,” Bulletin of Indonesian Economic Studies, Vol. 42, No. 2, 2006, pp. 172-211. doi:10.1080/00074910600873658
- T. Anas, “Long-Run Determinants of Exports: A Co-Integration Approach,” Proceedings for Development Studies Forum, Jakarta, 11 January 2011.
- A. Arize, “The Supply and Demand for Imports and Exports in Simultaneous Model,” Applied Economics, Vol. 19, No. 9, 1987, pp. 1233-1247. doi:10.1080/00036848700000070
- S. E. Haynes and J. A. Stone, “Secular and Cyclical Responses of U.S. Trade to Income: an Evaluation of Traditional Model,” Review of Economics and Statistics, Vol. 65, No. 1, 1983, pp. 87-95. doi:10.2307/1924412
- F. X. Brown, “Modeling Export Price and Quantities in a Small Open Economy,” Review of Economics and Statistics, Vol. 64, No. 2, 1982, pp. 346-347. doi:10.2307/1924318
- J. Riedel, “The Demand for LDC Exports of Manufactures: Estimates from Hong Kong,” Economic Journal, Vol. 98, No. 389, 1988, pp. 138-148. doi:10.2307/2233515
- R. C. Davidson and J. G. MacKinnon, “The Interpretation of Test Statistics,” Canadian Journal of Economics, Vol. 18, No. 1, 1985, pp. 38-57. doi:10.2307/135112
- A. Arize, “An Econometric Investigation of Export Behavior in Seven Asian Developing Countries,” Applied Economics, Vol. 22, No. 7, 1990, pp. 891-904. doi:10.1080/00036849000000027
- J. U Farley and M. Hinich, “A Test for a Shifting Slope Coefficient in a Linear Model,” Journal of American Statistical Association, Vol. 65, No. 331, 1970, pp. 297-318. doi:10.2307/2284298
- J. U. Farley, M. Hinich, and T.W. McGuire, “Some Comparison of Tests for a Shift in the Slopes of a Multivariate Linear Time Series Model,” Journal of Econometrics, Vol. 3, No. 3, 1975, pp. 297-318. doi:10.1016/0304-4076(75)90037-8
- J. Jongwanich, “Determinants of Export Performances in East and Southeast Asia,” The World Economy, Vol. 33 No, 1, 2010, pp. 20-41. doi:10.1111/j.1467-9701.2009.01184.x
- D. Dasgupta, E. Hulu and B. D. Gupta. “The Determinants of Indonesia’s Non-oil Exports,” In: F. Iqbal and E. J. William, Eds., Deregulation and Development in Indonesia, Preager, Westport, 2002, pp. 71-89.
- LPEM-UI, “Monitoring the Investment Climate in Indonesia: A Report from the Mid 2005 Survey,” LPEM-UI in Collaboration with World Bank, Jakarta, 2005.
- G. Fane and T. Condon, “Trade Reform in Indonesia 1987-1995,” Bulletin of Indonesian Economic Studies, Vol. 32, No. 3, 1996, pp. 33-54. doi:10.1080/00074919612331337018
- International Monetary Fund, “IMF-Supported Programs in Indonesia, Korea, and Thailand: A Preliminary Assessment,” Occasional Paper, IMF, Washington DC, 1999.
- H. Hill, “The Indonesian Economy: Growth, Crisis and Recovery,” The Singapore Economic Review, Vol. 52, No. 2, 2007, pp. 137-166. doi:10.1142/S0217590807002610
- G. Fane, “Indonesia Economic Policies and Performance 1960-1998,” World Economy, Vol. 22, No. 5, 1999, pp. 651-667. doi:10.1111/1467-9701.00223
NOTES
1Some are including [2], [3], and [4]. For the case of Indonesia see [5].
2[11].
3For detailed description in export-oriented industrialization in Indonesia, see [13]; [14]; [15].
4[11]; [14].
5[16].
6[12].
7[14].
8[1] employed 27 annual observations to analyze the demand and supply for India’s exports using simultaneous equation model. [5] and [20] had a sample of 43 and 33 annual observations, respectively, to study price and income effects on exports performance. The sample in the study is comparable to most time series studies related to export determinants.
9Due to the unavailability of production capacity data, following [7] and [21] among others, capacity variable is obtained by fitting time trend of real income. For thorough study of the effects of trend income and capacity utilization on export performance, see [7]. For critical arguments of the use of these variables as well as the time domain method of income decomposition to capture secular and cyclical income movements, one may have interest on [22]. As alternatives, we also considered to fitting the income variable both using Hodrick-Prescott method and by estimating a production function on factor inputs (K and L). Yet, the results of both alternatives did not perform well in the empirical work. Therefore, we use the first method to justify our objecttive.
10We set value of 1 for 1999, zero otherwise.
11Usually, we expect the sign of income elasticity to be positive, yet it is not always to be so. [6] posited that if the exports of a country were simply a residual demand by the rest of the world, then income elasticity might be negative if the increases in world income were attributed with faster growth in production than in the consumption of importables.
12It may be noted that domestic price is considered exogenous in this study since the domestic market is relatively large compared to exports market.
13[13].
14We employ such a normalization procedure as a matter of convenience in the simultaneous system. [6] argue that the estimates of parameters from a system method of estimation are invariant with respect to normalization process.
15In our model specifications, we also consider the ‘small country’ assumption which is well argued by [23] and [24]. In their views, an alternative function could be specified where changes in export quantity are related to excess supply so that excess demand would determine the change in the price of exports. However, our experiment with that alternative model yielded inferior result as compared to the model considered here. In this regards, the structural model used in the current paper suggests that an interpretation of the supply equation as a price-adjustment equation and the demand equation as a volume-adjustment equation is supported by the data. [25] pointed out that one can expect to make valid inferences based on a model that appears to be consistent with the data. In addition, our empirical model specification enables one to test domestic demand pressure hypothesis through export price-channel. Following insights of [6], the alternative adjustment function discussed above should be considered as approximation.
16The mechanics to obtain the final estimation models as well as their reduced forms can be obtained from authors upon a request.
17Study of [29] and data from [15] (various years) indicate that Indonesia exports commodity are shifting continuously from NRI to more manufactured products from minuscule share of 2 percent in 1980 up to 68 percent in 2007. Manufacturing exports are mostly dominated by products of SITC 5 (resource-based), SITC 8 (clothing and footwear), SITC 7 (machinery and transport), and SITC 6 (chemical), respectively.
18There are sparse estimates of export supply elasticity available in the literature for Indonesia case as comparison to our supply estimates. Some, among others, are including [26] and [30]. We provide a summary of exports elasticitities of some previous studies in Table 4.
19In a survey conducted in 2005, it revealed that firms lose about 6 percent of their potential output due to electrical power shortages.
20[32].
21[33,34].
22[12,17,35].