Journal of Biophysical Chemistry
Vol.3 No.3(2012), Article ID:21944,11 pages DOI:10.4236/jbpc.2012.33028
Homology modeling and structural analysis of human γ-glutamylcysteine ligase catalytic subunit for antitumor drug development
![]()
1Department of Pharmacy, Faculty of Pharmacy, Meijo University, Nagoya, Japan; *Corresponding Author: hyamagu@meijo-u.ac.jp
2Department of Pharmacy, Faculty of Pharmaceutical Sciences, Aomori University, Aomori, Japan
3Laboratory of Food Chemistry, Department of Life Sciences, Junior College, Gifu Shotoku Gakuen University, Gifu, Japan
Received 25 April 2012; revised 14 May 2012; accepted 22 May 2012
Keywords: Antitumor Drug; GCLC; MOE
ABSTRACT
Homology modeling and structural analysis of human glutamate cysteine ligase catalytic subunit (hGCLC) were performed with a software package the Molecular Operating Environment. A yeast GCLC (yGCLC; PDB code: 3LVV) was selected as a template for the 3D structure modeling of hGCLC. The modeled hGCLC showed significant 3D similarities at the ligand biding site (LBS) to the yGCLC structure. The contact energy profiles of the hGCLC model were in good agreement with those of the yGCLC structure. Ramachandran plots revealed that only 1.4% of the amino acid residues were in the disfavored region for hGCLC. The molecular electrostatic potential (MEP) map of the hGCLC model exhibited that the model was slightly different from the yGCLC model electrostatically at the LBS. Further, docking simulations revealed the similarity of the ligand-receptor bound location between the hGCLC and yGCLC models. The different binding orientations between the glutathione (GSH)-hGCLC and GSH-yGCLC complexes reflected the different MEP maps at the LBSs between the hGCLC and yGCLC models. These results indicate that the hGCLC model was successfully modeled and analyzed. To the best of our knowledge, this is the first report of a hGCLC model with detailed analyses, and our data verify that the model can be utilized for application to target hGCLC for the development of anticancer drugs.
1. INTRODUCTION
Glutamate cysteine ligase (GCL) is an enzyme that catalyzes the initial and rate-limiting step of glutathione (GSH) biosynthesis [1,2]. In the synthesis of the tripeptide GSH, the ATP-dependent mechanism proceeds via a γ-glutamylphosphate intermediate [2-4] with a subsequent nucleophilic attack by the α-amino group of l-cysteine to produce the dipeptide γ-glutamylcysteine [1,2]. Glutathione synthetase couples the resulting γ-glutamylcysteine to l-glycine to generate reduced GSH, an abundant cellular reducing agent [1]. GSH is the major low molecular weight cellular thiol and reduced GSH is present in most cell types at millimolar levels, whereas the oxidized form glutathione disulfide is less abundant. GSH plays roles in many cellular functions, such as maintenance of reduced protein thiols, detoxification of hydrogen peroxide and lipid peroxides, secondary metabolism and non-enzymatic scavenging of free radicals [5]. GSH also protects against apoptotic cell death following exposure to antineoplastic agents, radiation and receptorbased death signals [6-10].
GCL activity is modulated by free l-cysteine availability [11], transcriptional regulation [12] and post-translational modifications [13]. Because of its central role in GSH homeostasis, GCL is an attractive target for antitumor drug development. Upregulation of GCL catalytic subunit (GCLC) mRNA and GCL activity have been frequently observed in cells derived from human tumors resistant to chemotherapeutic agents [14-16]. Increased production of GSH protects against reactive oxygen and nitrogen species [5,17] and facilitates detoxification of electrophilic xenobiotics by the GSH S-transferases [18]. It has been reported that drug resistance in tumors can be overcome by the administration of the GCL inhibitor L-buthionine-S,R-sulfoximine (BSO) [19], which subsequently depletes GSH and sensitizes the tumor cells to radiation treatment and chemotherapy.
Our previous study revealed that GSH could be an important factor for the selective toxicity toward central nervous system-derived tumor cells [20], which suggests that targeting the key enzyme for GSH homeostasis, namely GCL, with highly selective inhibitors could be utilized for controlling the development and progression of cancer. GCL is a heterodimeric enzyme with a 73-kDa catalytic subunit and a 31-kDa modifier subunit, and GCLC contains the glutamate, cysteine and ATP binding sites and has catalytic activity even as a monomer [1,21]. Thus, structural analysis of GCLC with its possible inhibitory ligands could be of importance for successful antitumor drug development. Although a few GCLC models have been publicized [22,23], no human GCLC (hGCLC) model has been reported to the best of our knowledge. Molecular modeling has found widespread utility in the field of drug development [24-26], and in the present study we will report the homology modeling and structural analysis of hGCLC by a highly sophisticated software package, the Molecular Operating Environment (MOE) 2010.10 (Chemical Computing Group Inc., Montreal, Canada).
2. COMPUTATIONAL METHODS
2.1. Homology Modeling of hGCLC
Homology modeling of hGCLC was executed as previously reported [27]. In brief, the hGCLC (NCBI reference sequence: NP_001489.1) [28] sequences and the crystal structure coordinates of yeast GCLC (yGCLC; PDB code: 3LVV) [23] were loaded into the MOE. The primary structures of hGCLC and yGCLC were aligned, carefully checked to avoid deletions or insertions in conserved regions and corrected wherever necessary. A series of hGCLC models were independently constructed with the MOE using a Boltzmann-weighted randomized procedure [29] combined with specialized logic for the handling of sequence insertions and deletions [30]. The models with the best packing quality function were selected for full energy minimization and further inspection.
2.2. Assessment of the Modeled Structure
The qualities of the protein folds of the hGCLC homology model were evaluated with the MOE by calculating the effective atomic contact energies, comprising the desolvation free energies required to transfer atoms from water to the interior of the protein [31]. Briefly, the contact desolvation energies were calculated for 18 different atom types of the 20 common amino acids that were resolved based on the clustering pattern of their properties. The contact potentials for each atom type were measured within a contact range of 6 Å by explicitly accounting for neighboring interactions. The overall geometric and stereochemical qualities of the final modeled structure of hGCLC were examined using Ramachandran plots generated within the MOE [32,33].
2.3. Molecular Electrostatic Potential (MEP) Mapping
Electrostatic potential surfaces were calculated by solving the nonlinear Poisson-Boltzmann equation using a finite difference method as implemented in the MOE. The molecular electrostatic interactions form a crucial part of the non-covalent interaction energy between the molecules. The MEP on a molecular surface can be used to visually compare different molecules, analyze docking studies and identify sites that interact with ligands. For example, the surface MEP was utilized to relate a nucleotide mutation with the potential values [34]. In the present study, the MEP was colored in deep blue to indicate the most positive potential and in deep red to represent the most negative potential.
2.4. Binding Site Selection and Exploration
The binding site selection and exploration for hGCLC was executed as previously reported [27]. In brief, the Site Finder module of the MOE was used to identify possible substrate-binding pockets within the newly generated 3D structures of hGCLC. Hydrophobic or hydrophilic alpha spheres served as probes denoting zones of tight atom packing. These alpha spheres were utilized to define potential ligand-binding sites (LBSs) and as centroids for the creation of dummy ligand atoms [35,36]. The dummy atoms were matched to the corresponding alpha spheres during the characterization of the LBSs in hGCLC. This method generates bound conformations that approach crystallographic resolutions [37].
2.5. Alpha Sphere and Excluded Volume-Based Ligand-Protein Docking (ASE-Dock)
The docking and analysis of the ligand-protein interaction between GSH (or BSO) and hGCLC were also performed with ASE-Dock in the MOE [38]. In the ASEDock module, ligand atoms have alpha spheres within 1 Å. Based on this property, concave models are created and ligand atoms from a large number of conformations generated by superimposition with these points can be evaluated and scored by maximum overlap with alpha spheres and minimum overlap with the receptor atoms. The scoring function used by ASE-Dock is based on ligand-protein interaction energies and the score is expressed as a Utotal value. The ligand conformations were subjected to energy minimization using the MMF94S force field [39]. From the resulting 500,000 poses, the 200 poses with the lowest Utotal values were selected for further optimization with the MMF94S force field. During the refinement step, the ligand was free to move within the binding pocket.
3. RESULTS AND DISCUSSION
3.1. Homology Modeling of the hGCLC Structure
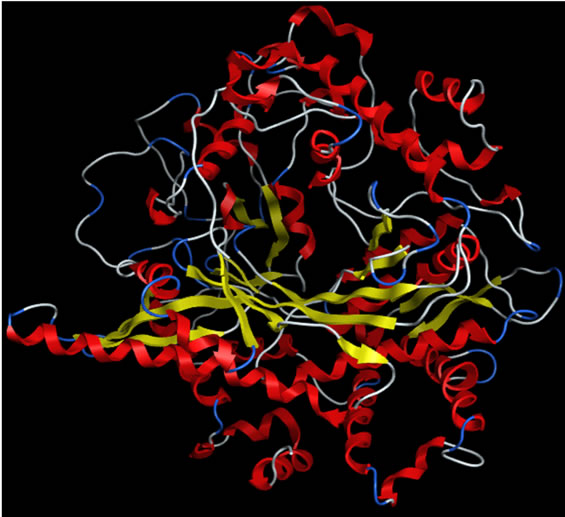
The sequence alignment of GLCL is shown in Figure 1. The alignment revealed that the critical active site residues Glu52 and Glu103 [40] were conserved in yGCLC and hGCLC. yGCLC (PDB code: 3LVV) was selected as a template (Figure 2(a)) for the present 3D structure modeling of hGCLC because of its good crystal structure resolution (2.2 Å) and its information was the latest (from 2010) [23]. The % sequence identity between yGCLC and hGCLC was 39.7%. For the construction of the hGCLC model, 100 independent models of the target protein were built using a Boltzmann-weighted randomized modeling procedure in the MOE that was adapted from reports by Levitt [29] and Fechteler et al. [30]. The intermediate models were evaluated by a residue packing quality function, which is sensitive to the degrees to which non-polar side-chain groups are buried and hydrogen bonding opportunities are satisfied. The hGCLC model with the best packing quality function and full energy minimization was utilized in the present study (Figure 2(b)). The relatively few β-sheets in the hGCLC model is probably due to the differences in the residues between yGCLC and hGCLC, such as Thr91-Arg94 and Glu137-Cys142 (in hGCLC) that could not form hydrogen bonds with adjacent structures to create β-sheets.
3.2. Analysis of the Contact Energies for the hGCLC Model
As reported by Zhang et al. [31], the effective atomic contact energies were calculated using the MOE for heavy atoms of standard amino acids within a contact range of 6 Å, assigning energy terms in kcal/mol for each contact pair. These energies were summed for each resi
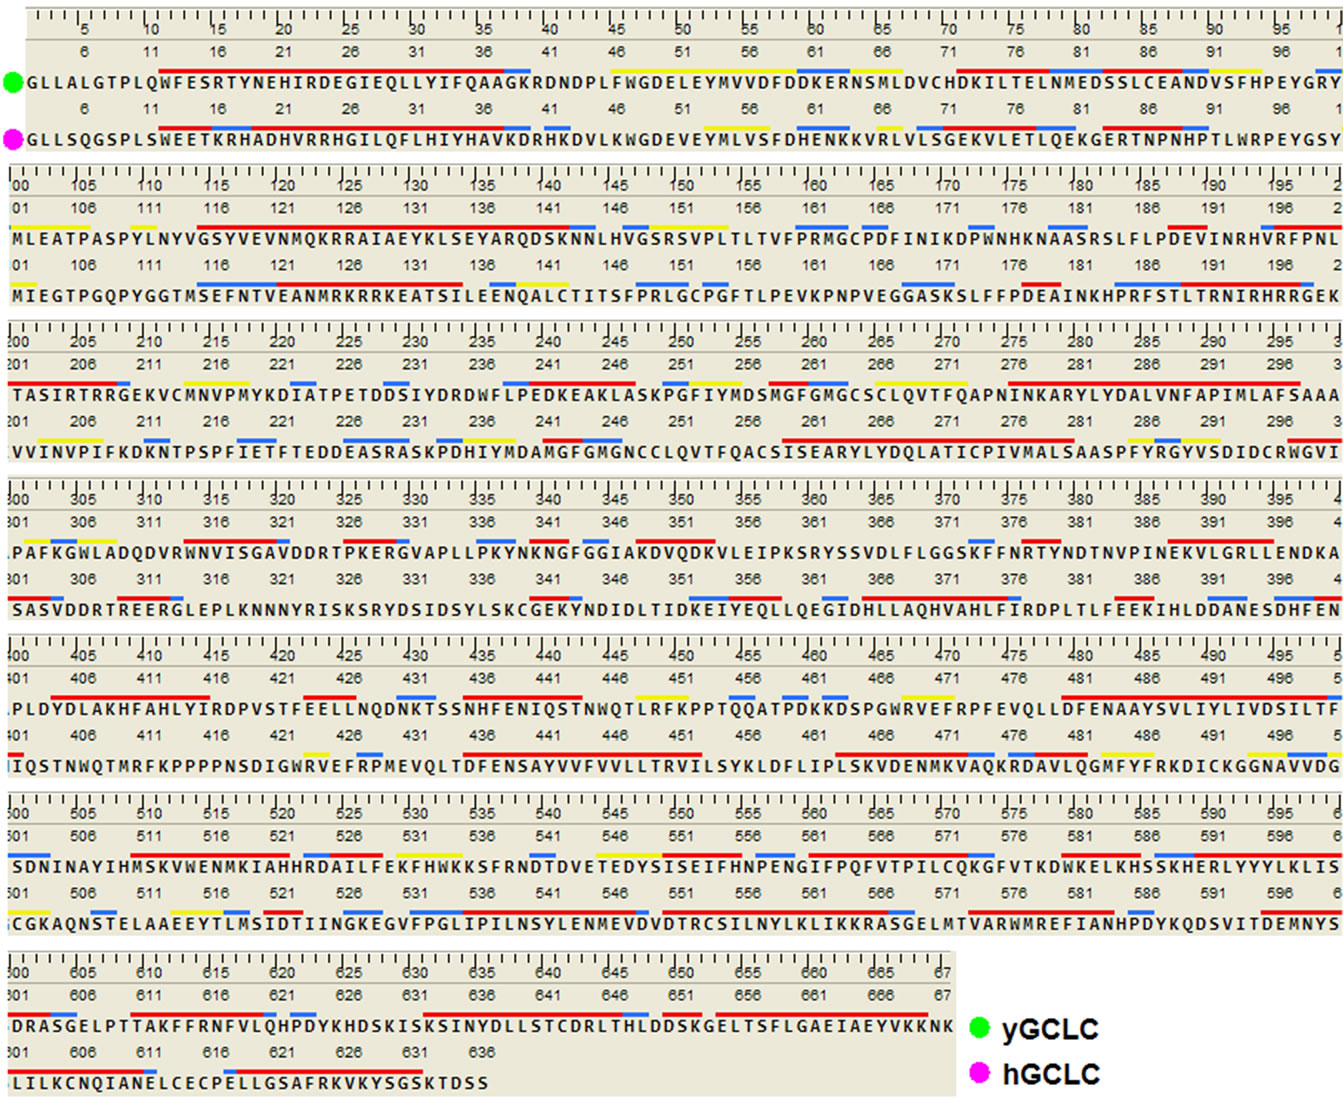
Figure 1. Evaluation of the 2D structures of the hGCLC model. Homology-aligned sequences of yGCLC (PDB code: 3LVV; green) and hGCLC (magenta). Red line: α-helix; Blue line: turn; Yellow line: β-sheet.
 (a)
(a)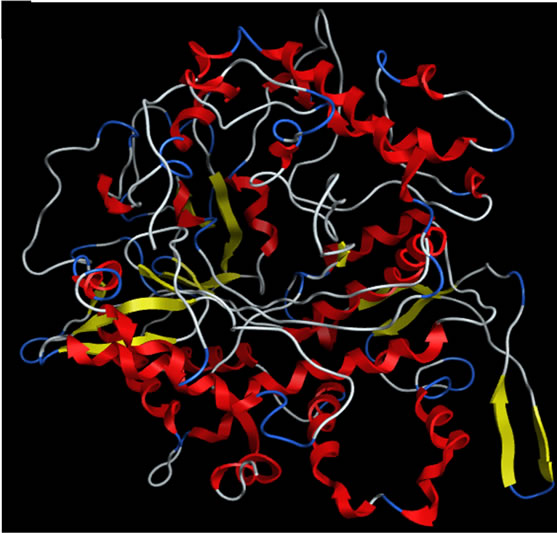 (b)
(b)
Figure 2. The secondary structures of the GCLC models. Upper panel: yGCLC (PDB code: 3LVV). Lower panel: hGCLC.
due, and in general, a large negative value indicated that the residue was predominantly in contact with hydrophobic atoms and therefore expected to be in a buried protein environment. Conversely, residues with positive energy terms indicated contacts with predominantly hydrophilic atoms, and were expected to be in more solvent-exposed regions of the proteins. The contact energy profiles of the homology-modeled hGCLC (Figure 3(b)) were compared with those of the X-ray structure of yGCLC (Figure 3(a)). Although 5 out of 36 residues at the LBSs had differently charged contact energies, such as His94 (yGCLC; –3.4 kcal/mol) and Arg94 (hGCLC; 3.3 kcal/mol), most residues had quite similar contact ener gies, such as Phe271 (yGCLC; –19.8 kcal/mol) and Phe254 (hGCLC; –20.1 kcal/mol), and the trends of the variation in the contact energy in most parts of the hGCLC model
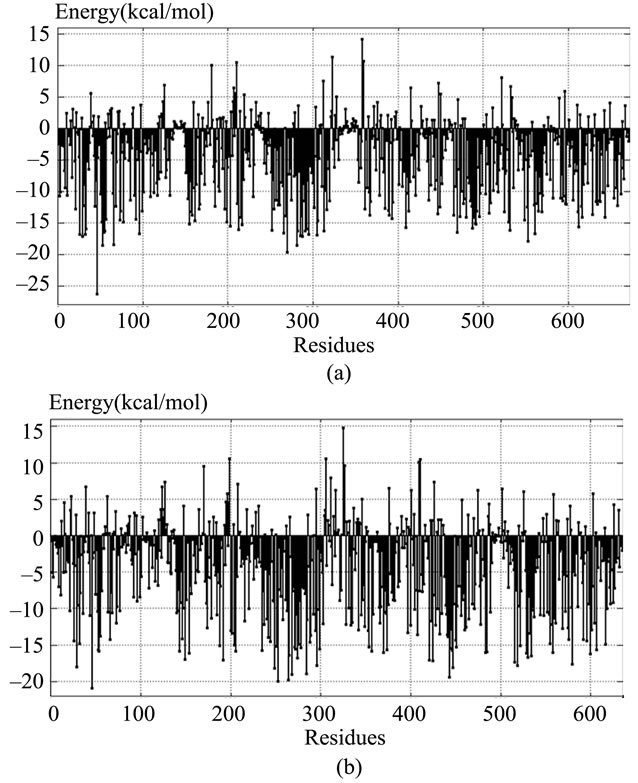
Figure 3. Contact energy profiles of the GCLC models. (a) yGCLC (PDB code: 3LVV); (b) The constructed hGCLC model. The positions of the amino acid residues are shown on the x-axis, while the contact energies are shown on the y-axis.
were in good agreement with those of the X-ray structure of yGCLC.
3.3. Evaluation of the Stereochemical Qualities of the hGCLC Model
The phi and psi backbone dihedral angles for hGCLC were scored using 2D probability distributions calculated on a high-resolution collection of X-ray structures containing approximately 100,000 residues from 500 protein structures [41]. Each probability distribution was estimated with 2-degree spacing for each of the phi and psi backbone dihedral angles with separate histograms for preproline, proline, glycine and general amino acids. The stereochemical qualities of the hGCLC model were assessed by Ramachandran plots (Figure 4). 86.2% of the residues were in the favored region, 12.4% were in the allowed region and only 1.4% were in the disfavored region. These results indicate that the phi and psi backbone dihedral angles in the hGCLC model are reasonably accurate.
3.4. Structural Comparisons of the GCLC Models
The GCLC sequences were realigned and reinspected with those of other species [42] for the superimposition
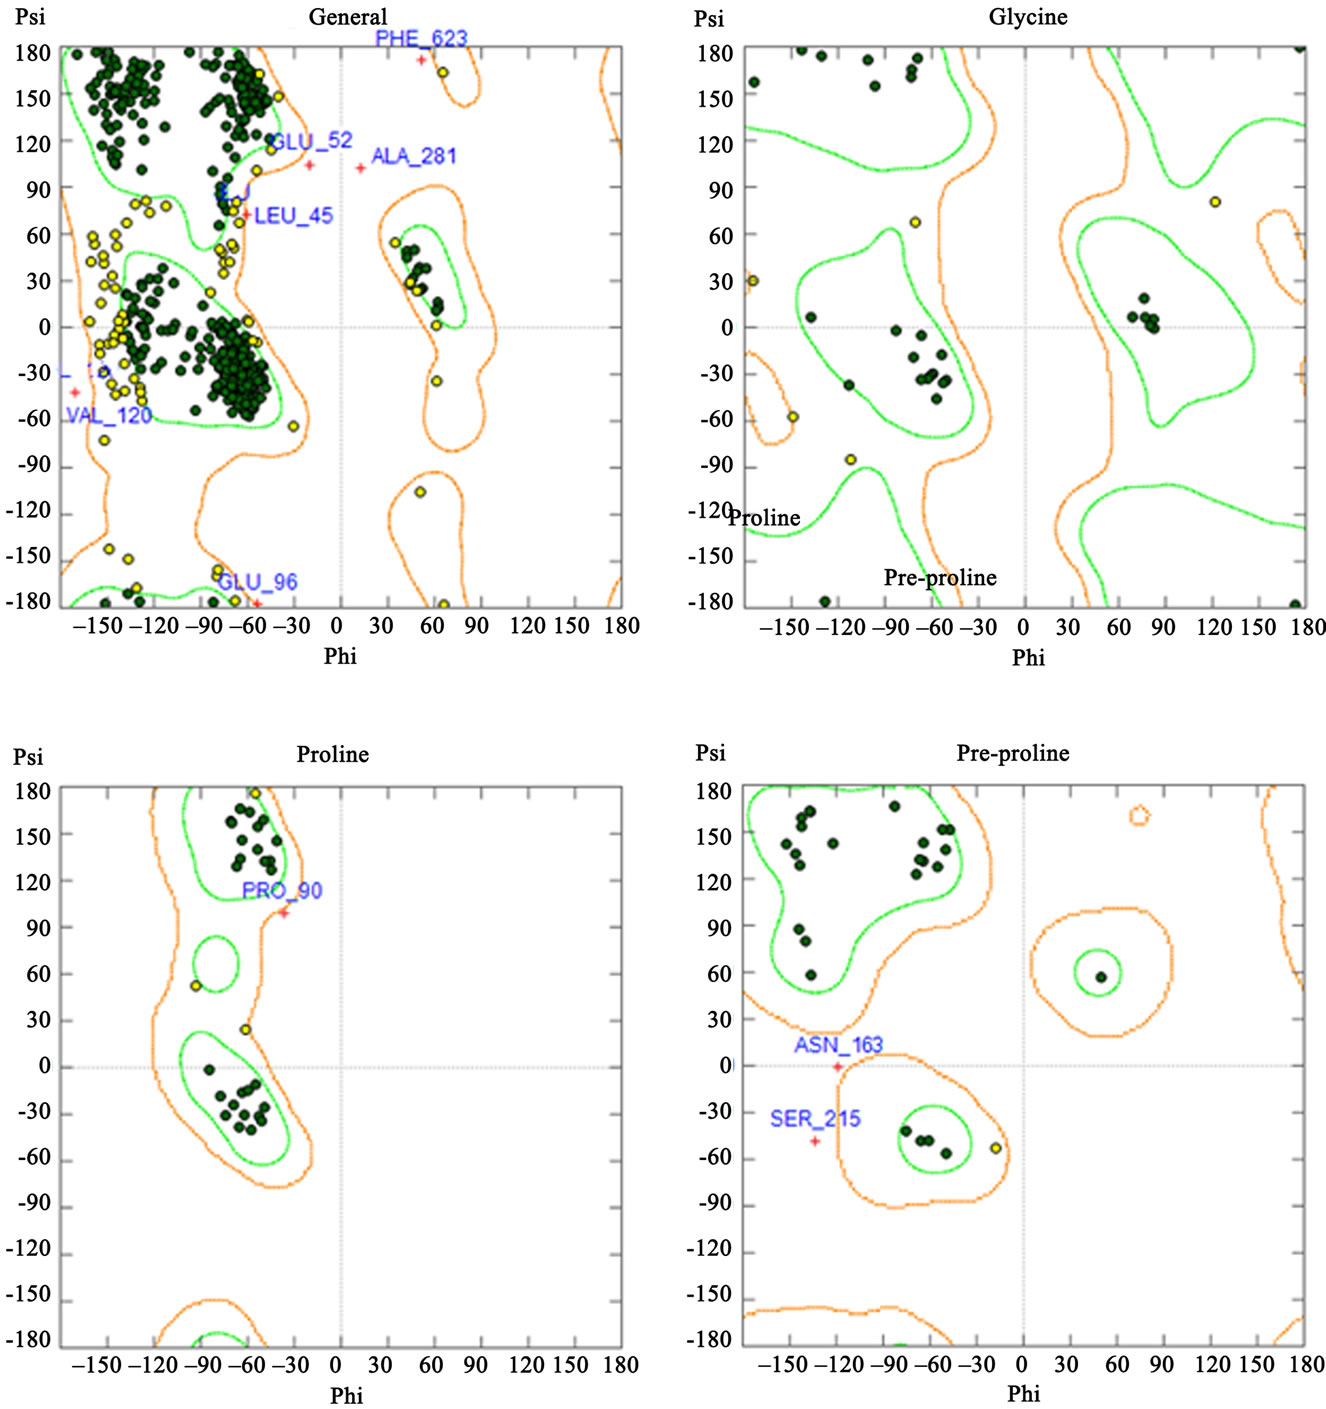
Figure 4. Ramachandran plots for the hGCLS model. Green: favored region; Light-brown: allowed region.
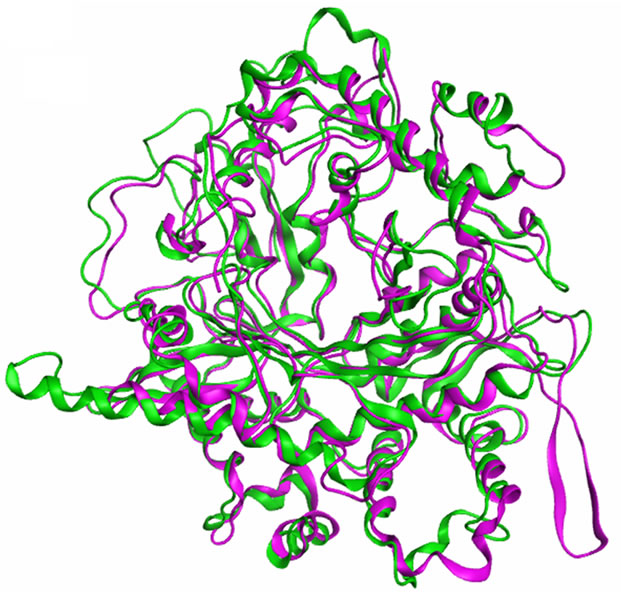
analysis in the MOE (Figure 5). Root mean square deviation (RMSD) values between the main chain atoms of the yGCLC (3LVV) vs hGCLC after main chain fit were 1.83 Å. RMSD values for each residue were also analyzed. The RMSD values for the residues located in the LBS were about 2 Å or less (Figure 6). A superimposition of the template yGCLC (green) and hGCLC (magenta) models revealed that the GCLC models exhibited significant 3D similarities (Figure 7(a)). They also presented similar structures at their LBSs (Figure 7(b)).
3.5. The MEP Maps for the GCLC Models at LBSs
The MEP maps can play a vital role on analyses and predictions of molecular interactive behaviors and properties. For instance, they can be used to compare two molecules visually, which helps in identifying sites that act attractively on ligands by matching opposite electrostatics. Electrostatic interactions are one of the main parts of the interaction energy between ligands and receptors, and govern the strength of non-bonded interactions and
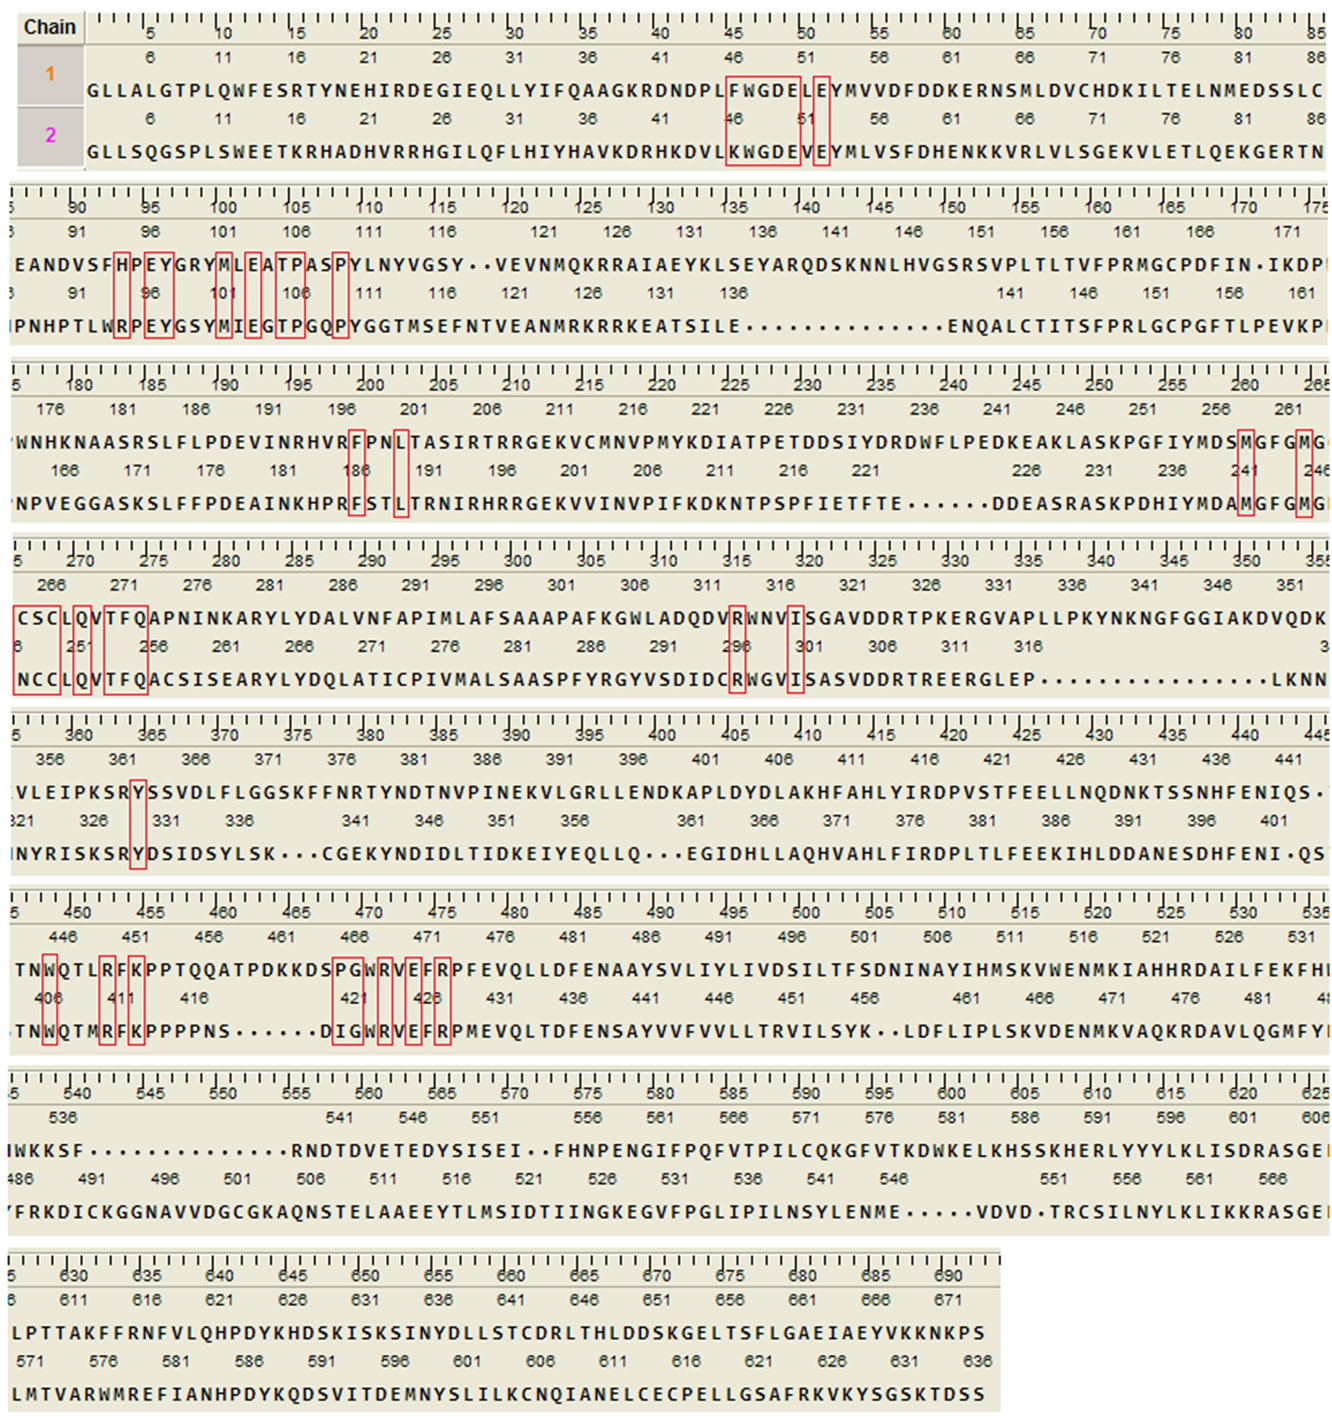
Figure 5. Realigned GCLC sequences for the superimposition analysis. Residues in the LBS are enclosed in red rectangles. Upper sequence: yGCLC (PDB code: 3LVV); Lower sequence: hGCLC.
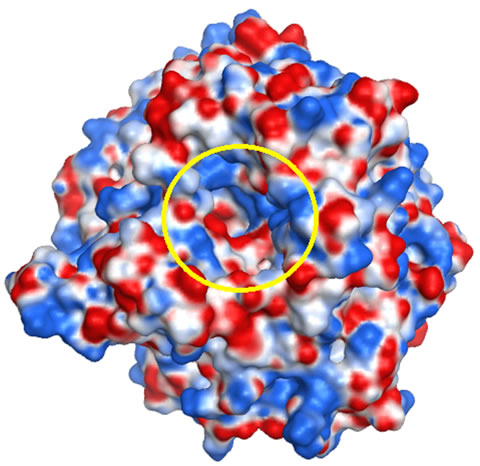
molecular reactivity. In the case of a ligand-receptor interaction at the catalytic site, the ligand experiences a unique environment in terms of the electrostatic, steric and hydrophobic properties. Variations in these properties near the catalytic site of receptors can contribute to their selectivity/specificity [43]. The MEP maps of the GCLC models are shown in Figure 8. The hGCLC model had a positive potential at the LBS (colored in blue, Figure 8(b)), which indicates that hGCLC possibly attracts negatively charged parts of ligands at the LBS. On the other hand, the yGCLC model had a negative potential at the LBS (colored in red, Figure 8(a)). Although the sequence identity of the LBS between hGCLC and yGCLC was 86%, the MEP maps were different possibly due to the structural differences at and adjacent to the LBSs. These results suggest that binding orientations of ligands at the LBS can be different between hGCLC and yGCLC.
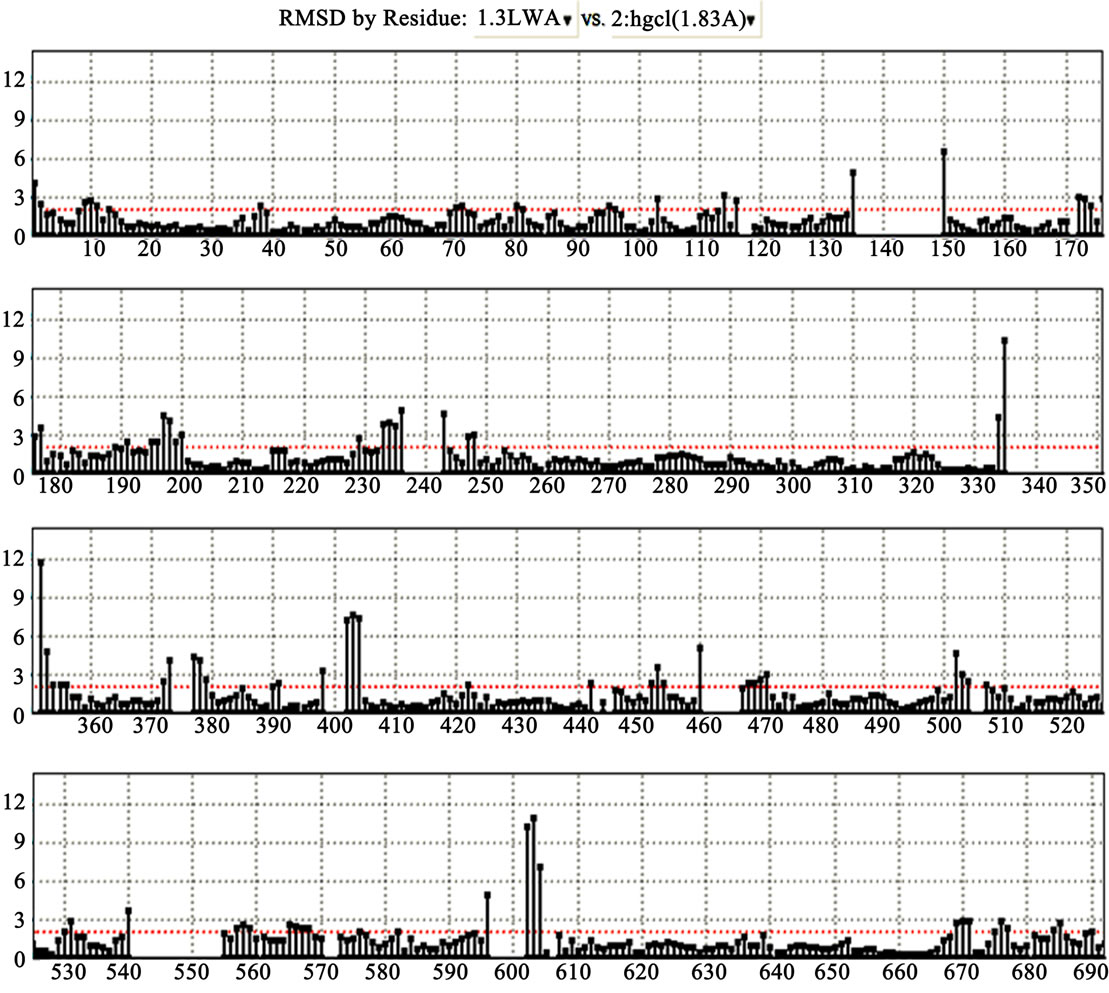
Figure 6. RMSD values between the main chain atoms of the yGCLC (3LVV) vs hGCLC after main chain fit. The positions of the amino acid residues are shown on the x-axis, while the RMSD values are shown on the y-axis.
 (a)
(a)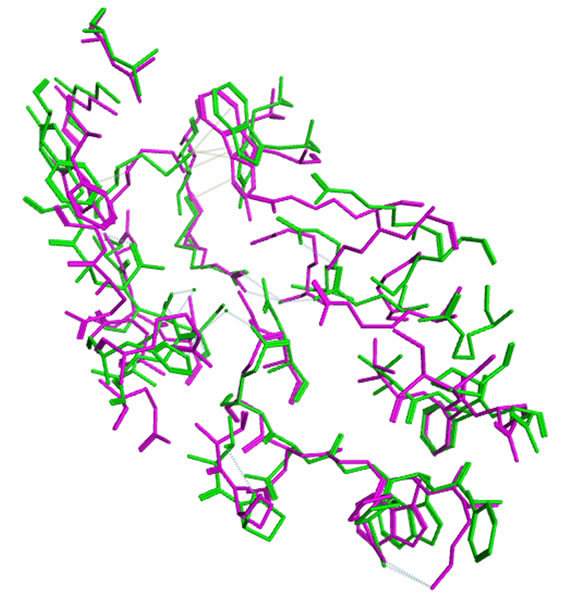 (b)
(b)
Figure 7. Structural comparison of the GCLC models. (a) A superimposition of the template yGCLC (green) and hGCLC (magenta) models; (b) A superimposition of the yGCLC (green) and hGCLC (magenta) models at the LBSs.
 (a)
(a)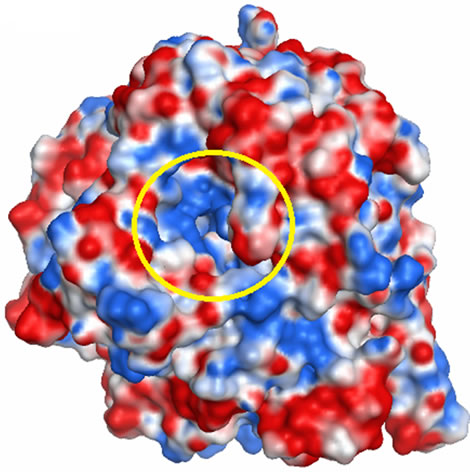 (b)
(b)
Figure 8. The MEP maps for the GCLC models. (a) The MEP map for the yGCLC model; (b) The MEP map for the hGCLC model. Arrow: LBS. Deep blue: Most positive potential. Deep red: Most negative potential. The LBSs are enclosed in a yellow circle.
3.6. Docking Simulations of GSH to GCLC
It has been reported that GCL is feedback regulated by the end product, GSH. GSH inhibits GCL by competing with L-glutamate [44], suggesting that the two binding sites are coincident. Further studies with GSH analogues such as ophthalmic acid, S-methylglutathione, and glutathione disulfide have demonstrated that the free thiol group of GSH is necessary for maximal inhibition [1,44]. However, the precise mode of GSH binding is unknown. The ASE-Dock was performed to evaluate the present docking simulation and showed that GSH bound at the LBS but had a slightly different binding orientation between the yGCLC (Figure 9(a)) and hGCLC (Figure 9(b)) models. The similarity of the bound location at the LBS between the docked GSH-yGCLC pose and the hGCLC model suggests that the present methods are capable of generating the GSH-hGCLC model similar to
 (a)
(a)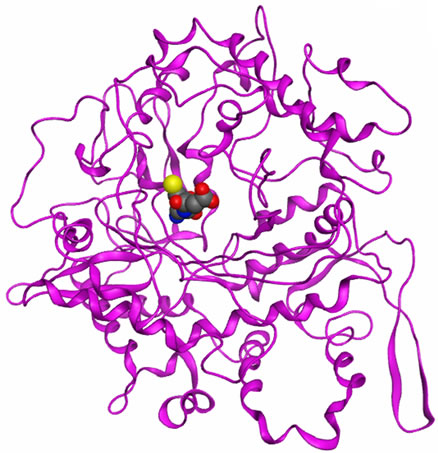 (b)
(b)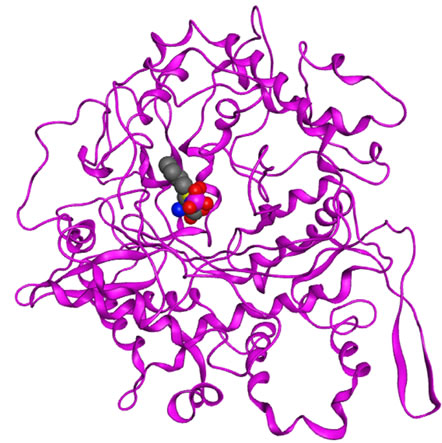 (c)
(c)
Figure 9. Docking simulations of GSH and BSO-P to the GCLC models. (a) ASE-Dock of GSH for yGCLC; (b) ASEDock of GSH for hGCLC; (c) ASE-Dock of BSO-P for hGCLC. Blue, nitrogen; gray, carbon; magenta, phosphorus; red, oxygen and yellow; sulfur.
the reported near-native GCLC complex. The results of the slightly different binding orientations of GSH between GSH-yGCLC and GSH-hGCLC complexes reflected the different MEP maps at the LBSs in the GCLC models. This also suggests that the homology modeling of hGCLC and the docking simulations in the present study were performed reasonably well. Further, a clinically available specific GCL inhibitor BSO in the phosphorylated form (BSO-P) was docked to the hGCLC model (Figure 9(c)). The bound location of BSO-P in hGCLC was similar to that of GSH at the LBSs in the yGCLC and hGCLC models, which further indicates the accuracy of the present docking simulation.
4. CONCLUSION
Examination of the hGCLC structures provides considerable insight into the catalytic mechanism of the enzyme and suggests approaches by which GCL inhibitors with greater selectivity may be attainable. The analysis of the GSH-binding region in hGCLC revealed that a subtle difference of the GSH binding orientation can be found between species. Consequently, the location of the ligand possibly influences the physico-chemical properties of the LBS in the enzyme and has some effects on the binding of the inhibitor to the enzyme. Thus, detailed analysis of the ligand-protein interaction is of great significance in designing in silico hGCLC-inhibiotor models for successful development of antitumor drugs. The main objective in the present study was to create a hGCLC model. Analyses of the structural properties of the hGCLC and the docking simulations of the GSH-hGCLC pose suggest that the present methods are capable of generating the hGCLC model similar to the nearnative yGCLC. Consequently, it is proposed that the hGCLC in the present study will be suitable for further insilico structure-based de novo drug design. Furthermore, to the best of our knowledge, this is the first report of a hGCLC model.
5. ACKNOWLEDGEMENTS
This study was partially supported by a grant-in-aid from the Promotion and Mutual Aid Corporation for Private Schools of Japan.
REFERENCES
- Griffith, O.W. and Mulcahy, R.T. (1999) The enzymes of glutathione synthesis: Gamma-glutamylcysteine synthetase. Advances in Enzymology and Related Areas of Molecular Biology, 73, 209-267. doi:10.1002/9780470123195.ch7
- Orlowski, M. and Meister, A. (1971) Partial reactions catalyzed by γ-glutamylcysteine synthetase and evidence for an activated glutamate intermediate. The Journal of Biological Chemistry, 246, 7095-7105.
- Strumeyer, D.H. and Bloch, K. (1960) Some properties of gamma-glutamylcysteine synthetase. The Journal of Biological Chemistry, 235, PC27.
- Yip, B. and Rudolph, F.B. (1976) The kinetic mechanism of rat kidney gamma-glutamylcysteine synthetase. The Journal of Biological Chemistry, 251, 3563-3568.
- Meister, A. and Anderson, M.E. (1983) Glutathione. Annual Review of Biochemistry, 52, 711-760. doi:10.1146/annurev.bi.52.070183.003431
- Forman, H.J., Liu, R. and Shi, M.M. (1995) Glutathione synthesis in oxidative stress. In: Packer, L. and Cadenas, E., Eds., Biothiols in Health and Disease, Marcel Dekker, New York, 189-212.
- Hall, A.G. (1999) The role of glutathione in the regulation of apoptosis. European Journal of Clinical Investigation, 29, 238-245. doi:10.1046/j.1365-2362.1999.00447.x
- Meister, A. (1991) Glutathione deficiency produced by inhibition of its synthesis, and its reversal; applications in research and therapy. Pharmacology & Therapeutics, 51, 155-194. doi:10.1016/0163-7258(91)90076-X
- Manna, S.K., Kuo, M.T. and Aggarwal, B.B. (1999) Overexpression of gamma-glutamylcysteine synthetase suppresses tumor necrosis factor-induced apoptosis and activation of nuclear transcription factor-kappa B and activator protein-1. Oncogene, 18, 4371-4382. doi:10.1038/sj.onc.1202811
- Botta, D., Franklin, C.C., White, C.C., Krejsa, C.M., Dabrowski, M.J., Pierce, R.H., Fausto, N. and Kavanagh, T.J. (2004) Glutamate-cysteine ligase attenuates TNF-induced mitochondrial injury and apoptosis. Free Radical Biology & Medicine, 37, 632-642. doi:10.1016/j.freeradbiomed.2004.05.027
- Tateishi, N., Higashi, T., Shinya, S., Naruse, A. and Sakamoto, Y. (1974) Studies on the regulation of glutathione level in rat liver. The Journal of Biological Chemistry, 75, 93-103.
- Wild, A.C. and Mulcahy, R.T. (1999) Pyrrolidine dithiocarbamate up-regulates the expression of the genes encoding the catalytic and regulatory subunits of gammaglutamylcysteine synthetase and increases intracellular glutathione levels. Biochemical Journal, 338, 659-665. doi:10.1042/0264-6021:3380659
- Lu, S.C. (2009) Regulation of glutathione synthesis. Molecular Aspects of Medicine, 30, 42-59. doi:10.1016/j.mam.2008.05.005
- Godwin, A.K., Meister, A., O’Dwyer, P.J., Huang, C.S., Hamilton, T.C. and Anderson, M.E. (1992) High resistance to cisplatin in human ovarian cancer cell lines is associated with marked increase of glutathione synthesis. Proceedings of the National Academy of Sciences of the United States of America, 89, 3070-3074. doi:10.1073/pnas.89.7.3070
- Mulcahy, R.T., Bailey, H.H. and Gipp, J.J. (1994) Upregulation of gamma-glutamylcysteine synthetase activity in melphalan-resistant human multiple myeloma cells expressing increased glutathione levels. Cancer Chemotherapy and Pharmacology, 34, 67-71. doi:10.1007/BF00686114
- Mulcahy, R.T., Bailey, H.H. and Gipp, J.J. (1995) Transfection of complementary DNAs for the heavy and light subunits of human gamma-glutamylcysteine synthetase results in an elevation of intracellular glutathione and resistance to melphalan. Cancer Research, 55, 4771-4775.
- Anderson, M.E. (1998) Glutathione: An overview of biosynthesis and modulation. Chemico-Biological Interactions, 111-112, 1-14. doi:10.1016/S0009-2797(97)00146-4
- Townsend, D.M. and Tew, K.D. (2003) The role of glutathione-S-transferase in anti-cancer drug resistance. Oncogene, 22, 7369-7375. doi:10.1038/sj.onc.1206940
- Griffith, O.W. (1982) The Journal of Biological Chemistry, 257, 13704-13712.
- Yamaguchi, H., Yu, T., Noshita, T., Kidachi, Y., Kamiie, K., Yoshida, K., Akitaya, T., Umetsu, H. and Ryoyama, K. (2011) Ligand-receptor interaction between triterpenoids and the 11beta-hydroxysteroid dehydrogenase type 2 (11- betaHSD2) enzyme predicts their toxic effects against tumorigenic r/m HM-SFME-1 cells. The Journal of Biological Chemistry, 286, 36888-36897. doi:10.1074/jbc.M111.265900
- Seelig, G.F. and Meister, A. (1984) Gamma-glutamylcysteine synthetase. Interactions of an essential sulfhydryl group. The Journal of Biological Chemistry, 259, 3534- 3538.
- Biterova, E.I. and Barycki, J.J. (2009) Mechanistic details of glutathione biosynthesis revealed by crystal structures of Saccharomyces cerevisiae glutamate cysteine ligase. The Journal of Biological Chemistry, 284, 32700-32708. doi:10.1074/jbc.M109.025114
- Biterova, E.I. and Barycki, J.J. (2010) Structural basis for feedback and pharmacological inhibition of Saccharomyces cerevisiae glutamate cysteine ligase. The Journal of Biological Chemistry, 285, 14459-14466. doi:10.1074/jbc.M110.104802
- Kurogi, Y. and Guner, O.F. (2001) Pharmacophore modeling and three-dimensional database searching for drug design using catalyst. Current Medicinal Chemistry, 8, 1035-1055.
- Ekins, S. (2004) Predicting undesirable drug interactions with promiscuous proteins insilico. Drug Discovery Today, 9, 276-285. doi:10.1016/S1359-6446(03)03008-3
- Jorgensen, W.L. (2004) The many roles of computation in drug discovery. Science, 303, 1813-1818. doi:10.1126/science.1096361
- Yamaguchi, H., Akitaya, T., Yu, T., Kidachi, Y., Kamiie, K., Noshita, T., Umetsu, H. and Ryoyama, K. (2011) Homology modeling and structural analysis of 11 β-hydroxysteroid dehydrogenase type 2. European Journal of Medicinal Chemistry, 46, 1325-1330. doi:10.1016/j.ejmech.2011.01.054
- Le, T.M., Willis, A.S., Barr, F.E., Cunningham, G.R., Canter, J.A., Owens, S.E., Apple, R.K., Ayodo, G., Reich, D. and Summar, M.L. (2010) An ethnic-specific polymorphism in the catalytic subunit of glutamate-cysteine ligase impairs the production of glutathione intermediates in vitro. Molecular Genetics and Metabolism, 101, 55-61. doi:10.1016/j.ymgme.2010.05.013
- Levitt, M. (1992) Accurate modeling of protein conformation by automatic segment matching. Journal of Molecular Biology, 226, 507-533. doi:10.1016/0022-2836(92)90964-L
- Fechteler, T., Dengler, U. and Schomberg, D. (1995) Prediction of protein three-dimensional structures in insertion and deletion regions: A procedure for searching data bases of representative protein fragments using geometric scoring criteria. Journal of Molecular Biology, 253, 114- 131. doi:10.1006/jmbi.1995.0540
- Zhang, C., Vasmatizis, G., Cornette, J.L. and DeLisi, C. (1997) Determination of atomic desolvation energies from the structures of crystallized proteins. Journal of Molecular Biology, 267, 707-726. doi:10.1006/jmbi.1996.0859
- Bowie, J.U., Lüthy, R. and Eisenberg, D. (1991) A method to identify protein sequences that fold into a known three-dimensional structure. Science, 253, 164-170. doi:10.1126/science.1853201
- Lüthy, R., Bowie, J.U. and Eisenberg, D. (1992) Assessment of protein models with three dimensional profiles. Nature, 356, 83-85. doi:10.1038/356083a0
- Carvajal, C.A., Gonzalez, A.A., Romero, D.G., González, A., Mosso, L.M., Lagos, E.T., del P. Hevia, M., Rosati, M.P., Perez-Acle, T.O., Gomez-Sanchez, C.E., Montero, J.A. and Fardella, C.E. (2003) Two homozygous mutations in the 11 beta-hydroxysteroid dehydrogenase type 2 gene in a case of apparent mineralocorticoid excess. The Journal of Clinical Endocrinology and Metabolism, 88, 2501-2507. doi:10.1210/jc.2002-021909
- Liang, J., Edelsbrunner, H., Fu, P., Sudhakar, P.V. and Subramaniam, S. (1998) Analytical shape computation of macromolecules: I. Molecular area and volume through alpha shape. Proteins, 33, 1-17.
- Liang, J., Edelsbrunner, H., Fu, P., Sudhakar, P.V. and Subramaniam, S. (1998) Analytical shape computation of macromolecules: II. Inaccessible cavities in proteins. Proteins, 33, 18-29.
- Goto, J., Kataoka, R. and Hirayama, N. (2004) Ph4Dock: pharmacophore-based protein-ligand docking. Journal of Medicinal Chemistry, 47, 6804-6811. doi:10.1021/jm0493818
- Goto, J., Kataoka, R., Muta, H. and Hirayama, N. (2008) ASEDock-docking based on alpha spheres and excluded volumes. Journal of Chemical Information and Modeling, 48, 583-590. doi:10.1021/ci700352q
- Halgren, T.A. (1996) Merck molecular force field. I. basis, form, scope, parameterization and performance of MMFF94. Journal of Computational Chemistry, 17, 490-519.
- Abbott, J.J., Pei, J., Ford, J.L., Qi, Y., Grishin, V.N., Pitcher, L.A., Phillips, M.A. and Grishin, N.V. (2001) Structure prediction and active site analysis of the metal binding determinants in gamma-glutamylcysteine synthetase. The Journal of Biological Chemistry, 276, 42099-42107. doi:10.1074/jbc.M104672200
- Lovell, S.C., Davis, I.W., Arendall III, W.B., de Bakker, P.I., Word, J.M. and Prisant, M.G., Richardson, J.S. and Richardson, D.C. (2003) Structure validation by Cα geometry: φ, ψ and Cβ deviation, Proteins, 50, 437-450. doi:10.1002/prot.10286
- Hibi, T., Nii, H., Nakatsu, T., Kimura, A., Kato, H., Hiratake, J. and Oda, J. (2004) Crystal structure of γ-glutamylcysteine synthetase: Insights into the mechanism of catalysis by a key enzyme for glutathione homeostasis. Proceedings of the National Academy of Sciences of the United States of America, 101, 15052-15057. doi:10.1073/pnas.0403277101
- Metropolis, N. and Ulam, S. (1949) The Monte Carlo method. Journal of the American Statistical Association, 44, 335-341. doi:10.1080/01621459.1949.10483310
- Richman, P.G. and Meister, A. (1975) Regulation of gamma-glutamyl-cysteine synthetase by nonallosteric feedback inhibition by glutathione. The Journal of Biological Chemistry, 250, 1422-1426.