Psychology
Vol.08 No.02(2017), Article ID:73740,15 pages
10.4236/psych.2017.82017
Development of Mathematics Motivation across the Transition from Elementary to Junior High School in Japan
Mayumi Oie1, Tsutomu Fujii2
1School of Arts and Sciences, Teacher Training Course, Tokyo Woman’s Christian University, Tokyo, Japan
2Center for Educational Innovation, Nagasaki University, Nagasaki, Japan

Copyright © 2017 by authors and Scientific Research Publishing Inc.
This work is licensed under the Creative Commons Attribution International License (CC BY 4.0).
http://creativecommons.org/licenses/by/4.0/


Received: December 21, 2016; Accepted: January 20, 2017; Published: January 23, 2017
ABSTRACT
This study explored motivation in mathematics across the transition from elementary to junior high school in Japan. The purpose of this study was to develop and assess the modified version of the Mathematics Motivation Scale (MMS) on a Japanese sample to measure the development of MMS longitudinally. The modified MMS measures four subscales: mastery goal, task value, mathematics anxiety, and performance goal. 1519 (Time 1) pupils and students from the fifth to ninth graders, 1238 (Time 2) in eight elementary schools and students in six junior high schools in Tokyo participated in self- reported questionnaire investigation longitudinally. Confirmatory factor analyses revealed the four-factor structure: mastery goal, task value, mathematics anxiety, and performance goal as Oie and Fujie (2007a, 2007b) revealed. The modified MMS exhibited good overall internal consistencies and satisfactory test-retest reliability over three to four months period. The validity of the modified MMS was further demonstrated through inter-correlations between its subscales.
Keywords:
Mathematics Motivation, Mastery Goal, Performance Goal, Task Value, Mathematics Anxiety, School Transition, Explanatory Factor Analysis

1. Introduction
Late childhood and early adolescence are faced with many changes in the stage of development from childhood to adolescence. These challenges are particularly acute during the school transition from elementary to junior high school, represented as academic (e.g. Anderman & Midgley, 1997 ) and as emotional (Romero, Master, Paunesku, Dweck, & Gross, 2014) . Indeed, motivation declines in academic domains in this period have been the center of researchers’ interests, to understand what underlies the motivational landscape of early adolescence (Wang & Pomerantz, 2009) . To this end, educational and developmental researchers have focused on children’s developing psychological needs, changes in their environment, and the fit between the two as they enter adolescence (Eccles, Wigfield, Harold, & Blumenfeld, 1993) . They have repeatedly observed a decline in students’ motivation as they progress through elementary school and high school. In spite that a large amount of research in the educational context has been conducted on motivation, little research has focused on changes in these motivations across the school years (Otis, Grouzet, & Pelletier, 2005) .
The current research investigated the continuity of mathematics motivation in a longitudinal study from late childhood through early adolescence outside of the Western cultural context. The major purpose of the current research was to explore the extent to which school transition from childhood to adolescence accounts for developmental aspects in mathematics motivation. The goal of the current research was to identify developmental aspects of mathematics motivation during late childhood and early adolescence. Relatively few longitudinal studies have examined the development of mathematics motivation over time. In our research, we examined motivational development in mathematics longitudinally across two school years.
1.1. Mathematics Motivation from Childhood to Adolescence
The purpose of the current study was on the development of mathematics motivation during late childhood and early adolescence. As a related construct to mathematics motivation, Wigfield, Eccles, MacIver, Reuman and Midgley (1991) focused on mathematics self-concept and revealed that decrements of mathematics self-concept are partially due to the transition from elementary to middle school. Similarly, a longitudinal study from the elementary, middle through the high school years conducted by Gottfried, Fleming, and Gottfried (2001) found that intrinsic motivation declined substantially for mathematics. As Wigfield et al. (1991) and Gottfried et al. (2001) investigated, our sample made the elementary to middle transition between the sixth and seventh grade, including the fifth, eighth, and ninth grade to explore developmental aspects of mathematics motivation longitudinally. In a study of the sixth and seventh graders, Eccles, Wigfield, Flanagan, Miller, Reuman and Yee (1989) identified that the six-month stability of academic mathematics self-concept decreased during the transition into middle school. In such ways, mathematics self-concept in the transition from childhood through adolescence has been theorized by Eccles and her colleagues over several decades and adopted to motivation theory in educational research and practice.
1.2. Goal Theory and Motivation
The study of motivation has been one of the central research themes in educational and developmental psychology. Numerous motivational constructs give direction to goal-directed activities (Kaplan & Maehr, 2007) . As components of motivational concepts, goal theory and task values (Ames, 1992; Dweck, 1986; Nicholls, 1984; Eccles et al., 1993; Wigfield & Eccles, 2002) have been investigated in the field. Goal theory addresses why students pursue achievements in a school and their own learning context (Dweck, 1986; Nicholls, 1984; Kaplan & Maehr, 2007) . Goal theory is initially based on two achievement goals: one is mastery goals which focused on the acquisition of knowledge and task accomplishment; and another is performance goals which focused on the scores and prizes relative to others (Ames, 1992; Dweck, 1986; Nicholls, 1984) . In the current study, we pick up mastery and performance goals, because achievement goals are related to positive motivation when students study mathematics. Within goal theory, motivation is defined in terms of the goals that give purpose, meaning, and direction to achievement-related behaviors (Hernandez, Schultz, Estrada, Woodcock, & Chance, 2013) . Preceding studies within the context of achievement goal orientations have found a decrease in personal task goals and an increase in personal extrinsic goals during the transition to middle school (Anderman, Maehr, & Midgley, 1999) . Therefore, we suppose two achievement goals-mastery goals and performance goals-as key components to enhance mathematics motivation in our study during the transition from elementary school to junior high school.
1.3. Task Value
In addition to goal theory, motivation researchers have assessed other constructs that may be crucial to children’s achievement choices. One such construct is children and students’ valuing of task-specific activities in mathematics. Value beliefs, defined as the perceived importance and interest attached to subjects, were found to decrease for mathematics across first through 12th grade (Pajares & Graham, 1999) , and for mathematics during the transition to middle school (Fredericks & Eccles, 2002) . Conley (2012) defined that task value is how the task relates to future goals (e.g., valuing mathematics class because of future utility). The Expectancy-Value Model (Eccles, Adler, Futterman, Goff, Kaczala, Meece, & Midgley, 1983) has conceptualized subjective task value which combines expectancies and task values to proximal psychological constructs like goals. Eccles and her colleagues’ works are frequently used to understand students’ task value (Eccles et al., 1993; Wigfield & Eccles, 2002) . They have developed an expectancy-value theory of task choices in which children’s subjective task values within a specific domain are crucial to motivation and to future achievement choices within that domain. In their model, task value encompasses students’ perceptions of mathematics utility in their daily life and in future. Task value refers to the usefulness of a task for students in terms of future aspirations.
Students’ subjective task value has four components: intrinsic or interest value, attainment value, task value, and cost (Wigfield & Eccles, 2000) . It has been revealed that students’ task value beliefs in mathematics decline across middle school (Jacobs, Lanza, Osgood, Eccles, & Wigfield, 2002; Watt, 2004) . According to Wigfield and Eccles (2002) , task value is a construct by which individuals choose to participate in mathematics tasks, because they regard mathematics as useful to them. So we hypothesized task value as a reason why students study mathematics. In the current study we focused on task value to compare mastery and performance goals in mathematics and mathematics anxiety.
1.4. Mathematics Anxiety
Mathematics anxiety is defined as “feelings of tension and apprehension surrounding the manipulation of numbers and the solving of mathematical problems in academic, private, and social settings (Richardson & Suinn, 1972: p. 551) .”According to Ashcraft (2002) , math anxiety can be defined as “a feeling of tension, apprehension, or fear that interferes with math performance” (p. 181). Mathematics anxiety is not only due to the lack of training or to insufficient skills, but is also due to misperception about mathematics and negative experiences in previous mathematics classes. A component of subjective task value (Wigfield & Eccles, 2000) is cost as mentioned above. Cost refers to the accumulated negative emotion of engaging in the task, including anticipated emotional states such as performance anxiety (Conley, 2012) . In mathematics, this negative emotion is combined with mathematics anxiety. Mathematics anxiety is commonly defined as a feeling of tension or fear that interferes with mathematics performance, and the correlations between mathematics anxiety and variables such as motivation and self-confidence in math are strongly negative (Ashcraft, 2002) . Further, Mastery goal predicted negatively and performance goal did positively mathematics anxiety (Luo, Hogan, Tan, Kaur, Ng, & Chan, 2014) . In the current study, we posit children and students’ mathematics anxiety which reduce mathematics motivation.
1.5. The Present Study
The present study is designed to develop the modified version of mathematics motivation scale by modifying Japanese version of Mathematics Motivation Scale (Oie & Fujie, 2007a, 2007b) , to explain how mastery goal, performance goal, task value, and mathematics anxiety develop through transition from elementary to junior high school. The hypothesized structure of the model was based on previous Mathematics Motivation Scale (Oie & Fujie, 2007a, 2007b) . We bring up a meaningful modification of this scale, because CFAs (confirmatory factor analysis) have not been applied in Oie and Fujie (2007a, 2007b) . The original scale was created only by utilizing EFA (explanatory factor analysis). Furthermore, in the original scale they adopted the item whose factor loading was under 0.40. It leads to this scale’s destabilization. Therefore, we decided to select items carefully by adopting the more rigorous method CFA. Although students show a decline in school motivation during adolescence on average, a subset of students shows an increase in school motivation (Eccles, 2013) . Given that researchers have shown the existence of school and age-related differences in mathematics motivation, it becomes important to determine not only if they are in effect distinct but also whether the measurement structure and the correlation between the factors are stable over development and across the transition from elementary to junior high school. This type of examination can only be accomplished using a longitudinal CFA by Vaillancourt, Brendgen, Boivin, & Tremblay (2003) .
Accordingly, in the current study we tested empirically the developmental aspects of mathematics motivation over time using CFA. Using a large representative sample of Japanese children from fifth to ninth grade, we employed a multigroup modeling procedure with a longitudinal design in which we tested a four-factor model. We hypothesized that four interpretable factors would be found and that their measurement structure (i.e., the pattern of factor loadings) would be stable across school transition, according to Oie and Fujie (2007a, 2007b) . The aim of the present study was to investigate longitudinal developmental change among mastery goal, performance goal, task value, and mathematics anxiety using the mathematics motivation scale (Oie & Fujie, 2007a, 2007b) .
2. Method
2.1. Participants and Design
The study presented here is based on data collected longitudinally. The first investment was held in January and February in 200X (Time 1), and the second one was held in May and June in 200X (Time 2).
Four cohorts of children and adolescents participated in the study. Samples were drawn from eight public elementary and six public junior high schools in Tokyo, and were drawn so that they were sufficiently representative of the student population of Tokyo. In Time 1, in fifth, sixth, seventh and eighth grades, we recruited students from fourteen public elementary and junior high schools in Tokyo to participate in a larger longitudinal study. In all schools, we invited the four grades to participate in Time 1. This same recruitment strategy was employed in subsequent times-during each year of the study, we invited all students in the target grade at all schools to participate. In total, 1519 (Time 1) and 1238 (Time 2) participants were included in the current study (Table 1). All participants attended national and public schools in Tokyo.

Table 1. Sample Size Broken Down by Grade.
2.2. Survey Administration
The sample consisted of Japanese students who participated in the Project for the Classroom Discourse in Science and Mathematics and Cognitive Development in Transition from Elementary to Junior High School (Oie, Fujie, Okugawa, Kakihana, Itaka, & Uebuchi, 2013) . This project included a longitudinal study involving assessments for three times during the transition from elementary to junior high school years (grades 5 to 8) to investigate the development of mathematics motivation. As the educational system, Japanese pupils graduate elementary school in the end of grade 6, and then enter into junior high school in grade 7.
2.3. Measure: Mathematics Motivation Scale (MMS)
The Japanese version of MMS (Oie & Fujie, 2007a, 2007b) is a 20-item instrument on which respondents indicate how descriptive each statement is of them. Some items translated from Elliot and Church’s (1997) intrinsic motivation scale were used to assess students’ intrinsic motivation for their math class (sample item: “I am enjoying class very much”). The MMS is scored on a four-point Likert scale (1―Very undescriptive of me, 2―A little undescriptive of me, 3―A little descriptive of me, 4―Very descriptive of me). Total scores on this instrument are from 20 to 80. Items assess each of the four components of mathematics motivation: mastery goal in mathematics (11 items), task value in mathematics (three items), mathematics anxiety (three items), and performance goal (three items). Following reverse scoring of the mathematics motivation scale, higher scores indicate higher degrees of mathematics motivation.
2.4. Procedures
In Time 1 and Time 2, the teachers in each classroom at the 8 elementary and 6 junior high schools administered surveys to pupils and students during each class. Pupils and students were encouraged to ask questions about items they did not understand. They were informed that the information they provided would be confidential, and surveys were removed from the school building immediately following administration.
In this questionnaire participants were instructed to answer the question: “How do you think the following items? Please mark the most adequate number for you from 1 = ‘Very undescriptive of me’ to 4 = ‘Very descriptive of me’”.
3. Results
Prior to data analysis, screening was conducted for missing data. As a result, initial data 1706 was reduced to 1519 in Time 1. Any completed MMS forms (Time 1 and Time 2) with missing responses were excluded from the final data pool. In addition, in Time 2 school term changed and grade shifted to next stage. Especially, six graders in Time 1 who entered into national or private junior high school dropped in Time 2. This reduced the initial sample of 1, in Time 1 to 1238 in Time 2. Any missing responses on Time 1 and Time 2 forms appeared to be random oversights of individual responses in these cases. All responses to negatively worded statements were reversed prior to the data analysis. The grade at each wave and sample size for each cohort appears in Table 1.
3.1. Descriptive Statistics and Estimates of Reliability: Factor Structural Model of the modified Mathematics Motivation Scale
The advantage of incorporating the two poles of goal theories-mastery goal and performance goal, task value and mathematics anxiety is clearly visible from the outcome of exploratory factor analysis of the modified Mathematics Motivation Scale. The factor structure of the modified MMS was assessed using EFA on Time 1 and Time 2 participants, following the four factor model by Oie and Fujie (2007a, 2007b) . We entered all the items for the motivational constructs into an exploratory factor analysis and saved the promax rotation factor score. All items had loadings on the four factors in Oie and Fujie (2007a, 2007b) above 0.40, except four of the 11 mastery goal items. Finally, the 16 items reduced to these four subscales were analyzed.
Results of the explanatory factor analysis and reliability of the scale are shown in Table 2. Omega reliabilities (ω) for the MMS subscales of mastery goal, task value, mathematics anxiety, and performance goal in Time 1, were 0.90, 0.75, 0.61, and 0.58, respectively; in Time 2 they were 0.90, 0.72, 0.59, and 0.60, respectively. Then descriptive statistics were calculated. At first, to investigate the relationships among four subscales, average scores for all scales were calculated. Pearson’s product-moment correlation coefficients were then calculated using SPSS 24 and presented in Table 2. Prior to calculating the coefficients, the distributions of all summed variables were examined. No notable deviations from normality were detected. The descriptive statistics indicated the variables were relatively normally distributed and deviated little from expected measures of central tendency.
3.2. The Modified MMS Confirmatory Factor Analysis
The four-factor CFA model was estimated with IBM SPSS Statistics Amos 24 using maximum-likelihood estimation to examine the internal structure of the modified MMS. Several indices were used to assess model fit. As the chi-squared statistic (χ2) is strongly dependent on sample size (Hu & Bentler, 1999) , χ2/df ratios instead of probability values are presented for each model. In general, χ2/df ratios ranging from two to five are considered to represent adequate model fit (Byrne, 2001) . As the various models subjected to CFA were nested designs, the chi-squared change (Δχ2) statistic (Hu & Bentler, 1999) was used to test for differences in fit between the models. Two absolute fit indices (the goodness-of-fit index, GFI, and the adjusted goodness of fit index, AGFI) and two fit indices (the root mean square error of approximation, RMSEA, the comparative fit index, CFI) are also presented. Browne and Cudeck (1993) and Byrne (2001) suggest that good model fit is indicated by indices of greater than 0.90 for the GFI
Table 2. 16 items for Mathematics Motivation Scale (modified version of Oie & Fujie, 2007a, 2007b ).
With current sample size, all correlations larger than 0.05 (**) in absolute size are significant at 0.001 level.
and CFI. RMSEA (Browne & Cudeck, 1993) compares the model optimal parameter values with the population covariance matrix as if it was available. Values less than 0.05 indicate good fit, and values between 0.05 and 0.08 indicate reasonable fit. Table 3 presents the fit indices for the four-factor model on Time 1 and Time 2. The model examining the internal structure of the modified MMS constructs (Figure 1) met our established requirements, with the RMSEA slightly below the conventional cut off criteria, χ2 (98, N = 1519) = 824.94, p < 0.001, CFI = 0.92, RMSEA = 0.07. Examination of other global fit indices indicated the model was consistent with the data: GFI = 0.93, AGFI = 0.91 in Time 1. In Time 2 this estimated model demonstrated adequate fit to the data, as indicated by the following fit indexes: χ2 (98, N = 1238) = 789.47, p < 0.001, CFI = 0.91, GFI = 0.93, AGFI = 0.90, RMSEA = 0.08.
Note. Path coefficients in Time 1 are presented to the left of the slash; those in Time 2 to the right of the slash. MG = mastery goal; TV = task value; MA = mathematics anxiety; PG = performance goal.
3.3. Correlation among Four Subscales
The correlation matrix among four variables in each of Time 1 and Time 2 is shown in Table 4. The calculations supported the proposed relations between the variables in our sequence. Mastery goal and task value were significantly and positively correlated both in Time 1 and Time 2. In contrast, mastery goal and task value were significantly and negatively correlated with mathematics anxiety both in Time 1 and Time 2. As shown in Table 4, performance goal had almost no correlation with other three variables.
Table 3. Results of Confirmatory Factor Analyses of the modified Mathematics Motivation Scale.
Note. χ2 = chi-square test; df = degrees of freedom; CFI = comparative fit index; GFI = goodness of fit index; AGFI = adjusted goodness of fit index; RMSEA = root-mean-square error of approximation.
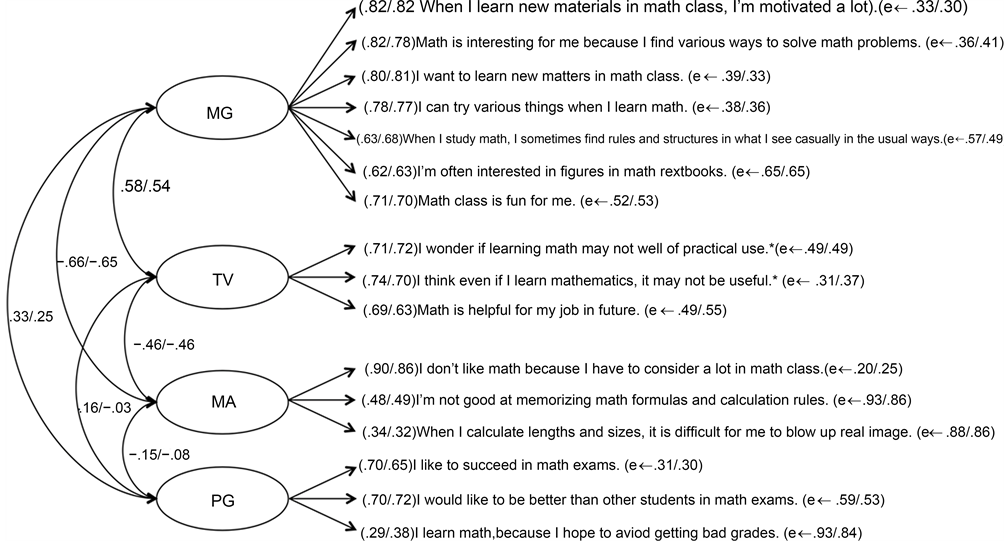
Figure 1. Modified four-factor model of the short MMS based on data from Time 1 and Time 2.
Table 4. Correlations among all study variables.
Note. Time 1 : N = 1519, Time 2 : N = 1238. Correlations in Time 1 are presented in the right side; those in Time 2 in the left side. **p < 0.01.
3.4. Longitudinal Development of Mathematics Motivation in the Transition from Elementary to Junior High School
The longitudinal development of mathematics motivations in the transition from elementary to junior high school was compared using paired samples t-tests to identify how each cohort changed. The means, standard deviations, paired samples t-test results, and effect sizes are summarized for all measures in Table 5. A paired samples t-test identified a significant decrease of mastery goal and task value in cohort 1 from 5th grade in Time 1 (mastery goal, M = 3.01, SD = 0.76; task value, M = 3.47, SD = 0.59) to 6th grade in Time 2 (mastery goal, M = 2.91, SD = 0.80; task value, M = 3.38, SD = 0.65), mastery goal’s t (367) = 3.20, p < 0.001 (two-tailed) and task value’s t (378) = 2.58, p = 0.01 (two-tailed), effect size r = 0.17. Further significant increases of performance goal were found in cohort 2, 3, and 4, from 6th grade in Time 1 (M = 2.82, SD = 0.71) to 7th grade in Time 2 (M = 3.01, SD = 0.64), t (228) = −4.33, p < 0.001 (two-tailed), effect size r = 0.28 (large) from 7th grade in Time 1 (M = 3.05, SD = 0.66) to 8th grade in Time 2 (M = 3.13, SD = 0.62), t (378) = −2.57, p = 0.01 (two-tailed), effect size r = 0.13, and from 8th grade in Time 1 (M = 3.03, SD = 0.68) to 9th grade in Time 2 (M = 3.14, SD = 0.68), t (312) = −3.03, p < 0.001 (two-tailed), effect size r = 0.17. The transition from elementary school to junior high school influenced the increase of performance goal.
There was also a tendency that mathematics anxiety increase from 6th grade in Time 1 (M = 2.39, SD = 0.73) to 7th grade in Time 2 (M = 2.47, SD = 0.71), t (279) = −1.70, p = 0.09 (two-tailed) effect size r = 0.11, and a tendency to decrease from 7th grade in Time 1 (M = 2.45, SD = 0.76) to 8th grade in Time 2 (M = 2.39, SD = 0.73), t (379) = −1.79, p < 0.07 (two-tailed) effect size r = 0.09. Additionally, mastery goal in cohort 4 increased significantly from 8th grade in Time 1 (M = 2.45, SD = 0.76) to 9th grade in Time 2 (M = 2.54, SD = 0.75), t (306) = −2.46, p = 0.01 (two-tailed), effect size r = 0.14.
The correlation matrix in each variable between Time 1 and Time 2 is shown in Table 5. As expected, the four subscales on the modified MMS in Time 1 and Time 2 correlated positively with one another. The calculations supported the proposed relations between time sequences. Mastery goal, task value, mathematics anxiety, and performance goal were significantly and positively correlated with each other in each grade and in total between Time 1 and Time 2.
Table 5. Descriptive Statistics for Variables at the grade Group Levels.
T values larger than 2.33 in absolute value are statistically significant at 0.01 level, and those larger than 3.29 at 0.001 level.
4. Discussion
The main aims of this study were to develop a modified form of the MMS, and to assess the reliability and validity of this modified form on pupils and students in transition from elementary to junior high school in Japan. Results of two CFAs conducted in this study supported a four-factor model with 16 items, in which four ‘mastery goal’ items were removed from original MMS (Oie & Fujie, 2007a, 2007b) . All four subscales in the modified MMS displayed intermediate correlations to each other within Time 1 and Time 2, besides, high correlations within each subscales between Time 1 and Time 2. Furthermore, the modified MMS showed sufficient internal consistencies and displayed enough omega values. These results suggested that the four removed items were effectively redundant.
Subsequently, based on data collected from a Japanese sample, the modified MMS subscales displayed good internal consistencies and satisfactory test-retest reliability through the transition from elementary to junior high school. The correlations among the MMS subscales in Time 1 and Time 2 verified the results of enormous empirical accumulation and supported the construct validity of the instrument.
In our longitudinal study, mastery goal decreased from 5th to 6th grade and increased from 7th to 8th grade. Eccles and her colleagues (Eccles et al., 1989, 1993) insisted that intrinsic motivation sometimes considered as equal to mastery goal decreased and performance goal increased as children grow older. Our study revealed that the transition from elementary to junior high school influenced the decrease of mastery goal. This result supported Eccles and her colleagues’ findings exactly in the transition from 6th to 7th grade. On the other hand, mastery goal increased from 7th to 8th grade in our study. Covington and Dray (2002) asked undergraduates to remind their experiences on mastery motivation in each school stage. They indicated that mastery motivation decreased once in junior high school stage, recovered again and enhanced in high school. It seems to lead to enhancement of learning motivation after the transition to high school. Our study supported Covington and Dray’s result.
Above all, in our research personal goal which is one of a pair of achievement goals opposite to mastery goal, increased on a continuing basis from 6th through 7th and 8th to 9th grade. Also Covington and Dray (2002) pointed out that students become interested in scores as their grades in school advanced. From 8th to 9th grade, both mastery and performance goal have been enhanced. Our investigation supported this result.
Further, task value decreased from 5th to 6th grade at elementary school. As Ames (1992) insisted, learners who are interested in learning and pile up experiences to find meanings and values in task can grow their learning motivation effectively. In spite of no significant decrease in task value in the transition from elementary to junior high school, teachers and educators should construct units by which students are able to feel task utilities and formulate high qualitative learning.
Although any significant difference between Time 1 and Time 2 in mathematics anxiety was found, a tendency that mathematics anxiety increased from 6th grade to 7th grade and decreased from 7th grade to 8th grade. It should be influenced by change of school stage from elementary to junior high school in Japan. 7th grade is just after the transition from elementary to junior high school in Japan. Additionally, mathematics which is defined as “san-su” (number calculation) at elementary school changes to “suu-gaku” (number studies), which is located in entrance of science at junior high school. Therefore, contents in mathematics textbooks and lessons in junior high school are more advanced than in elementary school. It leads to the tendency to mathematics anxiety’s increase in the transition from the 6th grade to 7th grade, from elementary school to junior high school. As a background of this phenomenon, it is notable to pay attention to ‘stage-environment fit theory’ advocated by Eccles et al. (1993) . They suggested that for early adolescence group lessons in classroom, official and relative evaluation are sometimes dangerous because such study environment and evaluation influence motivation in school negatively.
5. Conclusion
In conclusion, our study revealed that mathematics motivation decreased in school transition from elementary to junior high school partly, but performance goal was enhanced in junior high school. In future, longitudinal studies which are set in longer span are necessary to indicate how mathematics motivation will be increased during adolescence.
Acknowledgements
Preparation of this article was supported in part by a research grant from the Grants-in-Aid for Social Scientific Research (research project number 17011021) by Japanese Ministry of Education, Culture, Sports, Science and Technology.
Cite this paper
Oie, M., & Fujii, T. (2017). Development of Mathematics Motivation across the Transition from Elementary to Junior High School in Japan. Psychology, 8, 287-301. http://dx.doi.org/10.4236/psych.2017.82017
References
- 1. Ames, C. (1992). Classrooms: Goals, Structures, and Student Motivation. Journal of Educational Psychology, 84, 261-271.
https://doi.org/10.1037/0022-0663.84.3.261 [Paper reference null] - 2. Anderman, E. M., & Midgley, C. (1997). Changes in Achievement Goal Orientations, Perceived Academic Competence, and Grades across the Transition to Middle-Level Schools. Contemporary Educational Psychology, 22, 269-298.
https://doi.org/10.1006/ceps.1996.0926 [Paper reference null] - 3. Anderman, E. M., Maehr, M. L., & Midgley, C. (1999). Declining Motivation after the Transition to Middle School: School Can Make a Difference. Journal of Research and Development in Education, 32, 131-147. [Paper reference null]
- 4. Ashcraft, M. H. (2002). Math Anxiety: Personal, Educational, and Cognitive Consequences. Current Directions in Psychological Science, 11, 181-185.
https://doi.org/10.1111/1467-8721.00196 [Paper reference null] - 5. Browne, M. W., & Cudeck, R. (1993). Alternative Ways of Assessing Model Fit. In K. A. Bollen, & J. S. Long (Eds.), Testing Structural Equation Models (pp. 136-161). Newbury Park: Stage Publications. [Paper reference null]
- 6. Byrne, B. M. (2001). Structural Equation Modeling with AMOS: Basic Concepts, Applications, and Programming. Mahwah, NJ: Lawrence Erlbaum Associates. [Paper reference null]
- 7. Conley, A. M. (2012). Patterns of Motivation Beliefs: Combining Achievement Goal and Expectancy-Value Perspectives. Journal of Educational Psychology, 104, 32-47.
https://doi.org/10.1037/a0026042 [Paper reference null] - 8. Covington, M. V., & Dray, E. (2002). The Developmental Course of Achievement Motivation: A Need-Approach. In A. Wigfield, & J. S. Eccles (Eds.), Development of Achievement Motivation (pp. 33-56). San Diego, CA: Academic Press. [Paper reference null]
- 9. Dweck, C. S. (1986). Motivational Processes Affecting Learning. American Psychologist, 41, 1040-1048.
https://doi.org/10.1037/0003-066X.41.10.1040 [Paper reference null] - 10. Eccles, J. S. (2013). Social Contexts and Adolescent Development. Stanford, CA: Stanford Developmental Brownbag. [Paper reference 1]
- 11. Eccles, J. S., Adler, T. F., Futterman, R., Goff, S. B., Kaczala, C. M., Meece, J. L., & Midgley, C. (1983). Expectancies, Values, and Academic Behaviors. In J. T. Spence (Ed.), Achievement and Achievement Motivation (pp. 75-146). San Francisco, CA: W. H. Freeman. [Paper reference 1]
- 12. Eccles, J. S., Wigfield, A., Flanagan, C. A., Miller, C., Reuman, D. A., & Yee, D. (1989). Self-Concepts, Domain Values, and Self-E: Relations and Changes at Early Adolescence. Journal of Personality, 57, 283-310.
https://doi.org/10.1111/j.1467-6494.1989.tb00484.x [Paper reference 2] - 13. Eccles, J. S., Wigfield, A., Harold, R., & Blumenfeld, P. B. (1993). Age and Gender Differences in Children’s Self- and Task Perceptions during Elementary School. Child Development, 64, 830-847.
https://doi.org/10.2307/1131221 [Paper reference 5] - 14. Elliot, A. J., & Church, M. A. (1997). A Hierarchical Model of Approach and Avoidance Achievement Motivation. Journal of Personality and Social Psychology, 72, 218-232.
https://doi.org/10.1037/0022-3514.72.1.218 [Paper reference 1] - 15. Fredericks, J. A., & Eccles, J. S. (2002). Children’s Competence and Value Beliefs Childhood Adolescence: Growth Trajectories in Two Male-Sex-Typed Domains. Developmental Psychology, 38, 519-533.
https://doi.org/10.1037/0012-1649.38.4.519 [Paper reference 1] - 16. Gottfried, A. E., Fleming, J. S., & Gottfried, A. W. (2001). Continuity of Academic Intrinsic Motivation Childhood Late Adolescence: A Longitudinal Study. Journal of Educational Psychology, 93, 3-13.
https://doi.org/10.1037/0022-0663.93.1.3 [Paper reference 2] - 17. Hernandez, P. R., Schultz, P. W., Estrada, M., Woodcock, A., & Chance, R. C. (2013). Sustaining Optimal Motivation: A Longitudinal Analysis of Interventions to Broaden Participation of Underrepresented Students in STEM. Journal of Educational Psychology, 105, 89-107.
https://doi.org/10.1037/a0029691 [Paper reference 1] - 18. Hu, L., & Bentler, P. M. (1999). Cutoff Criteria for Fit Indexes in Covariance Structure Analysis: Conventional Criteria versus New Alternatives. Structural Equation Modeling: A Multidisciplinary Journal, 6, 1-55.
https://doi.org/10.1080/10705519909540118 [Paper reference 2] - 19. Jacobs, J. E., Lanza, S., Osgood, D. W., Eccles, J. S., & Wigfield, A. (2002). Changes in Children’s Self-Competence and Values: Gender and Domain Differences across Grades One Twelve. Child Development, 73, 509-527.
https://doi.org/10.1111/1467-8624.00421 [Paper reference 1] - 20. Kaplan, A., & Maehr, M. L. (2007). The Contributions and Prospects of Goal Orientation Theory. Educational Psychology Review, 19, 141-184.
https://doi.org/10.1007/s10648-006-9012-5 [Paper reference 2] - 21. Luo, W., Hogan, D., Tan, L. S., Kaur, B., Ng, P. T., & Chan, M. (2014). Self-Construal and Students’ Math Self-Concept, Anxiety and Achievement: An Examination of Achievement Goals as Mediators. Asian Journal of Social Psychology, 17, 184-195.
https://doi.org/10.1111/ajsp.12058 [Paper reference 1] - 22. Nicholls, J. G. (1984). Achievement Motivation: Conceptions of Ability, Subjective Experience, Task Choice, and Performance. Psychological Review, 91, 328-346.
https://doi.org/10.1037/0033-295X.91.3.328 [Paper reference 3] - 23. Oie, M., & Fujie, Y. (2007a). Motivation on Science and Mathematics across Elementary School to Junior High School: Making Measurement of Motivation on Mathematics. Bulletin of the Research Center for Child & Adolescent Development & Education Ochanomizu University, 4, 75-81. [Paper reference 11]
- 24. Oie, M. & Fujie, Y. (2007b). The Change of Motivation on Science and Mathematics Elementary School to Junior High School: To Develop Measurement of Motivation on Mathematics. Journal of Social Motivation, 4, 29-36. [Paper reference 11]
- 25. Oie, M., Fujie, Y., Okugawa, Y., Kakihana, S., Itaka, S., & Uebuchi, H. (2013). Self-Regulated Learning in School Transition and as a Creative Process. In A.-G. Tan (Ed.), Creativity, Talent and Excellence (pp. 89-106). New York, NY: Springer.
https://doi.org/10.1007/978-981-4021-93-7_7 [Paper reference 1] - 26. Otis, N., Grouzet, F. M. E., & Pelletier, L. G. (2005). Latent Motivational Change in an Academic Setting: A 3-Year Longitudinal Study. Journal of Educational Psychology, 97, 170-183.
https://doi.org/10.1037/0022-0663.97.2.170 [Paper reference 1] - 27. Pajares, F., & Graham, L. (1999). Self-Efficacy, Motivation Constructs, and Mathematics Performance of Entering Middle School. Contemporary Educational Psychology, 24, 124-139.
https://doi.org/10.1006/ceps.1998.0991 [Paper reference 1] - 28. Richardson, F. C., & Suinn, R. M. (1972). The Mathematics Anxiety Rating Scale: Psychometric Data. Journal of Counseling Psychology, 19, 551-554.
https://doi.org/10.1037/h0033456 [Paper reference 1] - 29. Romero, C., Master, A., Paunesku, D., Dweck, C. S., & Gross, J. J. (2014). Academic and Emotional Functioning in Middle School: The Role of Implicit Theories. Emotion, 14, 227-234.
https://doi.org/10.1037/a0035490 [Paper reference 1] - 30. Vaillancourt, T., Brendgen, M., Boivin, M., & Tremblay, R. E. (2003). A Longitudinal Confirmatory Factor Analysis of Indirect and Physical Aggression: Evidence of Two Factors over Time? Child Development, 74, 1628-1638.
https://doi.org/10.1046/j.1467-8624.2003.00628.x [Paper reference 1] - 31. Wang, Q., & Pomerantz, E. M. (2009). The Motivational Landscape of Early Adolescence in the US and China: A Longitudinal Study. Child Development, 80, 1272-1287.
https://doi.org/10.1111/j.1467-8624.2009.01331.x [Paper reference 1] - 32. Watt, H. M. (2004). Development of Adolescents’ Self-Perceptions, Values, and Task Perceptions according to Gender and Domain in 7th-Through 11th-Grade Australian Students. Child Development, 75, 1556-1574.
https://doi.org/10.1111/j.1467-8624.2004.00757.x [Paper reference 1] - 33. Wigfield, A., & Eccles, J. S. (2000). Expectancy-Value Theory of Achievement Motivation. Contemporary Educational Psychology, 25, 68-81.
https://doi.org/10.1006/ceps.1999.1015 [Paper reference 2] - 34. Wigfield, A. & Eccles, J. (2002). The Development of Competence Beliefs, Expectancies for Success, and Achievement Values from Childhood through Adolescence. In A. Wigfield, & J. Eccles (Eds.), The Development of Achievement Motivation (pp.91-120). San Diego, CA: Academic Press.
https://doi.org/10.1016/B978-012750053-9/50006-1 [Paper reference 3] - 35. Wigfield, A., Eccles, J. S., MacIver, D., Reuman, D. A., & Midgley, C. (1991). Transitions at Early Adolescence: Changes in Children’s Domain-Specific Self-Perceptions and General Self-Esteem across the Transition to Junior High School. Developmental Psychology, 27, 552-565.
https://doi.org/10.1037/0012-1649.27.4.552 [Paper reference 2]