Wireless Engineering and Technology
Vol.3 No.2(2012), Article ID:18930,4 pages DOI:10.4236/wet.2012.32012
Estimation of Fading Statistics of Nakagami Channel with Weibull Distributed Tolerable Outage Time
![]()
Shri G. S. Institute of Technology and Science, Indore, India.
Email: {jain.anjana, prakash.vyavahare}@gmail.com, ldarya@rediffmail.com
Received August 9th, 2011; revised November 18th, 2011; accepted December 14th, 2011
Keywords: Fading Statistics; Tolerance Time; Fade Duration Distribution Function; Weibull Function; Nakagami Wireless Channel; Minimum Outage Time
ABSTRACT
Characterization of a mobile radio channel plays an important role in designing a reliable wireless communication system. Such channels are analyzed by two state model, namely satisfactory and outage state. This paper presents the analysis to estimate fading parameters of wireless channel with omission of certain outage durations which are considered as “Tolerance time”. Minimum outage duration which can be tolerated by a wireless fading channel to achieve desired packet error rate is defined as tolerance time. Normally a system with tolerable minimum outage time is analyzed based on Fade Duration Distribution (FDD) function over Rayleigh channel. In this paper Weibull function is used as FDD for varying tolerance time. The approach is simple and in general applicable from Rayleigh to Nakagami channels. The analysis is extended to study the effect of Tolerance time on channel fading statistics such as Average Fade Duration (AFD) and frequency of outage. Further the effects of various fade margin and Doppler spread on fading parameters are also investigated. The analysis can also be used in case of timeout expiration, connection resetting and congestion window control.
1. Introduction
Wired channels are completely characterized by their attenuation and time delay properties as a function of frequency which are time invariants. However, wireless channels exhibit random and time variant channel characteristics. In order to characterize the fading channel it is necessary to investigate its higher order fading statistics. First order statistics such as probability density function (PDF) and Cumulative Density Function (CDF) of the received signal strength can only be used to obtain average behavior of the channel such as the Bit Error Rate (BER). Second order statistics such as Average Fade Duration (AFD), Level Crossing Rate (LCR), and outage probability characterize a fading channel with deeper insight in the channel behavior [1-5]. Emerging 3G and 4G mobile networks are designed to offer wide variety of services in hostile propagation environments. Therefore, there is a need to identify additional fading parameters for channel characterization purpose. The paper presents investigations on “Tolerance time” of a fading channel and its effects on the fading statistics with variations in Doppler spread and fade depth. Tolerance time is defined as the short outage times which a wireless communication system can tolerate satisfying the application dependent maximum value of Packet Error Rate (PER).
In mobile communication systems, outage event occurs when Signal to Interference Ratio (SIR) of received signal is below the specified SIR threshold (SIRth). With the introduction of tolerance time, outage would be said to have occurred if SIR is below the SIRth for duration longer than tolerance time. Tolerable outage time is protocol and application dependent. For packet communication the outage is defined in terms of packet error rather than drop in received signal strength [6-8]. Rice demonstrated the minimum duration of outage using Fade Duration Distribution (FDD) function and applied it over Rayleigh channel [9]. L. Jie and Mandyam [10] considered lognormal shadowing and analyzed the fading statistics using results presented by Rice [10,11]. In this paper, FDD is assumed to be Weibull distribution function. It has been observed that Weibull pdf is more flexible and can effectively model outages under different propagation environments [12-14] in terms of its shape parameter. Fading parameters of Rayleigh and Nakagami channels are analyzed with the variations in fade depth and Doppler spread. Further relationship among fading statistical parameters with and without tolerance
time is derived. In addition, interpretation of the tolerance time is also discussed. Organization of the paper is as follows. Section 2 presents the problem formulation considering Nakagami channel with its fading characteristics. Section 3 analyzes fading parameters of mobile radio channels using Weibull FDD. Verification and numerical results are elaborated in Section 4. Paper is concluded in Section 5.
2. Problem Formulation
In mobile radio networks the received signal envelope is modeled using certain pdf such as Rician, Rayleigh and lognormal [9-11]. For the emerging networks, operating at VHF and UHF frequencies, Rayleigh distributed fading model is inadequate to analyze the channel. Therefore, Nakagami m-distribution is used for analysis purpose [15]. Nakagami distribution of the envelope of instantaneous received signal power, “r” is described as [15,16]
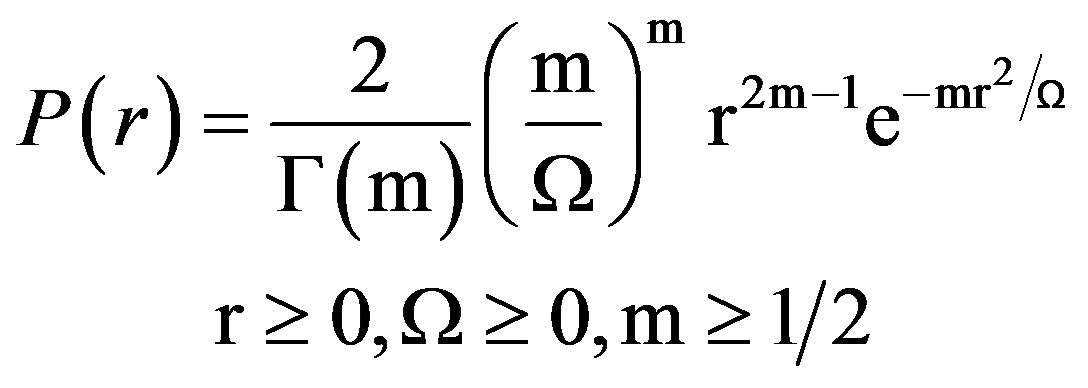 (1)
(1)
where Ω = E [r2] and 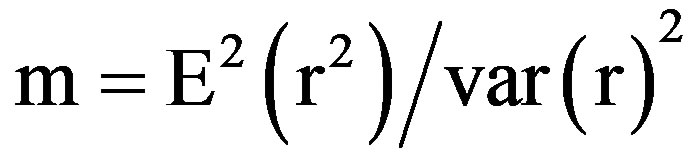
“m” is fading factor, that denotes the severity of fading and  is Euler’s Gamma function.
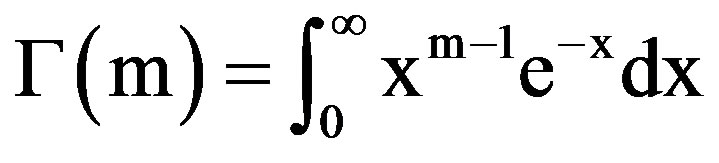 (2)
(2)
Rayleigh distribution is a special case of Nakagami m-distribution when m = 1. Figure 1 shows pdf of Nakagami distribution for different values of “m”.
Various fading characteristics of Nakagami channel, in general, are defined as follows:
2.1. Level Crossing Rate (LCR)
Level crossing rate is the frequency at which the envelope of received signal crosses a given threshold level “rth” in the negative direction. For Nakagami “m” channel, lcr is given by [17]
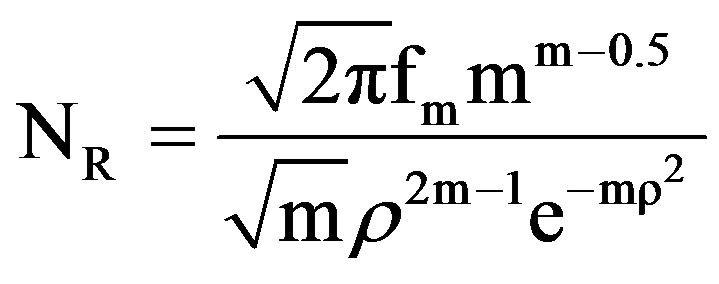 (3)
(3)
where “ ” is the ratio of received signal threshold “rth” to its rms value “rrms” and “fm” is the maximum Doppler frequency spread.
2.2. Average Fade Duration (AFD)
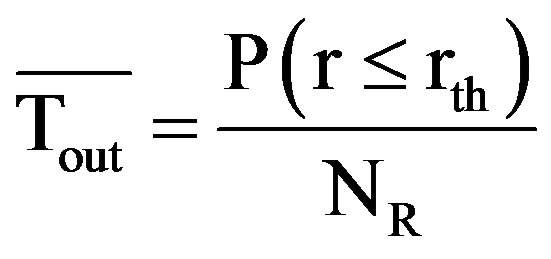
Average fade duration corresponds to the average length of time duration for which the received signal envelope remains below the given threshold level “rth” once it crosses it in the negative direction. Let “Tout” be the ran-
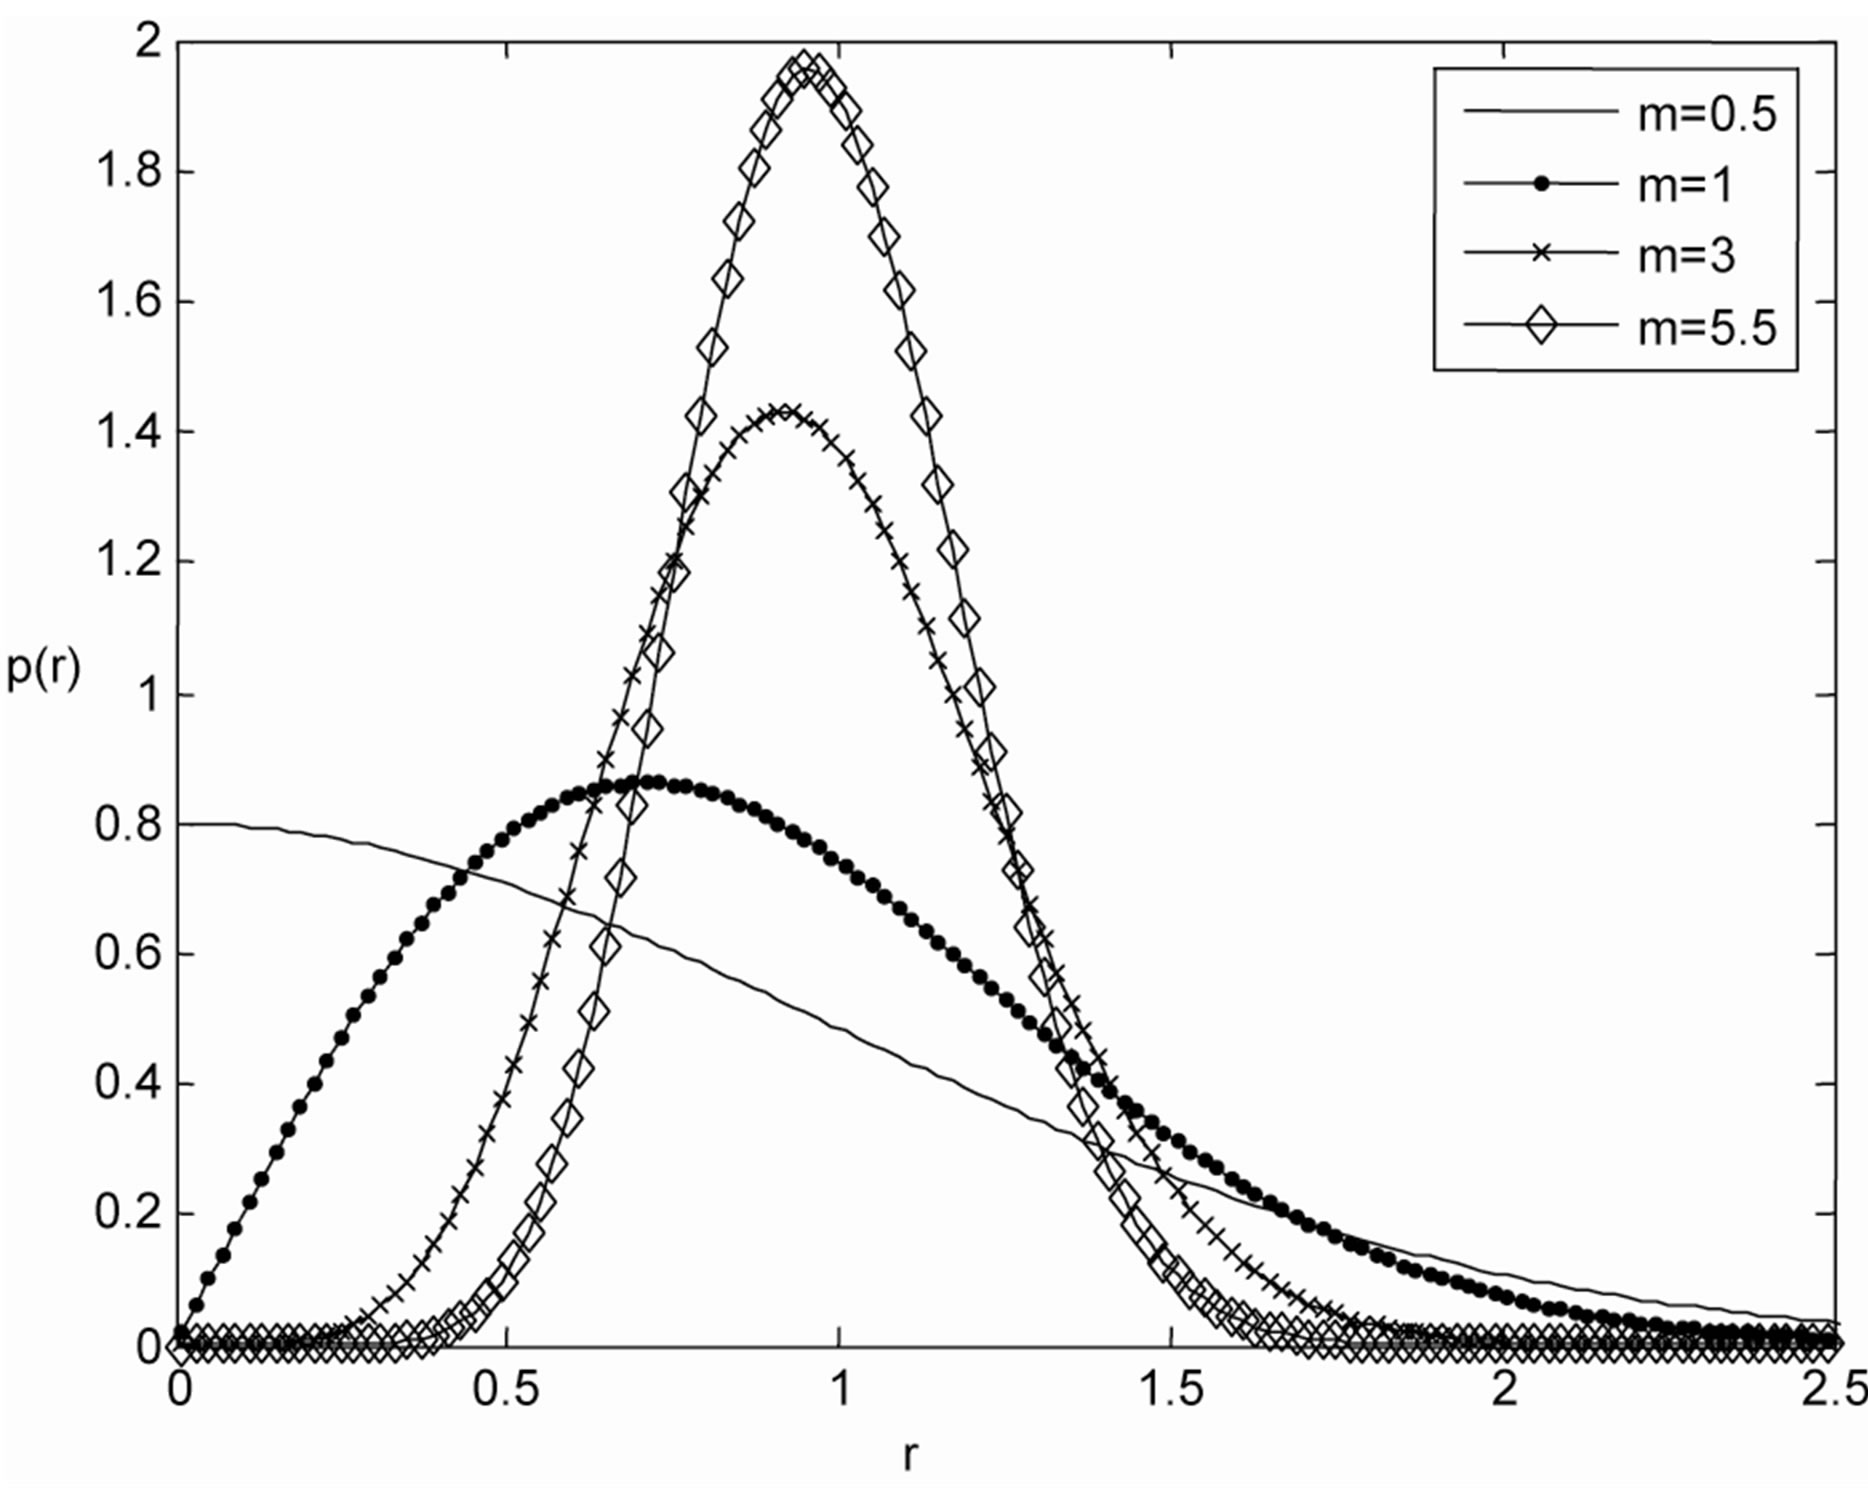
Figure 1. Nakagami distribution function for m = 0.5, 1, 3, 5.5.
dom variable defining fade duration, then its average value “ ” is given by
 (4)
(4)
It can be further shown that for Nakagami-m channel, “ ” is given by [17]
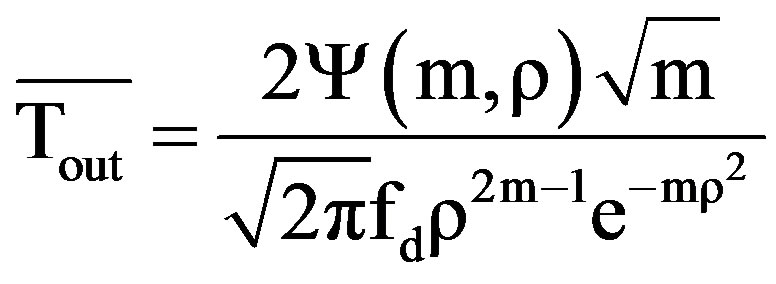 (5)
(5)
where
 (6)
(6)
2.3. Outage Probability
Outage probability “pout”, indicates the probability that the received signal envelope crosses the given threshold level “rth” in the negative direction and experiences outage. “pout” is defined as the fraction of time for which the channel is in outage and is given by
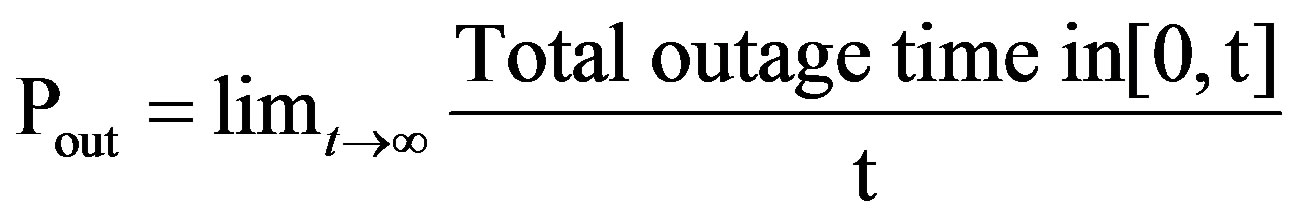 (7)
(7)
Outage probability is function of minimum received SIR, which is required for decoding of error free received symbols.
2.4. Weibull Distribution Function
Mobile radio channels such as Rayleigh, Rician or Nakagami have different fading characteristics. In this paper Weibull distribution function is selected as fade duration distribution for such channels, since it can represent various shaped FDD with values of its shape factor “α”. The pdf and CDF of the Weibull function is given by [13]
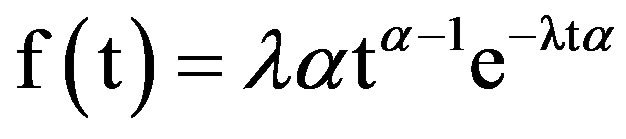 (8)
(8)
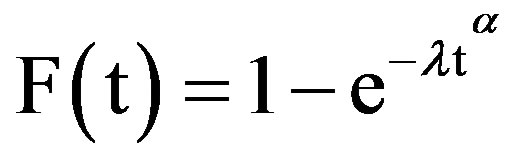 (9)
(9)
where a > 0 is the shape parameter and λ > 0 is the scale parameter of the distribution and “t” is outage time duration. The distribution has “1/λ” as its average value. Figure 2 shows the Weibull pdf for different values of shape parameter “a”.
The Weibull distribution with “a = 1”corrosponds to exponential function and “a = 2” corresponds to the Rayleigh distribution. A value of a < 1 indicates that the fading rate decreases over time. This happens if channel improves continuously in terms of fading. A value of a = 1 indicates that the fading rate is constant over time. [6,13].
3. Analysis of Fading Characteristics Using Weibull FDD
Minimum outage duration as reported in literature is based on the following assumptions [10,11]:
1) The number of interferers is large and therefore the noise is non fading type.
2) Received signal envelope is Rayleigh distributed with constant mean power.
3) Outage distribution is approximated as Rician function [9].
4) Slow varying shadow effect is compensated by power control.
However, the analysis reported in [10,11] is applicable to Rayleigh distributed signal under high fade margin i.e. with low outage probability.
The modeling and analysis presented in this paper relaxes some of these assumptions. The proposed model has following general assumptions:
1) Analysis is applicable for Rayleigh to Nakagami
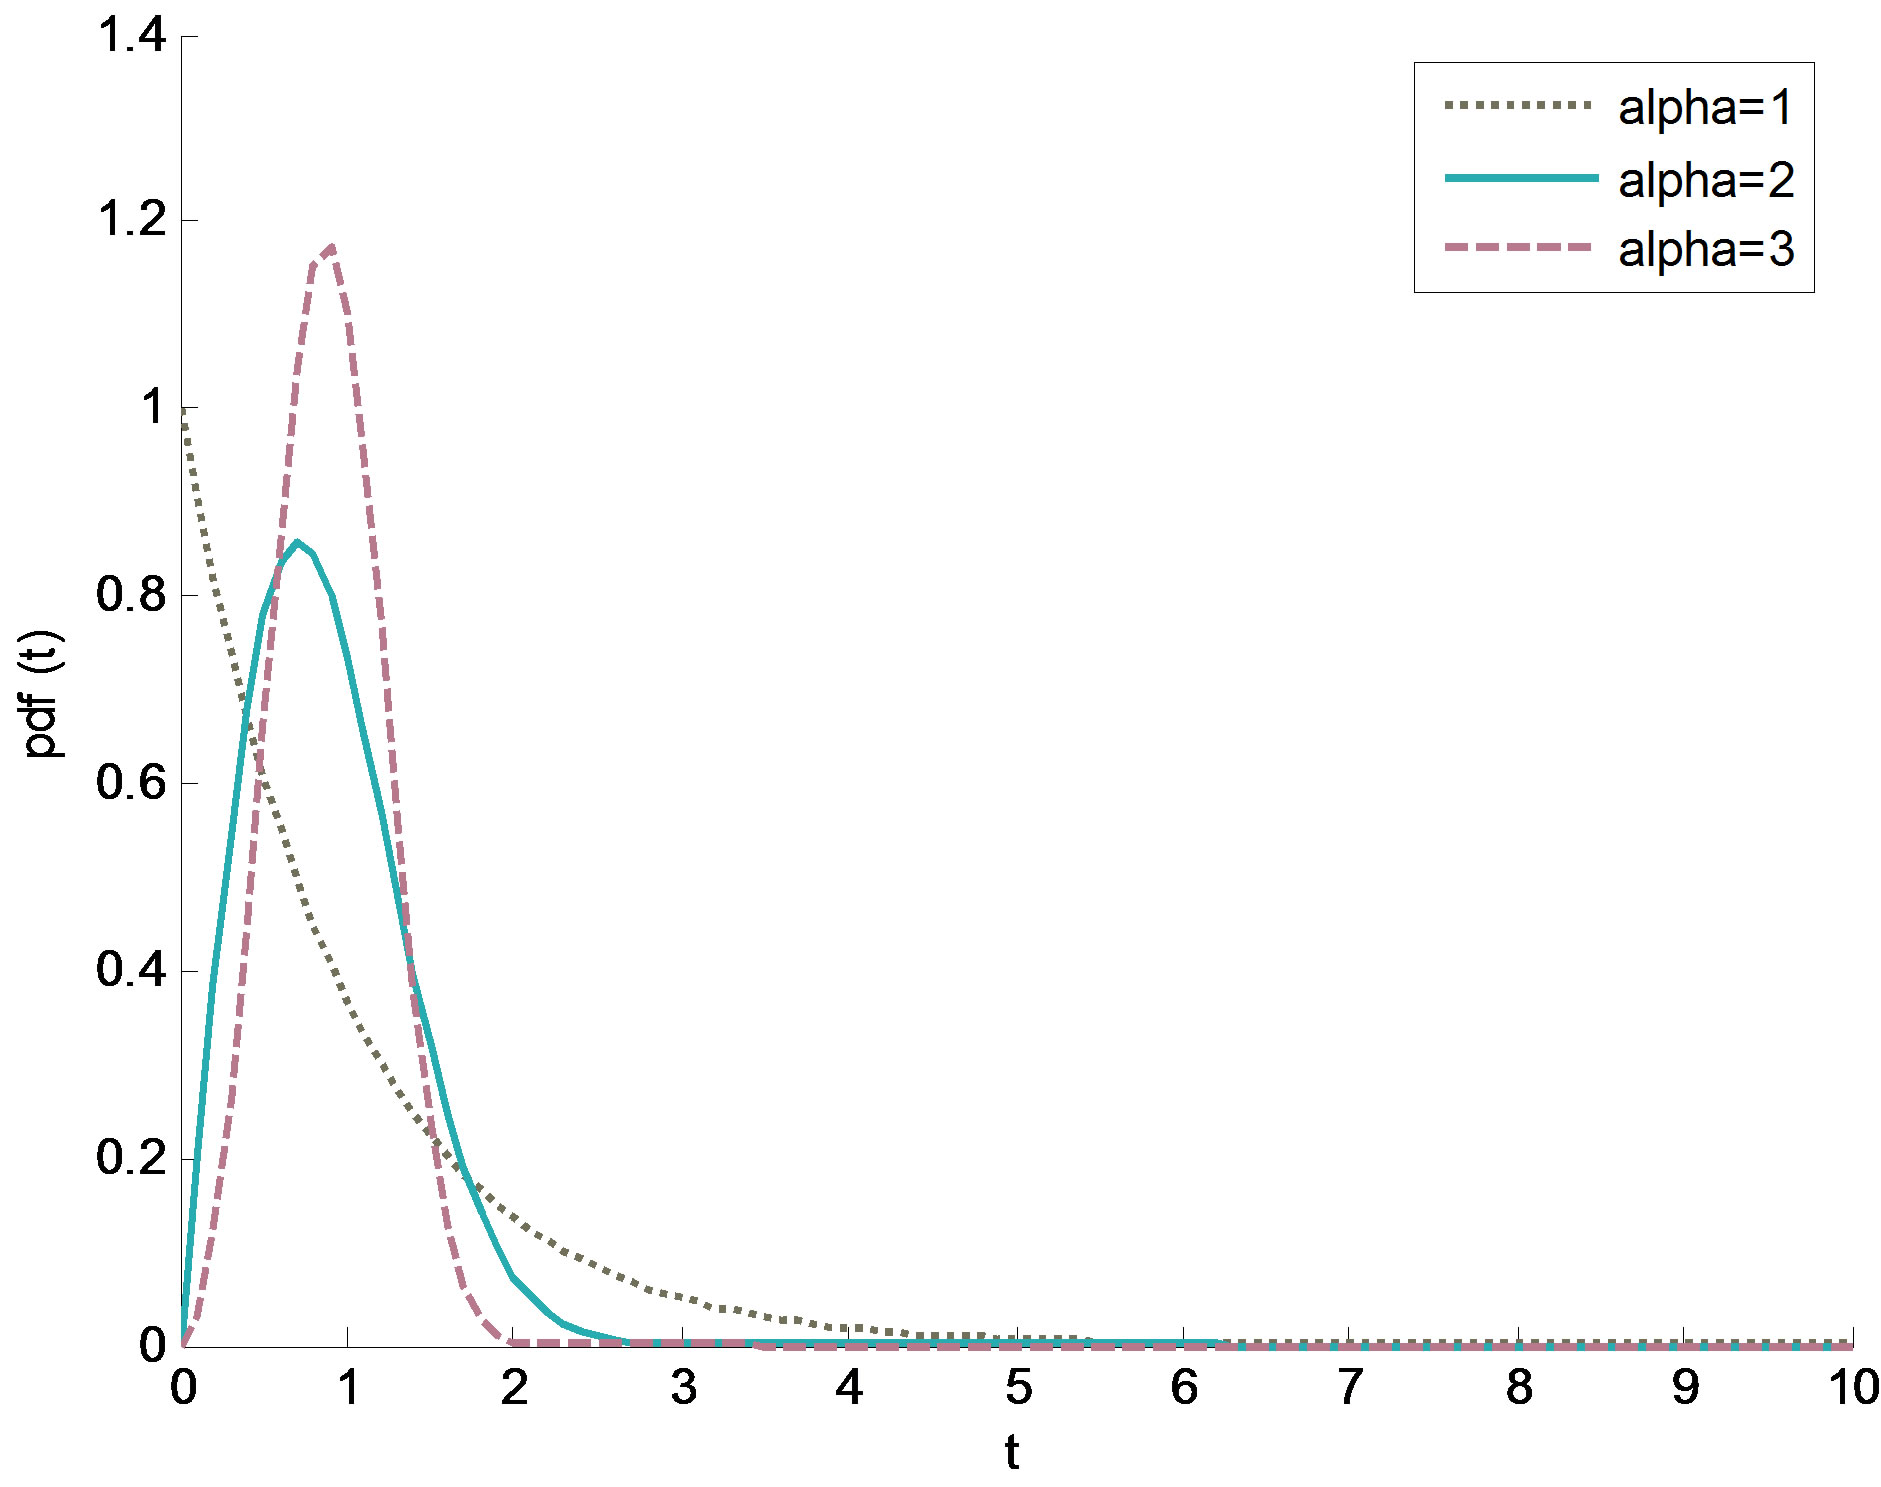
Figure 2. Pdf of outage time duration with Weibull distribution for shape parameter “α” = 1, 2, 3.
distributed received signal envelope.
2) Outage time is assumed to be Weibull distributed.
3) Slow varying shadow effect is compensated by power control.
The analysis presented below derives expressions for AFD, frequency of outage and probability of outage considering tolerable outage.
An outage event is said to be occurred when envelope of a received signal is less than “rth” and stays below for more than predefined finite time duration called as tolerance time “ttol”.
Let “ ” and “
 ” be instantaneous values of outage time and AFD of the channel without considering tolerance time. Case in which “ttol = 0”, is called as static case.
Probability that outage time, ttol, is less than time duration “τ” is given by its CDF, F (tout)
 (10)
(10)
Therefore,
 (11)
(11)
 (12)
(12)
The CDF of Weibull distributed fade duration can be rewritten as
 (13)
(13)
As per the Equation (9),  is 1/λ. Substituting “Equation (13)” in “Equation (12)”
 (14)
(14)
Let “u” be normalized fade duration with respect to average fade duration,  then
then
 (15)
(15)
Since  is decreasing function of “τ”, therefore pdf of outage time is
 (16)
(16)
Using “equations (14), (15) and (16)” and for a specific value of  = “τ”,
 (17)
(17)
Let “ ” and “
 ” be the instantaneous outage time and AFD with tolerance time “ttol”. The pdf of “
 ” will be
 (18)
(18)
when  and is zero otherwise. When tolerance time is considered,
  can be given as
 (19)
(19)
Substituting “equation (18)” in to “Equation (19)”
 (20)
(20)
Further
 (21)
(21)
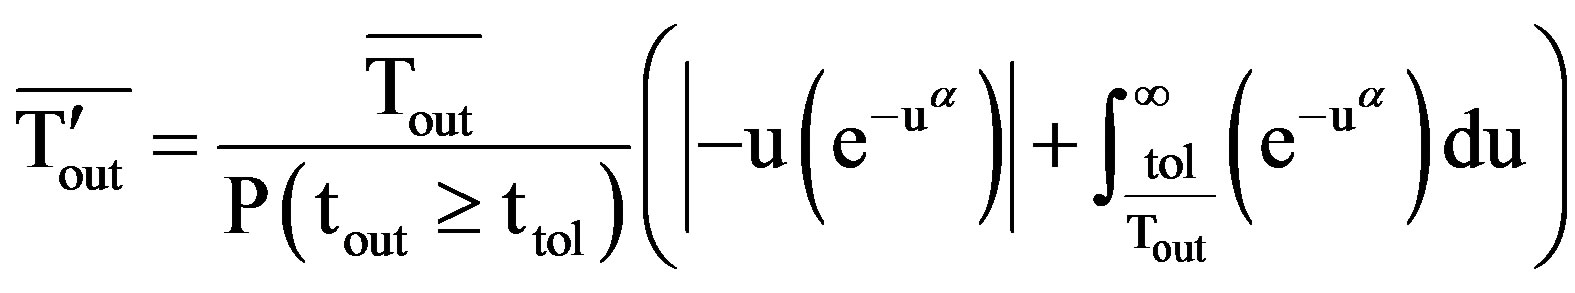
Let “u” be normalized fade duration “ ” with respect to average fade duration, then
 , for
, for  is given by
 (22)
(22)
Substituting 
 in “Equation (19)”
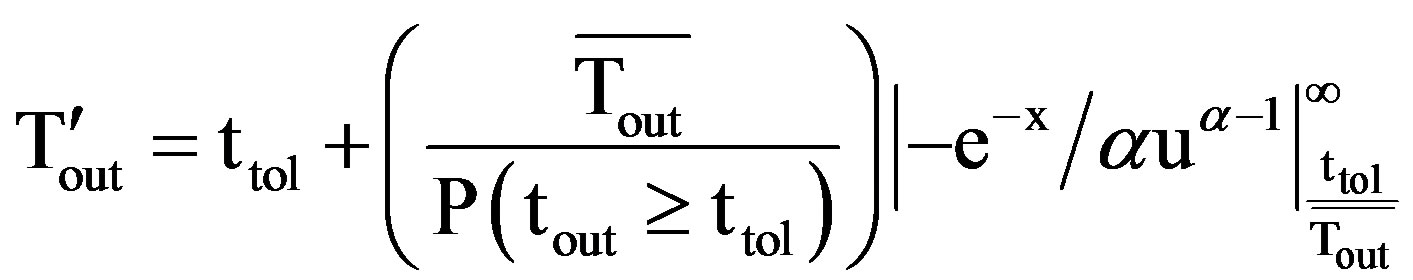
 (23)
(23)
 (24)
(24)
Let  then
then
and “Equation (24)” is simplified as

 (25)
(25)
On further simplification “Equation (25)” reduces to
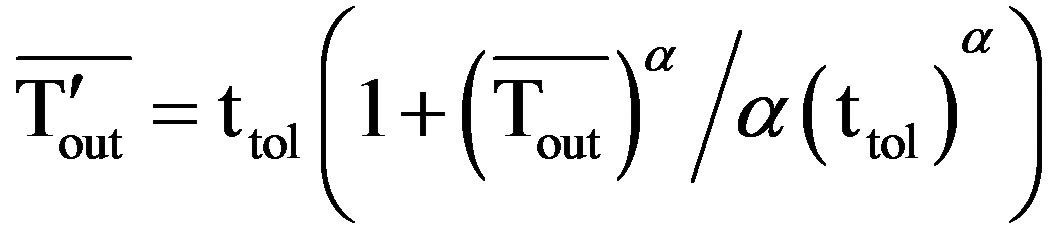 (26)
(26)
Or
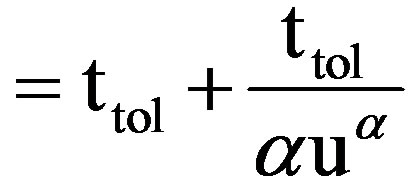 (27)
(27)
Using “Equation (5)” for Nakagami-m channel “Equation (26)” can be rewritten as
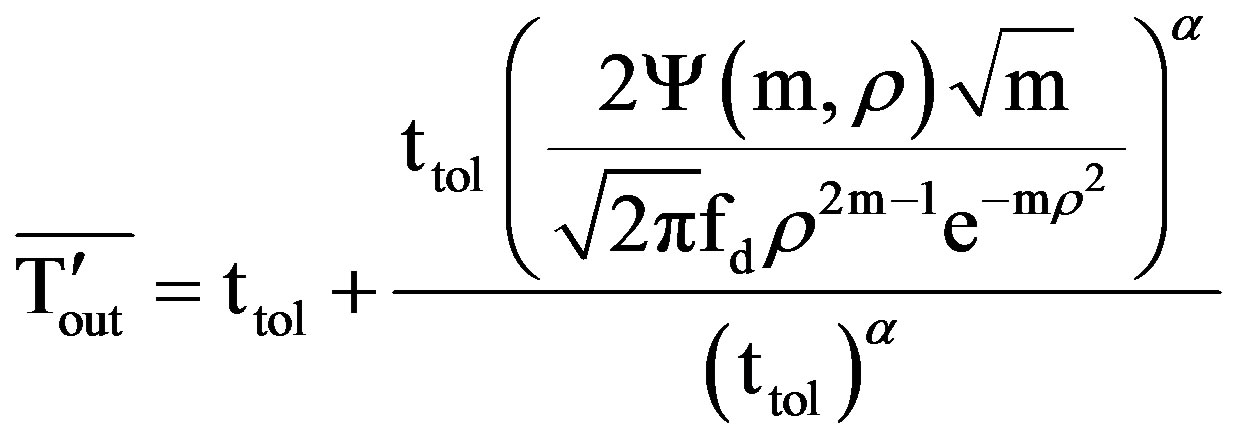 (28)
(28)
The frequency of outage with tolerance time is, therefore, given as
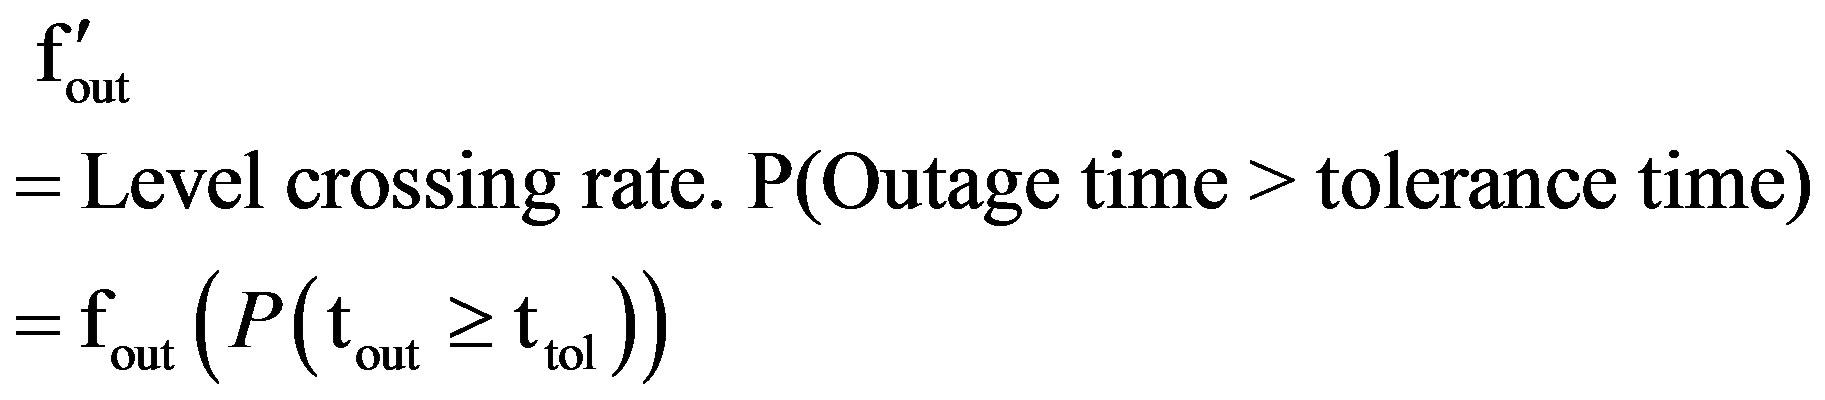
Using “Equation (14)” and “Equation (3)” for Nakagami-m channel,  will be
 (29)
(29)
Thus  can calculate by “Equation (29)”. Further
  is given by
 (30)
(30)
4. Verification of Analysis and Numerical Results
For Rayleigh fading channel the FDD function is presented by Rice [9] as
 (31)
(31)
where “u” is the “tout” normalized with respect to  and I1 is modified Bessel function of first kind. In the present paper Weibull function is selected as FDD. Both the functions converge to exponential function for lower values of “u”. AFD, frequency of outage and probability of outage derived in the paper are found similar to the earlier results based on Rice FDD.
It has been shown [10,11] that for larger value of minimum outage duration,  will converge to 1.5
 . In our case, using “Equation (28)” with α = 1, if
 ,
,
 will achive the given convergence. Further, behavior of fading parameters such as
 , f¢out and p¢out can be calculated for different values of “a” and “m”.
4.1. Case 1: ( = 1
For a =1, “Equations (27) and (29)” reduce to
 (32)
(32)
 (33)
(33)
Substituting the value of “fout” from “Equation (3)”, “Equation (30)” can be rewritten as
 (34)
(34)
4.2. Case 2: m = 1
For m = 1, Nakagami pdf converts in to Rayleigh channel and “Equations (27), (29), (30)”, reduce to
 (35)
(35)
 (36)
(36)
 (37)
(37)
Derived results are same as that for Rayleigh channel.
4.3. Case 3: m = 1 and ( = 1
For case 3, “Equations (28), (29), (30)” reduce to
 (38)
(38)
 (39)
(39)
 (40)
(40)
The results derived in above equations for AFD, frequency of outage and outage probability are function of tolerance time. Variation in Doppler frequency and fade depth are considered for numerical evaluation purpose. MATLAB is used as simulation tool. Figure 3 and Figure 4 demonstrate the variation in frequency of outage with tolerance time for different Doppler frequency. The comparison of frequency of outage with different values of “α” (Weibull parameter or fading rate) is shown in the plots. It is observed that the frequency of outage decreases faster with smaller tolerance time. Further the decrease in slope starts from higher value of tolerance time for higher Doppler frequency. The variation in AFD as a function of tolerance time with Doppler frequency is shown in Figure 5 and Figure 6 for “ρ” = 0.01 and 0.1 respectively. The AFD increases relatively faster with tolerance time for higher value of ρ and lower values of fade depth. These results demonstrate that even the smaller value of tolerance time results in noticeable change in fading parameters.
5. Conclusion
Fade duration analysis plays a significant role in the in the design of physical layer parameters of mobile radio communication systems such as modulation technique, fade margin and forward error correction codes. In this
Figure 3. Variation in frequency of outage with tolerance time for fm = 25 Hz.
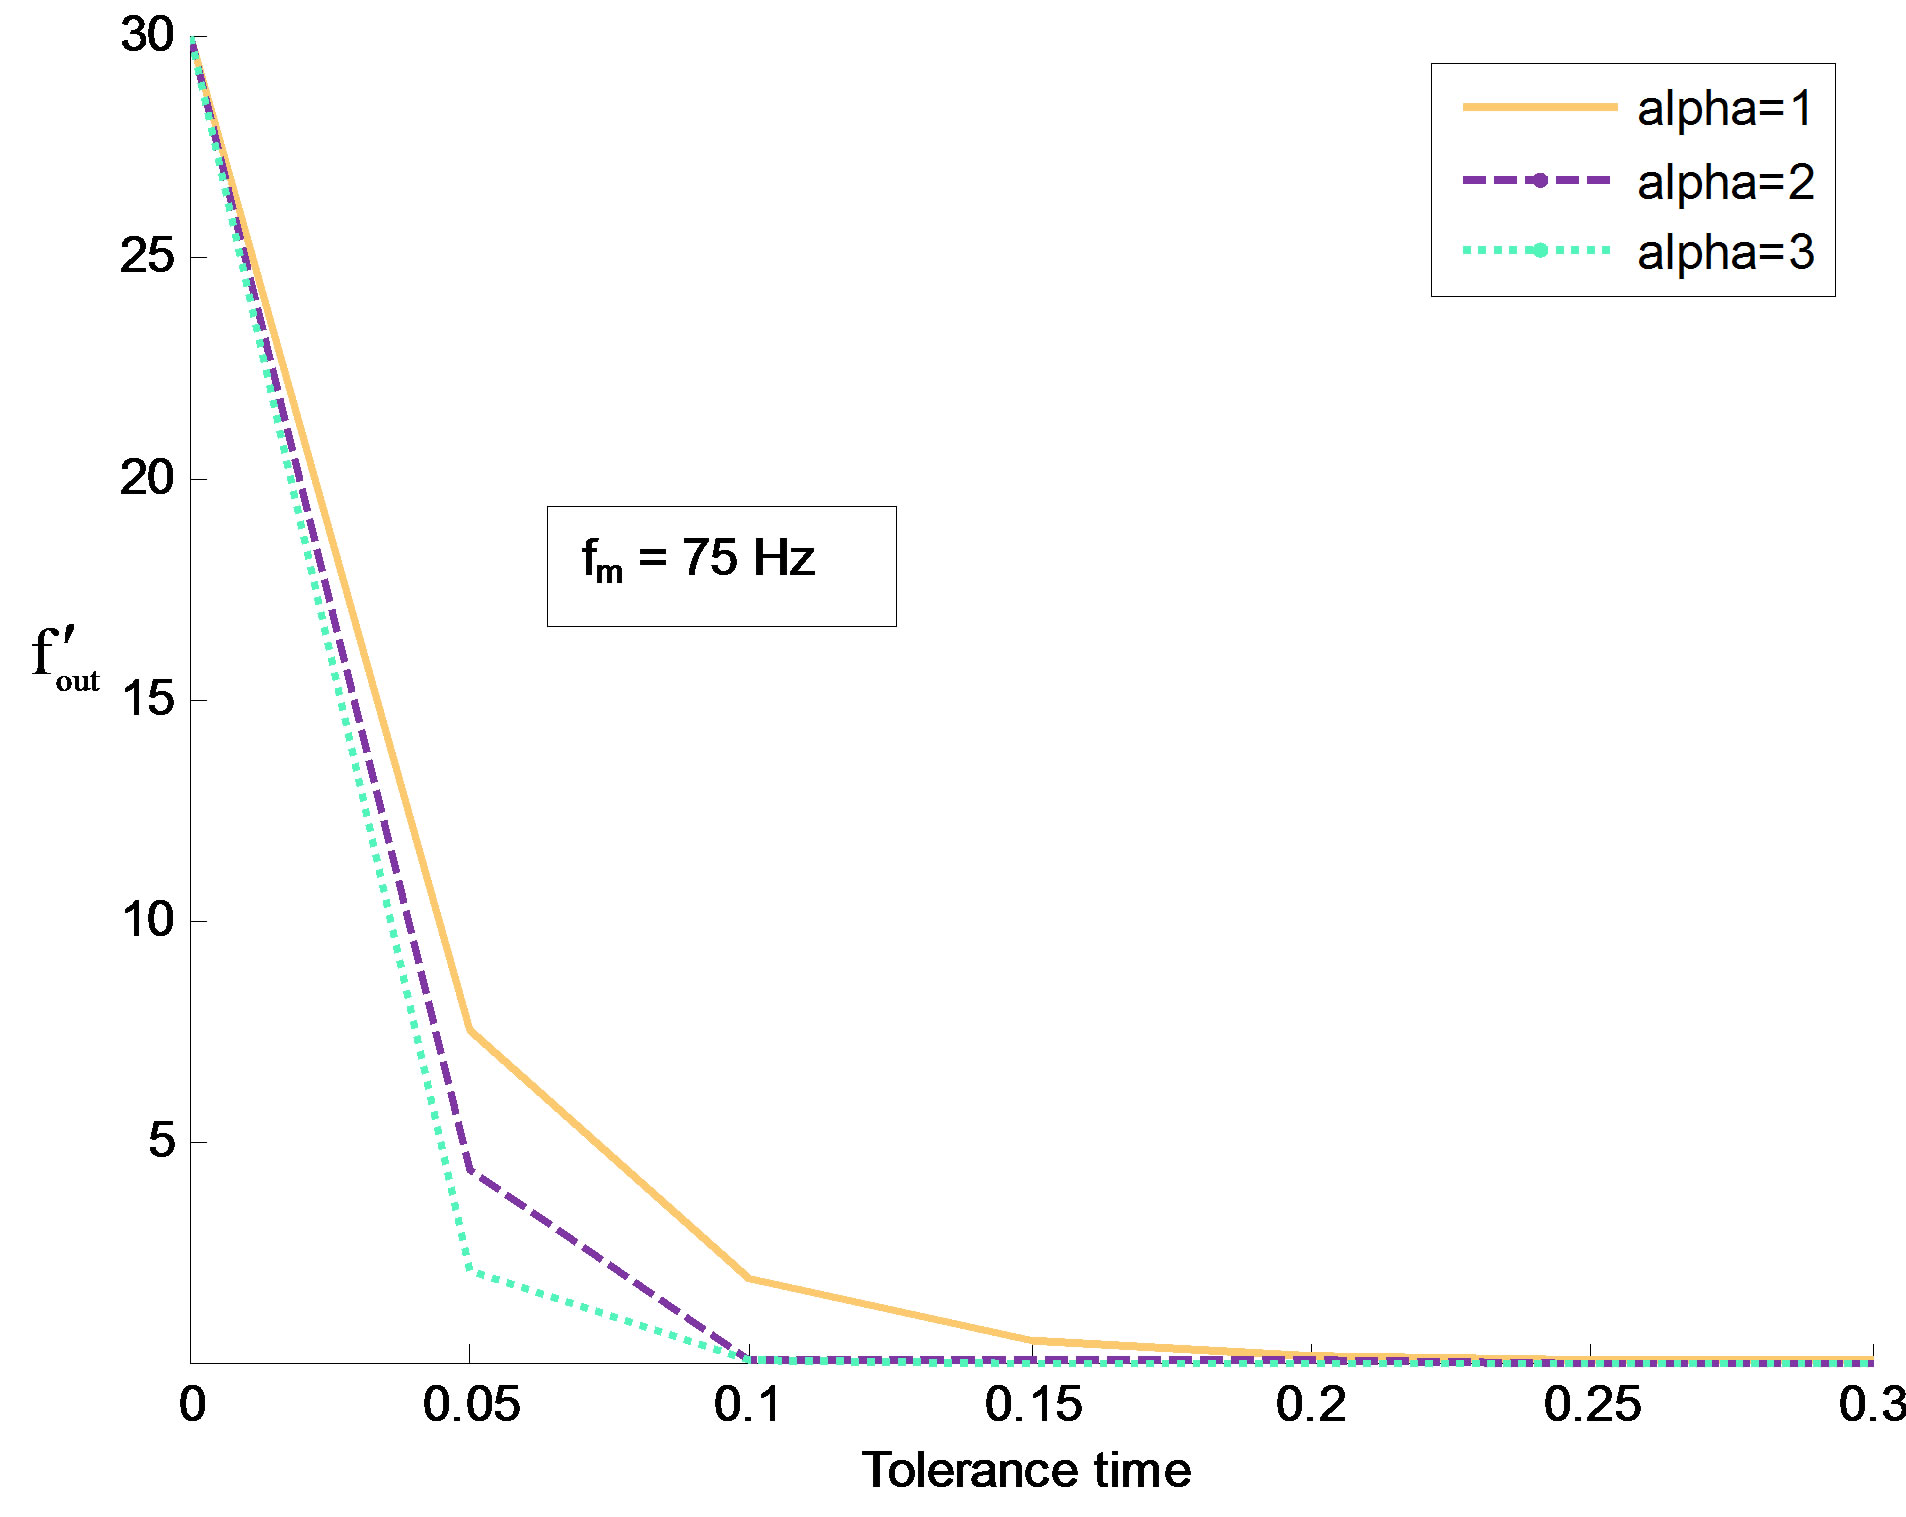
Figure 4. Variation in frequency of outage with tolerance time for fm = 75 Hz.
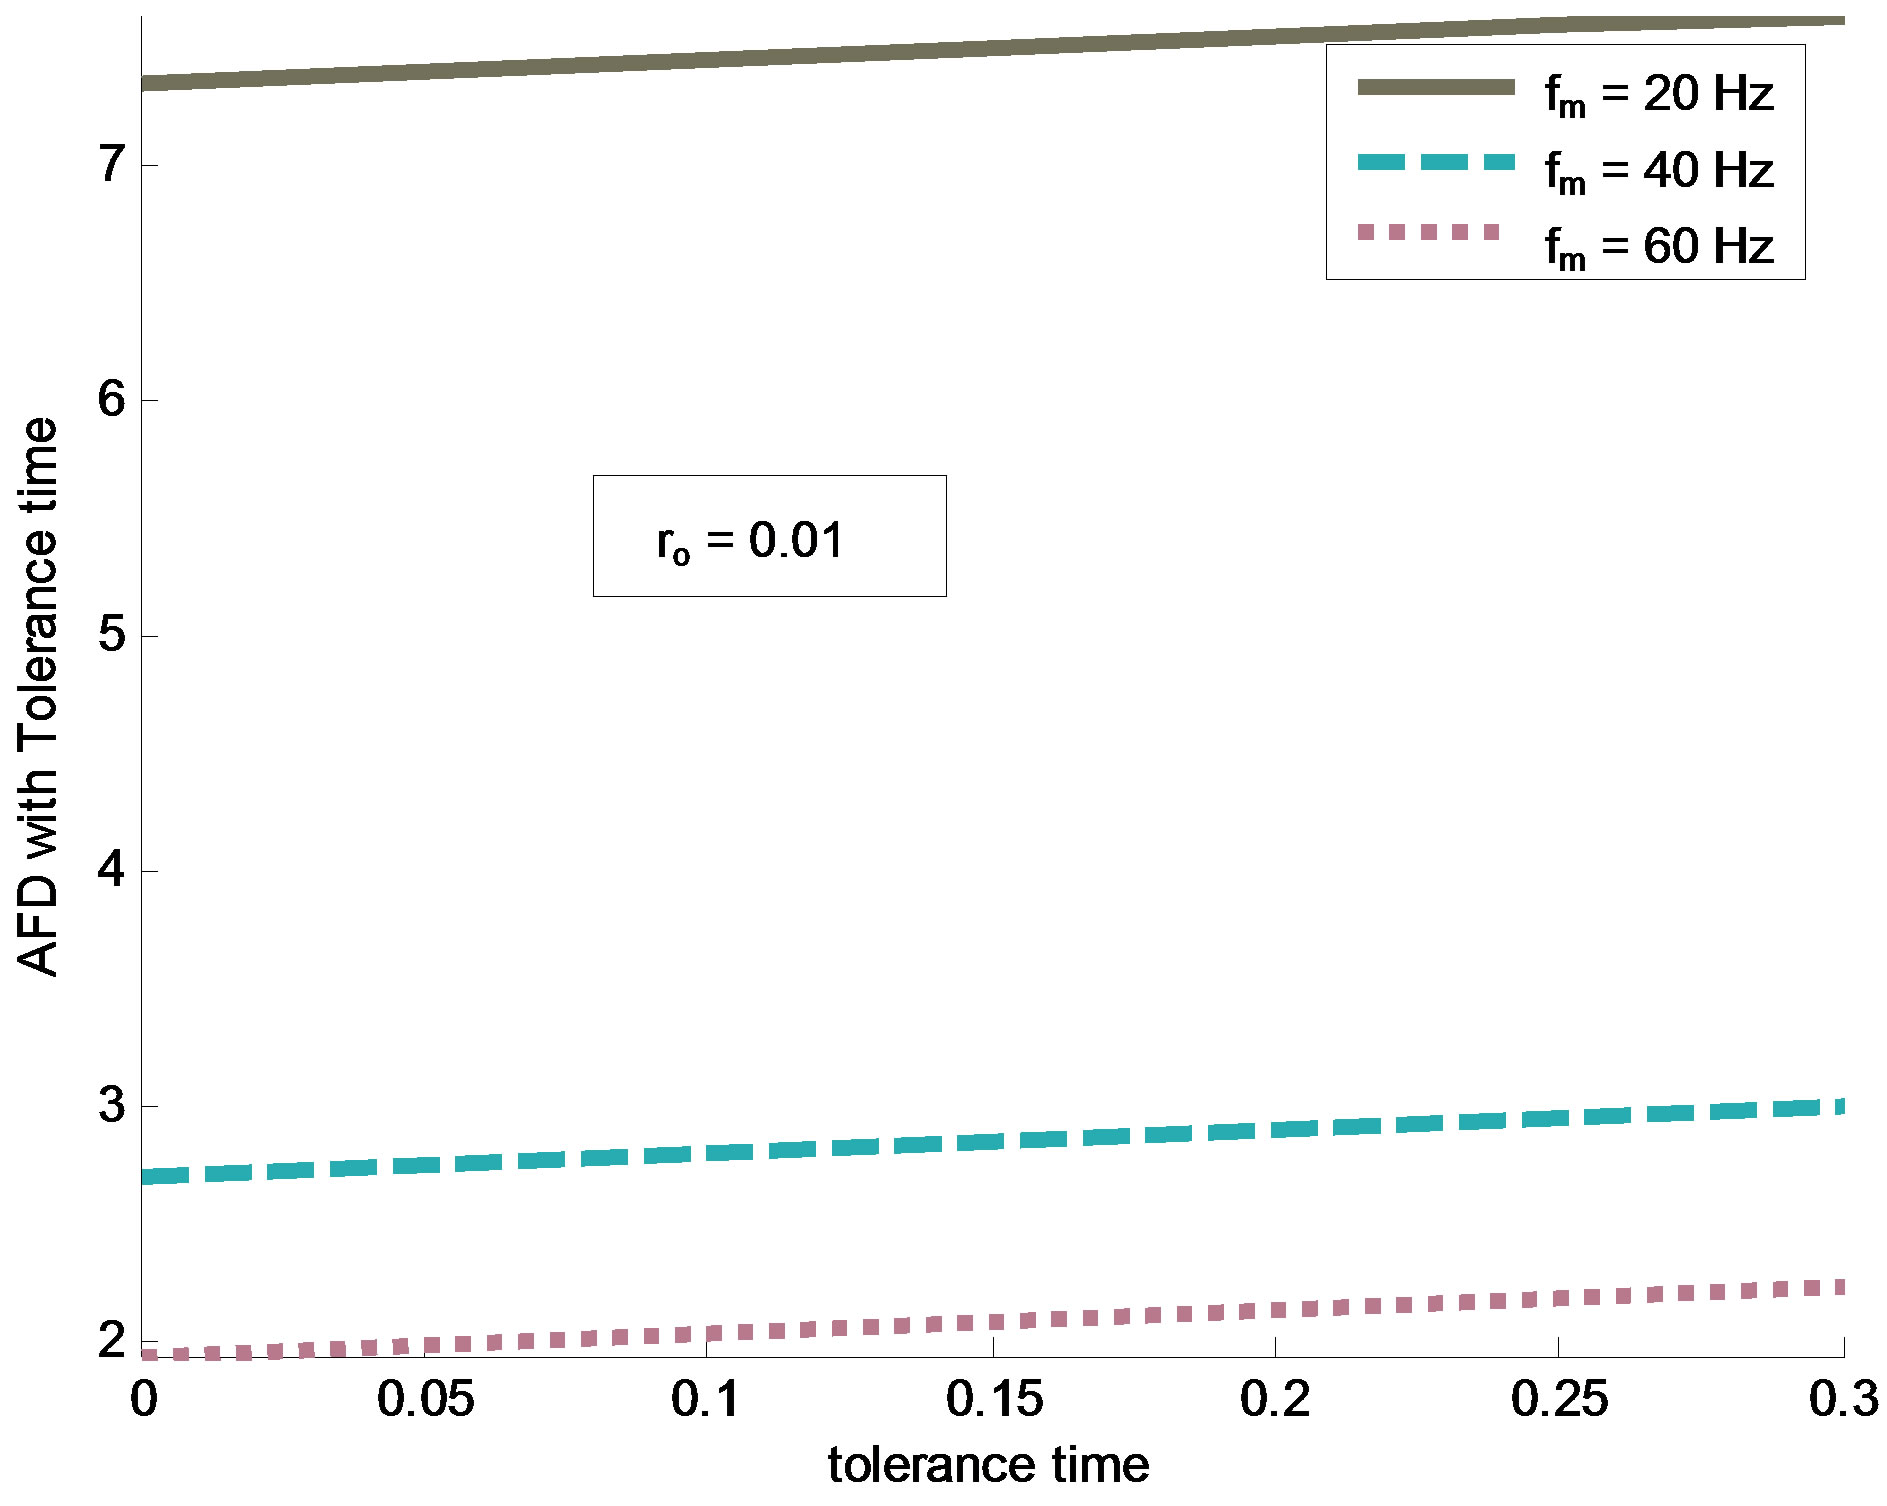
Figure 5. Variation in AFD with tolerance time for different values of Doppler spread and ρ = 0.01.
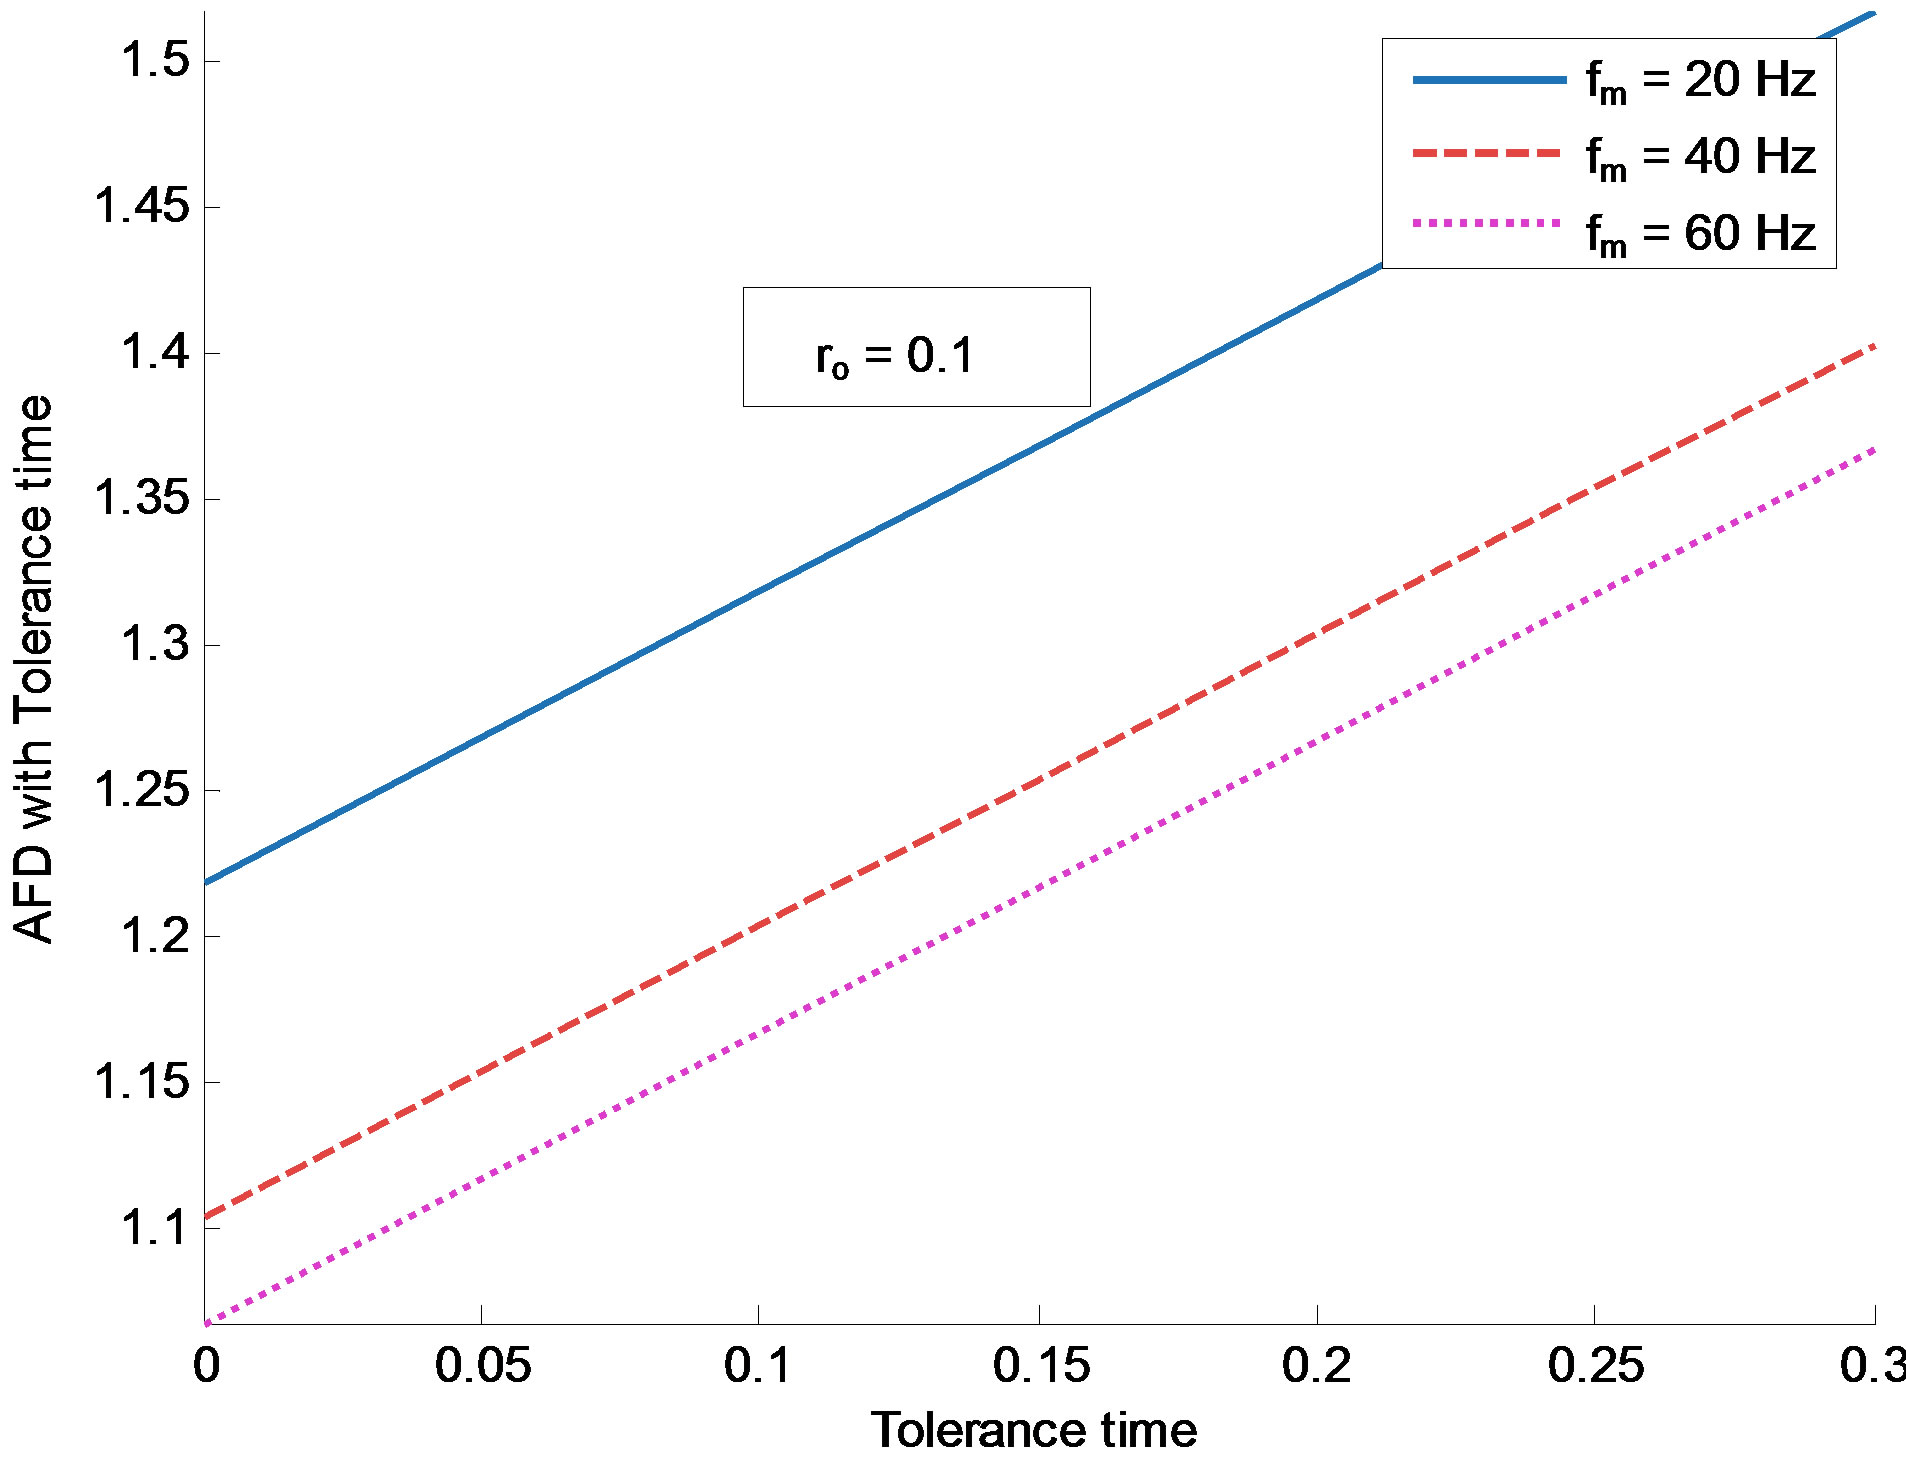
Figure 6. Variation in AFD with tolerance time for different values of Doppler spread and ρ = 0.1.
paper, a concept of short fade duration called as “Tolerance time”, which can be accepted by an application without degradation in quality of service is applied to Nakagami channels. Weibull function is used as probability density function of the fade duration to evaluate the fading parameters such as AFD, frequency of outage and outage probability of the channel. The effect of different Doppler frequency and fade depth on these parameters is also investigated. It has been demonstrated that the ratio of tolerance time to AFD has large impact on all evaluated fading parameters. Once a fading environment is fixed, a proper selection of tolerance time may satisfy the required error performance of a given communication system with burst error correcting capability. Results presented in the paper in terms of fading parameters such as Average Fade Duration (AFD), probability of outage and frequency of outage as a function of tolerance time may be used for more realistic evaluation of higher layer protocol performance and to decide physical layer parameters such as modulation technique and channel coding scheme.
REFERENCES
- C. E. Shannon, “Communication in Presence of Noise,” Proceedings of IRE, Vol. 37, No. 1, 1949, pp. 10-21. doi:10.1109/JRPROC.1949.232969
- B. Sklar, “Digital Communication, Fundamentals and Applications,” Pearson Education, Delhi, 2001.
- W. H. Trenter, et al., “Principles of Communication System Simulation with Wireless Applications,” Pearson Education, Delhi, 2004.
- T. S. Rappport, “Wireless Communication,” 2nd Edition, Pearson Education, Delhi, 2002.
- E. Gilbert, “Capacity of a Burst-Noise Channel,” Bell System Technical Journal, Vol. 5, No. 4, 1960, pp. 1253- 1266.
- F. Ramos-Alarcon, V. Kantorovich and M. Lara, “Outage Probability in Nakagami Channels Using Fade Duration Distribution Approximate Results,” IEEE Transactions on Communication, Vol. 58, No. 4, 2010, pp. 1009-1013. doi:10.1109/TCOMM.2010.04.090035
- Z. Zheng, L. Cuil and A. G. Hawkes, “A study on Single Unit Markov Repairable System with Repair Time Omission,” IEEE Transactions on Reliability, Vol. 55, No. 2, 2006, pp. 182-188. doi:10.1109/TR.2006.874933
- M. Zorzi, “On the Statistics of Block Errors in Bursty Channel,” IEEE Transactions on Communication, Vol. 45, No. 6, 1997, pp. 660-666. doi:10.1109/26.592604
- S. O. Rice, “Distribution of the Duration of Fades in Radio Transmission,” The Bell System Technical Journal, Vol. 37, No. 3, 1958, pp. 588-598.
- L. Jie and N. B. Mandayam, “Minimum Duration Outages in Rayleigh Fading Channels,” IEEE Transaction on Communication Technology, Vol. 49, No. 10, 2001, pp. 1755-1761. doi:10.1109/26.957397
- N. C. Beaulieu and X. Dong, “Level Crossing Rate & Average Fade Duration of MRC (Maximum Ratio Combiner) and EGC (Equal Gain Combiner) Diversity in Rician Fading,” IEEE Transactions on Communication, Vol. 51, No. 5, 2003, pp. 722-726. doi:10.1109/TCOMM.2003.811380
- S. M. Ross, “Introduction to Probability Models,” 9th Edition, Elsevier Publication, Amsterdam, 2007.
- K. S. Trivedi, “Probability and Statistics with Reliability, Queuing and Computer Applications,” PHI publication, New Delhi, 1992.
- R. Billinton and R. N. Allan, “Reliability Evaluation of Engineering Systems: Concepts and Techniques,” 2nd Edition, Plenum Press, New York, 1992.
- A. Jain, P. D. Vyavahare and L. D. Arya, “A Simplified Approach to Estimate the Bounds on Fading Channel Unavailability,” International Journal of Computer and Electrical Engineering, Vol. 2, No. 1, 2009, pp. 218-221.
- N. C. Beaulieu and C. Cheng, “Efficient Nakagami-M Fading Channel Simulation,” IEEE Transactions on Vehicular Technology, Vol. 54, No. 2, 2005, pp. 413-424. doi:10.1109/TVT.2004.841555
- M. Yacoub, et al., “On Higher Order Statistics of Nakagami-M Distribution,” IEEE Transactions on Vehicular Technology, Vol. 48, No. 3, 1999, pp. 2908-2914. doi:10.1109/25.764995