Journal of Environmental Protection
Vol.09 No.09(2018), Article ID:86741,16 pages
10.4236/jep.2018.99060
What Makes a Greener Building? Lessons from Taiwan
Chou-Yen Wu, Shih-Fang Lo*
Center for Green Economy, Chung Hua Institution for Economic Research, Taiwan
![]()
Copyright © 2018 by authors and Scientific Research Publishing Inc.
This work is licensed under the Creative Commons Attribution International License (CC BY 4.0).
http://creativecommons.org/licenses/by/4.0/


Received: July 3, 2018; Accepted: August 17, 2018; Published: August 20, 2018
ABSTRACT
Buildings consume vast amounts of resources and energy contributing to climate change. Some countries have developed green building certification systems. Compared to other developed areas, Taiwan lags behind in green building construction and in response created its own certification for sub-tropical countries called Ecology, Energy Saving, Waste Reduction, and Health (EEWH). But what economic factors truly drive green building construction and quality? Our study sample analyzes 1355 Taiwan green building cases from 2000 to June 2018 to determine the influence of various economic, structural, and policy factors. Results suggest that while public ownership led to more green building certifications, private ownership led to a higher environment rating. Proper incentives are needed to further increase the ratings of public buildings and to expand the construction of highly rated private buildings, especially for small and medium sized buildings.
Keywords:
Green Buildings, EEWH, Empirical Study, Regressions, Certification

1. Introduction
Carbon reductions continue to grow in importance both for environmental protection and for economic development. The building and construction sector is critical to the world economy, serving as one of the major contributors to GDP (Gross Domestic Product) growth and is expected to grow [1] . The built environment is inherently cross-sector using a wide array of products and technologies such as insulation, space heating and cooling systems, water heating systems, lighting, appliances, consumer products, and business equipment. However, with growing population and industry, the sector is also an increasingly large contributor to global warming. For example, in the United States buildings account for 40% of all energy use, and the construction industry consumes more energy than the industrial or transportation sector [2] . Conventional buildings not only consume a lot of energy, but they also use a lot of resources [3] . For example, the US Environmental Protection Agency (EPA) estimates that 250 million tons of municipal solid wastes are generated in the United States every year from the built sector. In contrast, green buildings not only use resources more efficiently, they also function better with more natural lights and better air quality. Since most buildings last for decades, and more than half of the current global building stock will still be standing by 2050, the construction decisions made today will impact the environment for decades [4] . Currently, state and local governments in the United States require building owners and operators to disclose the energy performance of buildings to the public [5] . Private investment in new construction of green buildings is also promoted through tax incentives [6] .
1Leadership in Energy and Environmental Design (LEED) developed by the US Green Building Council (USGBC) [7] in 1998 is a green building certification in U.S.LEED have 4 certification levels: 1) Platinum: 80 points and above; 2) Gold: 60 - 79 points; 3) Sliver: 50 - 59 points; 4) Certified: 40 - 49 points. Current version is LEEDv4 (previous version is LEED2009) released in 2013.
2Impact analysis for Planning (IMPLAN) model uses classic input-output analysis and combines with regional specific social matrices. It is generally used to estimate the economic and impacts of investments in industry, forecast tax revenue and employment generation.
Green buildings have emerged as a way of balancing the economic importance of construction with the large environmental impact of the sector. The United States Green Building Council (USGBC) [7] developed the Leadership in Energy and Environmental Design (LEED) certification to standardize and qualify green building construction. So far LEED-certified building1 have reduction of 34% in CO2 emissions, 25% in energy, and 11% in water according to LEED2009 (2013). Green buildings mitigate environment impacts by setting standards for siting, design, construction, operation, maintenance, renovation, and demolition. Green buildings also have the potential to drive growth in a range of other industries including design, technologies, materials, and services (See Figure 1). A wide range of green materials and technologies are already available that can significantly reduce energy and water consumption and CO2 emissions in new and existing buildings; however, economic and non-economic barriers are slowing their adoption. Capital restraints and construction costs are the main economic barriers in the green housing development process [8] . Kats (2003) [3] investigates 60 LEED-rated buildings and focuses on two benefits of green buildings, including lower energy costs, and health and productivity benefits. He finds that green buildings are on average 25% - 30% more energy efficient and are more likely to purchase grid power generated from renewable energy sources compared with non-green buildings. Furthermore, green buildings create more jobs because of increased demand for energy efficiency services and technologies [5] . Burt, Desiderio, Waltner, and Zeidenberg (2011) [6] suggest that revised tax incentives would promote better buildings and create over 77,000 new jobs. Using Impact analysis for Planning (IMPLAN) model2, Burr and Garrett-Peltier

Figure 1. Major categories of green building industrial sectors.
(2012) [5] estimate that green buildings will create 23,713 new jobs in 2015 and 59,620 in 2020.
Previous literature demonstrates green buildings outperform conventional buildings. Moreover, green building occupants showed significantly higher satisfaction compared to non-green building occupants [9] . However, the evidence on whether the cost of green building is more than conventional buildings is inconclusive [10] . Green buildings are commonly perceived to be much more expensive than the conventional ones. Early studies show that construction costs for green buildings is higher than non-green buildings [11] . But some studies found that capital cost premiums are coming down. Matthiessen and Morris (2007) [12] provide evidence that there is no significant difference in average costs between green buildings and non-green buildings. Over the movement of green building, development of green technologies and lower costs for these technologies are required [13] . Dwaikat and Ali (2016) [10] review literature on cost premium of green buildings. They demonstrate that very little evidence show that the cost of green buildings is less than conventional buildings.
Another challenge comes from geographical variation across regions. For example, many standards for green building design are not suitable for countries in subtropical zones, since most assessment methods were initially formulated by countries in temperate or cold zones. Further there are different biodiversity, construction, and cultural factors between regions. In response, Taiwan created the Ecology, Energy Saving, Waste Reduction, and Health (EEWH) certification system for subtropical countries. Many green building certification systems in other countries are developed based on BREAM or LEED. The EEWH in Taiwan was independently developed in 1995 and published in 1999. It is the first certification system designed for buildings in subtropical countries with high temperature and high humidity and is also the first Asian certification system for green buildings.
The promotion of green buildings in Taiwan started in 1999 and has grown rapidly. The growth trend of green buildings in Taiwan is shown in Figure 2. As green buildings continue to grow in importance, this paper aims to investigate what factors affect EEWH certification level and the possible policy implications of promoting of green buildings in Taiwan.
Green building label has great effort in Taiwan. According to the statistics by Taiwan Architecture & Building Center (TABC) [14] , as of the end of 2017, total of floor area of EEWH-certified buildings covered 70,467,859 m2 and EEWH-certified buildings have saved 1,676,498,497 kWh (or 888,783,776 CO2eq) per year and reduced water demand by 79,329,904 m3 per year. According to Carbon Dioxide Information Analysis Center (CDIAC), CO2 emission per capita per year in Taiwan are around 3 times of global average. Designing strategies to reduce the environmental impact of buildings is crucial for environmental health and energy security since Taiwan depends on imports for 99.3% of its energy needs and buildings account for 28.3% of all energy use in Taiwan.
Roughly equivalent to LEED in the United States, CASBEE (Comprehensive Assessment System for Building Environmental Efficiency) in Japan, and HQE (Haute Qualité Environnementale) in France, the EEWH system contains 9 indicators that fall into 4 categories (Table 1). The rating system classifies buildings into 5 levels: eligible, bronze, silver, gold, and diamond. Here, diamond is the highest level and buildings most score higher than 53 points across 7 indicators. Eligible is the lowest level and can be achieved by only addressing 4 indicators and accumulating between 12 and 26 points.
This article aims to investigate factors affect EEWH certificated level of green buildings rated by the EEWH assessment system in Taiwan by analyzing 2503 Taiwan green building cases from 2000 to June 2018. The paper is organized as follows, Section 1 introduces the background and motivation of this paper.
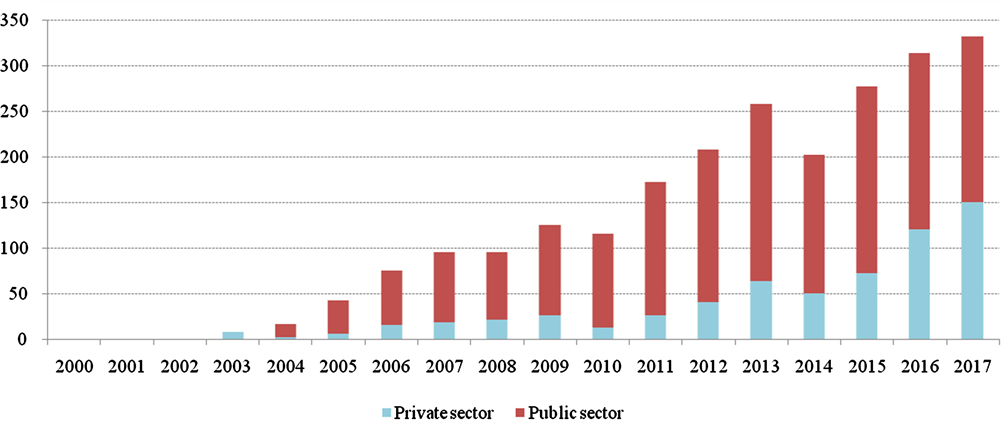 Source: Based on data from the web site of TABC (Taiwan Architecture & Building Center) [14] .
Figure 2. The trend of green buildings label in Taiwan-certification.

Table 1. EEWH system and its categories and indicators.
Source: Taiwan architecture and building research institute.
Section 2 presents the implications and economic literature about green buildings. Section 3 describes the data sources and methodologies in the paper. In Section 4, we describe the empirical results and share our conclusions in Section 5.
2. Literature
2.1. The Importance of Evaluating the Value of Green Buildings
Prior literature on green building certification concludes that certification provides a market premium compared to a non-green building. For example, Fuerst and McAllister (2009) [15] found that the occupancy rates of LEED and Energy Star-labeled offices are higher than those of non-labeled offices (approximately 8% higher in LEED-labeled offices and 3% higher in Energy Star-labeled offices) in the United States, controlling for differences in age, height, building class, and quality. Similarly, rent and sale price for certified green buildings receive a premium compared with conventional buildings [16] [17] [18] . While prior literature on the financial implications of certification mostly focuses on the United States, Chegut, Eichholtz, and Kok (2013) [19] investigate the expanding supply of “green” buildings in London over the period of 2000 and 2009. Published in 1990 by the Building Research Establishment (BRE) the BRE Environmental Assessment Method (BREEAM) is the UK’s certification system and is the oldest green building certification used in more than 50 countries. Chegut, Eichholtz, and Kok (2013) [19] suggest that green buildings rated by BREEAM bring a gentrification effect because the expanding supply of green buildings has a positive impact on rents and prices in general. However, each additional green building reduces premiums for certified buildings in the rental and transaction markets by 1% and 4%, respectively. Finally, green renovations also have a positive impact. Kok, Miller, and Morris (2012) [20] investigate the effect of LEED buildings certified under EBOM (Existing Building: Operations and Maintenance) from 2005 to 2010 on rents and occupancy rates. The results show that renovated sites have significant rental premiums, and green buildings have lower operational costs, such as lower premiums charged by insurance firms if buildings are upgraded to LEED. Mattoni et al. (2018) [21] compare well-known green building labels (CASBEE, Green Star, BREEAM, LEED and ITACA) and intend to find what issues have impacts on the final performance rate of each system.
In summary, green buildings have positive impact on occupancy rates, rents, and sales prices in general, for both new construction and renovations; however, a surge in the supply of green buildings does not have a significantly positive premium compared with comparable high-quality property investments. Finally, each additional green building may eat away at the premiums for certified buildings in terms of rents and sales prices.
2.2. The Importance of Governmental Policy Instruments in Green Buildings
Governments have strong purchasing power usually accounting for 10% - 15% of total GDP, and can leverage these purchases to achieve environmental policy goals through green procurement [22] . Government green procurement policies are especially prevalent in the US and Europe where different departments set environmentally preferable purchasing guidelines for goods and services ranging from cleaning supplies to electricity. Governments are an especially large customer in the real estate market as well, with 26.3% of all spending on maintenance, repair and construction coming from federal, state, and local governments [23] .
Price remains a real barrier for many green developments. On average, green buildings cost 3% - 4% more than conventional buildings, according to a report by the [24] . Based on survey data, Zhang, Shen, and Wu (2011) [8] found that financial considerations seem to be the biggest barrier in promoting green strategy in the housing development process, including higher cost in relation to customer demand, higher costs for green appliance design and energy-saving materials, and insufficient policy implementation efforts. Due to the barriers of green building development strong government procurement policies are required, for example through price preference rewards or quantity targets. Government purchasing also affects private-sector purchases through supply chain development on both supply and demand.
The major aim of public procurement policies is to spur private-sector demand and cost-reducing innovation among suppliers [23] [25] . The three policy instruments usually used by governments are listed as follows [26] :
1) Expanded building codes: Sustainable requirements for new developments have been the primary mechanism to ensure energy-efficiency structures in the EU and the United States. This strategy mainly affects new construction.
2) Disclosure certificates: Disclosure certificates, such as LEED and Energy Star in United States, and BREEAM in UK, are an important green building promotion mechanism. Previous studies have provided empirical results demonstrating that energy-efficiency certificate disclosure promotes investment in green buildings and boosts sales prices of buildings.
3) Direct subsidies: direct subsidies provided by government agencies or public utilities may encourage energy-efficient investments. However, they are not a major driver of new energy-efficiency investments, especially in times of lean fiscal budgets.
Table 2 demonstrates the priority policy actions needed in green building promotion. The priority policy actions table lists the categories and components of green buildings in accordance with overall saving potential, policy urgency, and impact period, individually. The International Energy Agency (IEA) (2009) [4] also suggests that the policy challenge faced by developing countries is different from OECD countries and economies in transactions (EITs). In developing countries, lifespans of buildings are much shorter and the growth rate of overbuilding stock is also rapid. Thus, the priority for developing countries is to limit energy consumption of new construction through building standards and expanded building codes.
Kuo, Lin, and Hsu (2016) [27] use the data of EEWH label in Taiwan and investigate what policies promote development of green buildings through Secondary Data Analyses. They find the policy action to promote green buildings through 6 types: 1) regulations and standards of green building; 2) policies in
Table 2. Priority policy actions for green building promotion.
Note: Overall savings potential is relative to their contribution to total savings in the buildings sector. Source: IEA (2009).
public sector; 3) rating-based assessments; 4) incentive policies; 5) incentive policies with local specialties and conditions; and 6) strength to marketing efforts. Chan, Darko, and Ameyaw (2017) [28] also find the similar conclusions through a questionnaire survey with 104 green building experts around the world. They find 4 important promotion strategies for green buildings, including government policies and regulations, financial incentives, information on cost and benefits on green buildings, and the green building label.
2.3. The Green Building Policy Promotion and EEWH System in Taiwan
The EEWH is the first certification system designed for buildings in subtropical countries featuring high temperature and high humidity. It is also the first Asian certification system for green buildings. EEWH uses a different assessment method than BREAM or LEED, looking at integrated performance instead of individual subject performance.
EEWH was developed in 1995 and published in 1999 and was initially developed from regulations on energy saving. Since then it has expanded to include indicators for ecology, energy saving, waste reduction, and health. The assessment system was designed based on research in subtropical weather. The first version was published in 1999 and consisted of 7 indicators, including greenery, soil water content, energy conservation, CO2 emissions reduction, waste reduction, water conservation, and sewage and garbage improvement. The version in 2003 added two indicators, biodiversity and indoor environment creating a total of 9 indicators and 4 categories. Moreover, buildings have to obtain four indicators in order to reach the minimum certificated level. The 2004 version divided the assessment into different categories based on development type including residential, industrial, renovations, and community. According to the latest 2009 version, the EEWH System includes 4 categories: 1) Ecology; 2) Energy Saving; It also includes 9 indicators: 1) Biodiversity; 2) Greenery; 3) Soil Water Content; 4) Energy Conservation; 5) CO2 Emissions Reduction; 6) Construction Waste Reduction; 7) Indoor Environment; 8) Water Conservation; 9) Sewage and Garbage Improvement, as shown in Table 1. Each indicator has different evaluation items and score criteria. The EEWH certification level of building is classified 5 levels according to the sum of scores of 9 indicators. The highest level “Diamond” requires more than 53 points while the lowest level “Eligible” only requires a score between 12 and 26.
The application of EEWH label is submitted by building owners to the Green Building Label Review Committee. There are 2 stages of evaluation of EEWH: 1) document stage; 2) assessment stage. For the first stage, the applicant submits related documents, including application, license for usage, design proposals, assessment table of green building, and authorization letter. The Green Building Label Review Committee would check above documents, and then the applicant pay the fee. For the second stage, an assessment tem arranged the Green Building Label Review Committee attends the on-site inspection according to the application. If the situation of the building does not matched with the application, the applicant is required to pay the insufficient fee and re-submit the document stage. If the situation of building matches with the application, the assessment team scores indicators and then finish the assessment report. Finally, the building has an EEWH level according to the scores of indicators.
The rapid growth of EEWH is partially attributed to government’s regulations and promotion since 2003. All public buildings with construction cost over 50 million NT dollars must be EEWH candidates. For example, Taipei Public Library’s Beitou Branch, listed as one of the “10 Coolest Examples of Green Buildings by the WHEN ON EARTH website,” received diamond certification across 9 indicators in 2006.
3. Date and Methodology
3.1. Data
We analyze the economics of green buildings rated by the EEWH assessment system in Taiwan. The EEWH cases are obtained from the Taiwan Architecture & Building Center (TABC) [14] website. The Construction and Planning Agency, Ministry of the Interior authorized TABC [14] to evaluate applicants of EEWH certification. Buildings after construction can apply to TABC [14] for EEWH certification and then TABC [14] evaluates the applications. Therefore, TABC [14] has all green building cases for EEWH system in Taiwan and it uploads new cases to its website.
We obtain EEWH cases over the period of 2000 and June 2018 from TABC [14] website. Buildings with Candidate EEWH Certification are not in our sample since they have not received green building label yet. We also exclude the EEWH cases if the building area, EEWH level, and more than 3 items are not available. The final sample consists of 2503 Taiwan green building cases from 2000 to June 2018.
3.2. Methodology
Previous literature studying the economics of buildings with green certification often follow Eichholtz, Kok, and Quigley (2010) [16] , and usually uses regression models for analysis. In this paper, we aim to determine what makes a building achieve higher levels of green certification by investigating the factors behind the EEWH level and trying to correct these factors across several categorical variables. We therefore follow prior literature using regression [16] [17] [18] [19] and adjust our models according to the conditions and features specific to Taiwan. The model is set as
(1)
where the dependent variable is the rating level (EEWH-label) of a building coded from 1 to 6, denoting non-classified, eligible, bronze, silver, gold and diamond level respectively. For example, the code of Diamond level is 6 and the grade Gold level is coded as 5, and so on. The level of non-classified or free assessment codes 1. In other words, the higher the level code, the higher the grade in the EEWH levels. is a vector of the characteristics of building i, including building features, floor area, and macroeconomic conditions (see Appendix for the description of independent variables). The symbols α and β are estimated coefficients, and is an error term.
4. Empirical Results
4.1. Summary Statistics
Table 3 shows the summary statistics and Table 4 shows the distribution of
Table 3. Summary statistics.
Table 4. Green building label classification by year.
EEWH level by year. In Table 3, the mean of #index is 4.935. Indicators such as “greenness,” “daily energy saving,” “water resources,” and “sewage and waste” mostly mentioned. Buildings with the highest two EEWH levels, Diamond level and Gold level, account for 7.0% (175 cases) and 6.8% (171 cases) of the sample, respectively. The largest proportion is at the Eligible level, accounting for 45.2% (1131 cases) of the overall sample. The remaining, unrated cases account for 15.1% (378 cases) of the total sample (see Table 3 and Table 4).
The proportion of EEWH certified buildings in the public sector account for 71.4% (1787 cases) while the private sector accounts for the remaining 28.6% (716 cases). The mean of number of floors for buildings in the sample is 6, with 5 above ground and 1 basement level. The mean of total floors, number of ground floors, and number of underground floors are 7.495, 6.274, and 1.221, respectively. In terms of building types, reinforced concrete (RC) structures account for the highest proportion, about 74.6%, followed by 13.4% seismic steel (SS) and 11.9% steel reinforced concrete structures (SRC). Regarding building purpose, education at (school or university) makes up the majority representing approximately 23.7%, followed by large space buildings (21.0%), office buildings (18.3%), and housing (17.3%). In general, most green office buildings are government departments or public sector offices.
When it comes to the locations of green buildings, most are in the northern region of Taiwan, with 1169 cases (46.7%), followed by the southern region (28.8%) and central region (20.1%). In the northern region, Taipei jurisdiction accounts for the most, with a total of 355 buildings; Kaohsiung jurisdiction has 324; and in the central region, Taichung accounts for 256 cases.
4.2. Effects of Building Feature in EEWH Level
Table 5 shows the regression results between the dependent variable (level code)
Table 5. Effects of building feature in EEWH level.
This table reports regressions of the relation between levels of EEWH and architecture character factors. The sample contains 2503 EEWH cases in Taiwan from January 2000 to June 2018. Variable definitions are provided in the Appendix. The t-statistics are in parentheses. “***”, “**”, and “*” represent 1%, 5%, and 10% significance levels, respectively.
and the independent variable (characteristics of specified green building cases). The results show that throughout all models, there is a significant positive relationship between Private ownership and level code, such that the green buildings in the private sector are more likely to have a higher EEWH grade than those in the public sector. For example, in Model (2), coefficient on Private is 0.883 and significantly positive with EEWH level. The similar results can be observed in other 3 models.
There is a significant positive relationship between the total floor area and the level EEWH grade, such that the larger the total floor area, the more likely the building was to get a better EEWH rating. Analyzing the building structure, both Structure_SS and EEWH grade are significantly positively related, showing that buildings with steel reinforced structures are more likely to get better EEWH grades than those with concrete. Structure_SRC and EEWH grade in Models (1) and (3) are significantly positively related, but in the other three models this relationship is not significant. No evidence shows that buildings with steel reinforced structures got a better EEWH grade than those with reinforced structures.
From the perspective of building sectors, the result of model (5) shows large buildings is significantly positively related to the EEWH level, with these types of buildings more likely to get higher grades. The coefficient on large building in model (5) is 0.228. School is significantly positive with EEWH grade. Moreover, most large buildings are from public sector, which can be attributed to the government policy that all public buildings with construction cost was over 50 million NT dollars are required to be EEWH candidates. Our results also show that buildings from private sector have more incentive to get higher certification levels than buildings from public sector, which implies that most of owners of industrial building with EEWH certification are private sector thus they have more incentive to get higher EEWH level certifications.
5. Conclusions
It is generally recognized that buildings consume a large portion of resources in the economy, and the energy consumption growth of the building sector has surpassed the industrial and transportation sectors recently. Compared to the other developed countries, the certification system of green buildings (EEWH) in Taiwan is specially designed for subtropical countries. EEWH is also the first Asian green building certification system. The rapid growth of green buildings in Taiwan is a result of government policy promotion, as well as low carbon society awareness in recent years.
This study intends to focus on determining the factors influencing green building rating by the EEWH assessment system in Taiwan. The study sample includes 2503 Taiwan green building cases from 2000 to June 2018. From our empirical study, we find: First, the rating of a green building is significantly related to its private/public ownership, floor area, building structure, and building sector. Second, large buildings are mostly from public sector, which can be attributed to the government policy and regulation on large-scaled public buildings. Third, the buildings from private sector have more incentive to get higher certification levels than buildings from public sector, which implies that private sector has more incentive to get higher EEWH level certifications.
In conclusion, buildings owned by private sector or of large scale have more incentive to get higher level of EEWH certification in Taiwan. However, despite the large number of buildings that have some level of EEWH certification, it is generally much lower for public buildings, implying that they are only targeting the minimum legal requirements. In order to further encourage green buildings for medium and small scaled buildings are next stage policy target to get higher level of EEWH certification. Proper policy tools, such as expanded regulations, disclosure certificates, or direct subsidies, tailored for medium and small ones are worth future investigation.
Acknowledgements
The authors greatly acknowledge the financial support from the National Science Council (NSC 102-2410-H-170-007).
Conflicts of Interest
The authors declare no conflicts of interest regarding the publication of this paper.
Cite this paper
Wu, C.-Y. and Lo, S.-F. (2018) What Makes a Greener Building? Lessons from Taiwan. Journal of Environmental Protection, 9, 957-972. https://doi.org/10.4236/jep.2018.99060
References
- 1. United Nations Economic Commissions for Europe (UNECE) (2010) Statistical Database. http://w3.unece.org/pxweb/?lang=1
- 2. United States Department of Energy Official Website. http://www.energy.gov/
- 3. Kats, G.H. (2003) Green Building Costs and Financial Benefits. Massachusetts Technology Collaborative, 1-10.
- 4. IEA (2009) Energy Technology Perspectives 2010, OECD, Chapter 6.
- 5. Burr, A.C. and Garrett-Peltier, H. (2012) Analysis of Job Creation and Energy Cost Savings from Building Energy Rating and Disclosure Policy. Institute for Market Transformation.
- 6. Burt, L., Desiderio, D., Waltner, M. and Zeidenberg, D. (2011) A New Retrofit Industry, the United States Green Building Council (USGBC).
- 7. USGBC, Green Building Facts. https://www.usgbc.org/ShowFile.aspx?DocumentID=18693
- 8. Zhang, X., Shen, L. and Wu, Y. (2011) Green Strategy for Gaining Competitive Advantage in Housing Development: A China Study. Journal of Cleaner Production, 19, 157-167. https://doi.org/10.1016/j.jclepro.2010.08.005
- 9. Khoshbakht, M., Gou, Z., Lu, Y., Xie, X. and Zhang, J. (2018) Are Green Building More Satisfactory? A Review of Global Evidence. Habitat International, 74, 57-65. https://doi.org/10.1016/j.habitatint.2018.02.005
- 10. Dwaikat, L.N. and Ali, K.N. (2016) Green Building Cost Premium: A Review of Empirical Evidence. Energy and Buildings, 110, 396-403. https://doi.org/10.1016/j.enbuild.2015.11.021
- 11. Kibert, C.J. (2007) Sustainable Construction: Green Building Design and Delivery. Wiley, Hoboken.
- 12. Matthiessen, L. and Morris, P. (2007) Cost of Green Revisited: Reexamining the Feasibility and Cost Impact of Sustainable Design in the Light of Increased Market Adoption. Davis Langdon, New York.
- 13. Hoffman, A.J. and Henn, R. (2008) Overcoming the Social and Psychological Barriers to Green Building. Organization & Environment, 21, 390-419. https://doi.org/10.1177/1086026608326129
- 14. Taiwan Architecture & Building Center (TABC) Green Building. http://www.tabc.org.tw/GB/
- 15. Fuerst, F. and McAllister, P. (2009) An Investigation of the Effect of Eco-Labeling on Office Occupancy Rates. The Journal of Sustainable Real Estate, 1, 49-64.
- 16. Eichholtz, P., Kok, N. and Quigley, J.M. (2010) Doing Well by Doing Good? Green Office Buildings. American Economic Review, 100, 2492-2509. https://doi.org/10.1257/aer.100.5.2492
- 17. Eichholtz, P., Kok, N. and Quigley, J.M. (2013) The Economics of Green Building. Reviews of Economics and Statistics, 95, 50-63. https://doi.org/10.1162/REST_a_00291
- 18. Kok, N. and Kahn, M.E. (2012) The Value of Green Labels in the California Housing Market. UCLA In-stitute of the Environment and Sustainability.
- 19. Chegut, A., Eichholtz, P. and Kok, N. (2013) Supply, Demand, and the Value of Green Buildings. Urban Studies, 51, 22-43. https://doi.org/10.1177/0042098013484526
- 20. Kok, N., Miller, N.G. and Morris, P. (2012) The Economics of Green Retrofits. Journal of Sustainable Real Estate, 4, 4-22.
- 21. Mattoni, B., Guattari, C., Evangelisti, L., Bisegna, F., Gori, P. and Asdrubali, F. (2018) Critical Review and Methodological Approach to Evaluate the Differences among International Green Building Rating Tools. Renewable and Sustainable Energy Reviews, 82, 950-960. https://doi.org/10.1016/j.rser.2017.09.105
- 22. Simcoe, T. (2012) Public Procurement and the Private Supply of Green Buildings. NBER Working Paper 18385. https://doi.org/10.3386/w18385
- 23. Marron, D. (2003) Greener Public Purchasing as an Environmental Policy Instrument. OECD Journal on Budgeting, 3, 71-105. https://doi.org/10.1787/budget-v3-art23-en
- 24. Urban Land Institute (2002), Environment and Development: Myth and Fact. Urban Land Institute, Washington DC. http://www.uli.org/ResearchAndPublications/Reports/media/Documents/
- 25. Brander, L., Olsthoorn, X., Oosterhuis, F. and Führ, V. (2003) Triggering Innovation. In: Erdmenger, C., Ed., Buying into the Environment: Experiences, Opportunities and Potential for Eco-Procurement, Greenleaf, Sheffield, 94-114. https://doi.org/10.9774/GLEAF.978-1-909493-31-5_7
- 26. Jaffee, D.M. and Wallace, N.E. (2009) Market Mechanisms for Financing Green Real Estate Investments. University of California, Berkeley.
- 27. Kuo, C.F., Lin, C.H. and Hsu, M.W. (2016) Analysis of Intelligent Green Building Policy and Developing Status in Taiwan. Energy Policy, 95, 291-303. https://doi.org/10.1016/j.enpol.2016.04.046
- 28. Chan, A.P.C., Darko, A. and Ameyaw, E.E. (2017) Strategies for Promoting Green Building Technologies Adoption in the Construction Industry—An International Study. Sustainability, 9, 969. https://doi.org/10.3390/su9060969
Appendix
Variable Definition