Journal of Environmental Protection
Vol.07 No.11(2016), Article ID:71420,25 pages
10.4236/jep.2016.711126
Assessment of the Hydrochemical Characteristics of the Suez Gulf Coastal Waters during 2011-2013
Ehssan M. Abo-El-Khair1, Laila M. Abdel Fattah1, Ahamed M. Abdel-Halim1, Mohamed A. Abd-Elnaby1, Mamdouh A. Fahmy1, Hoda H. Ahdy1, Ahamed Hemeilly1, Ahamed Abu El-Soud2, Mohamed A. Shreadah1*
1National Institute of Oceanography and Fisheries, Alexandria, Egypt
2Environmental Affairs Agency, Ministry of Environmental Affairs, Cairo, Egypt

Copyright © 2016 by authors and Scientific Research Publishing Inc.
This work is licensed under the Creative Commons Attribution International License (CC BY 4.0).
http://creativecommons.org/licenses/by/4.0/


Received: July 4, 2016; Accepted: October 18, 2016; Published: October 21, 2016
ABSTRACT
The coastal region of the Suez Gulf, is one of the most densely industrialized zones in Egypt. In order to assess the quality of Suez Gulf coastal waters for the sustainable use and development, and consequently for the national income, 12 field campaigns were carried out in 3 years (2011-2013). The results of beach litter cleared out that the shoreline of the Suez Gulf, especially Ras Gharib area was subjected to many factors which undoubtedly affected the rate of man-made litter accumulation. The most abundant visible items were general litter as they represented 30.64% of the total items encountered. Oil, seaweeds as well as old and new tar constituted 15.41%, 14.85% and 11.84%, respectively. The increase on the levels of water temperature, Chl-a, TSM, DO, BOD, DOM, COD, ammonium ion, nitrite, nitrate, total phosphorus, silicate and total nitrogen developed a eutrophic region. In general, dissolved inorganic nitrogen (DIN) species were almost 9 times higher in the northern parts compared to the southern ones revealing that the northern parts of the Gulf were more affected by human impacts compared to the southern area. Moreover, concentrations of most studied metals such as Zn, Mn, Ni, Cu, Cr, Cd, Pb, and Hg were higher in Northern parts compared to southern parts of the Gulf. The concentrations of dissolved metals in the northern and southern Suez Gulf followed the following order: Fe  Zn
Zn  Cu > Pb > Mn > Ni > Cr > Cd
  Hg. Except for Hg, concentrations of metals were in the acceptable ranges recommended internationally. Hg concentrations especially in the northern Suez Gulf were slightly higher than the permissible levels. As the northern parts of the Gulf were more suffered from oil pollution, total petroleum hydrocarbons revealed higher concentrations in the northern parts compared to the southern parts of the Gulf. Seasonal variations, on the other hand, indicated higher levels of DO, BOD, DOM and COD, chloropyll-a, TSM, ammonia, nitrate, total nitrogen in winter compared to their corresponding values in summer. In general, the majority of TN and TP in winter were in the form of organic-N (87.2%) and organic P (94.1%). These percentages were 77.8% and 37.3%, respectively in summer. The surface coastal water of the Suez Gulf was principally, P-limited for phytoplankton growth in different investigated regions. Furthermore, the DIN/DIP ratio was higher (94.2:1) in winter season compared to summer season (6.3:1). Concentrations of Fe, Zn, Cd, and Hg in winter exhibited significantly higher values compared to their corresponding values in summer. On contrast, Mn, Ni, Cu, Cr, and Pb exhibited significantly higher values in summer compared to their corresponding values in winter. Furthermore, concentrations of petroleum hydrocarbons were significantly higher in winter than in summer which is mainly attributed to the increase in the rate of evaporation for petroleum hydrocarbons in summer due to the increase in water temperature and water salinity. In general, the maximum concentration was much lower than the harmful concentrations reported for seawater. A stepwise multiple linear regression, analysis of variance (ANOVA), and principle component analysis (PCA) were applied.
Keywords:
Hydrography, Nutrient Salts, Heavy Metals, Petroleum Hydrocarbons, Coastal Water, Suez Gulf

1. Introduction
Contamination of the Egyptian marine environment in the Red Sea is one of the environmental crises that accompany with the rapid economic development and has become a subject of great deal of research in recent years [1] - [14] . The coastal region of the Suez Gulf, is one of the most densely industrialized zones in Egypt. The sustainable use of coastal and ocean resources is linked to public health, food security, and economic and social benefits, including cultural values and traditional livelihoods. More broadly, these elements are understood as decisive elements for the alleviation of poverty. Therefore it has been considered as the area the most at risk of pollution in the Red Sea, particularly oil pollution since the most important economic activities in the region revolve around the petroleum, petrochemical and fertilizer industries. The northern area is receiving a heavy load wastewater from industrial and sewage effluents that generate impacts that cumulatively affect the health of these critical marine ecosystems and ultimately their economic development [15] [16] . Most of these pollution problems which lie mainly in the coastal zone are changing the configuration of the coastline [17] [18] [19] . It is now well accepted that the local impacts of these land- based sources are in synergy with the negative impacts of coastal tourism, ship-based sources including discharges of oily ballast water, tank washings by vessels, operational and accidental spills, leaks from vessels in addition to other forms of ship-generated wastes, i.e. oily sludge, bilge water, garbage and marine debris [20] - [29] , as well as the improper resource management in conjunction with a lack of law enforcement, land use practice taking advantage of the site location. The magnifying effect of all these types of stressors is considered a hindrance to sustainable development of the marine resources in the Gulf of Suez. There is compelling evidence that these pollutants and related synergistic effects, despite the significant progress made over the last decade through investments to control pollution from these sources, can cause disease and mortality in sensitive species, disrupt critical ecological functions, cause trophic structure and dynamics changes (i.e. eutrophic conditions), and impede growth, reproduction, and larval settlement [30] [31] [32] .
The importance of identifying the extent of and reducing these effects with the accelerated public interest in preservation of the environment, and restoration of those areas has now become crucial. There has been increased activity in biological and ecological research on the effects of pollution on the marine environment, particularly in coastal waters [18] - [21] [31] - [34] . The interest in preservation of the coastal environment has been reflected in various national and international workshops and conferences that have taken place [5] [6] [17] [19] [25] [35] - [40] .
It is now well accepted that the solution of these marine pollution problems is only achieved through legislative actions combined with strong backing by scientific research and monitoring programs and due to the importance of the area for tourism, fisheries, oil and other industries and the consequence importance for national income, and in order to assess pollutants and impacts of environmental changes in the coastal region of the Suez Gulf, an environmental information and monitoring program (EIMP) was established since 1998. The main objective of this paper is to assess the quality of Suez Gulf coastal waters for the sustainable use and development, and consequently for the national income.
2. Material and Methods
2.1. Study Area
The Gulf of Suez is a relatively young rift basin, dating back 40 million years. It stretches some 280 km to north, terminating at the City of Suez which is the entrance to the Suez Canal (Figure 1). It is relatively shallow, with a maximum depth of about 64 m; outside its mouth the depth drops sharply to about 1255 m. It has a relatively flat bottom with a depth ranging between 55 and 73 m. Hence, the Gulf spreads a shallow basin filled with the surface water of the Red Sea. The climate is arid, with a yearly average net evaporation of 10 mm/day. Winds blow mainly from the north-northwest direction throughout the year. Rainfall in the region is extremely sparse and localized.
The sources and causes of water pollution in Suez Gulf Region can be categorized into: sewage, persistent organic solids, radioactive material, heavy metals, oils (hydrocarbons), nutrients, sediment mobilization, and litter. The mid-western side is locating under the direct effect of sewage wastes and petrochemical effluents of Ras Gharib city. Whereas, the human impact on the eastern (Sinai Peninsula) and southern (El Tour city) sides are still insignificant due to the low population there. For this reason great and rapid development were taken place on these two sides as natural recreational areas
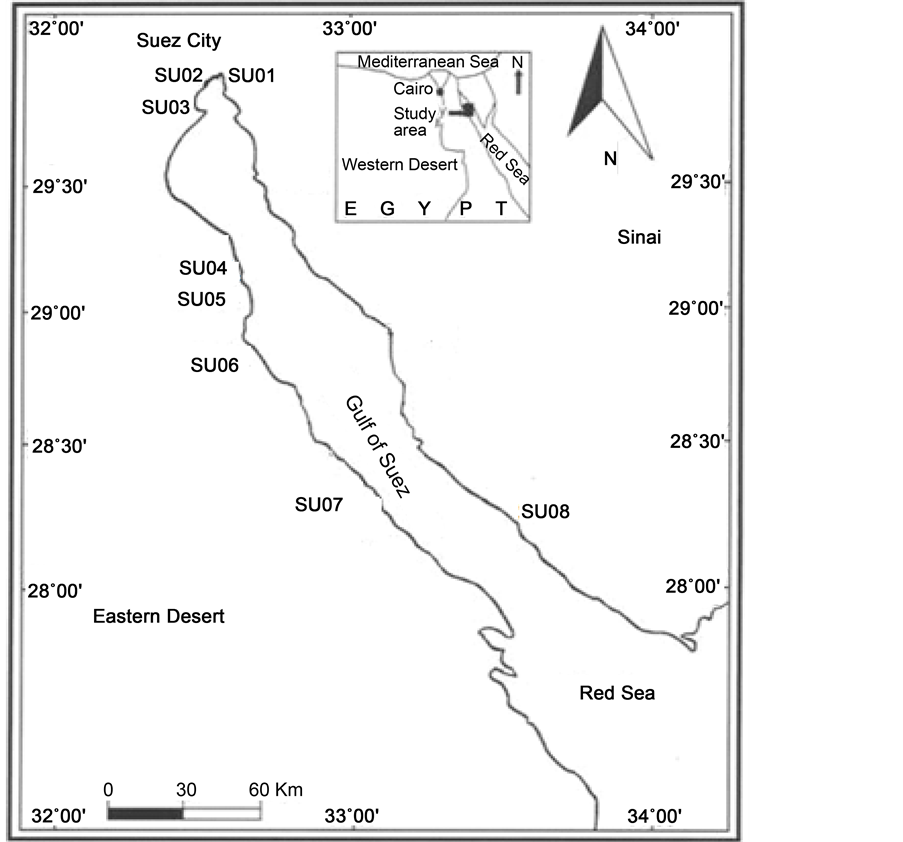
Figure 1. Locations of different samples collected from the study area.
for tourist trades and consequently national income.
2.2. Sampling
Within the framework of EIMP, 12 field campaigns were carried out in 3 years (2011- 2013). A total of 108 coastal water samples were seasonally collected, in duplicate, during March, May, August and October of 2011-2013. Eight coastal sampling stations were selected to represent the different locations situated under the direct effect of human activities, public resort beaches, some protected and reference sites (Figure 1). The latitude and longitude of each station is given in Table 1. Duplicate water samples from each stations were collected at 50 cm depth below the water surface to avoid the floating materials using a high quality and Purified PVC Niskin’s bottle to estimate hydrochemical parameters, i.e., water temperature, salinity, pH, dissolved oxygen etc., eutrophication parameter, i.e., chlorophyll-a, nutrient salts, heavy metals, i.e., Zn, Mn, Ni,

Table 1. Locations of different samples collected from the study area.
Cu, Cd, Co, Pb, etc., and total petroleum hydrocarbons.
2.3. Methods
2.3.1. Hydrographic Parameters
The hydrographic parameters (water temperature, salinity, pH, Transparency, dissolved oxygen (DO) were measured in situ at each station using CTD (YSI-6000) Transparency was measured by Secchi Disk. Dissolved oxygen was also measured using modified Winkler method [41] . Biological oxygen demand (BOD) samples were kept in incubator and fixed after 5 days and their DO contents were determined. Dissolved organic matter (DOM) was carried out using potassium permanganate according to the method described by [42] , and chemical oxygen demand (COD) was determined by the dichromate closed reflux titrimetric method [41] .
2.3.2. Chlorophyll-a, TSM, Transparency, and Nutrient Salts
Chlorophyll-a (Chl-a) was measured in 3L water samples after collection and filtration by using 0.45 µm filters. Chl-a was extracted using 90% acetone and measured spectrophotometerically according to [43] . Ammonium ion concentrations were determined according to [44] . Nitrite, Nitrate, reactive phosphate and reactive silicate concentrations were determined on pre-filtered seawater samples (Whatman GF/C) following the sepectrophotometric techniques described by [43] [44] by using HACH DR-2000 direct reading spectrophotometer. Total P and total N were estimated in unfiltered water samples following the procedure described by [45] . Total suspended matter (TSM) was collected from 3 L seawater samples by filtration through washed, dried and pre- weighed 0.45 µm membrane filter. The filters with the retained particles were washed then air dried in the oven at 60˚C for 24 - 48 hours until constant weight. The difference between the dry weight of membrane filters before and after filtration was expressed in mg/l [43] . Transparency was measured by Secchi Disk. Transparency was measured by Secchi Disk. The concentration of dissolved inorganic nitrogen (DIN as the sum of NH4-N + NO2-N + NO3-N) was calculated.
2.3.3. Heavy Metals
Dissolved heavy metals, i.e. Fe, Mn, Cu, Zn, Cd, etc. were determined after pre-con- centration from seawater by using chelex-100 cation-exchange resins according to [46] [47] . Measurements were done by using the atomic absorption spectrophotometer (AAS)/flame mode (Shimadzu AA-6800).
2.3.4. Petroleum Hydrocarbons
Petroleum hydrocarbons were extracted from seawater samples by using dichloromethane. Sample extracts were concentrated by rotary evaporation to 5 ml. Finally, samples were concentrated under a gentle stream of pure nitrogen to a final volume of 1 ml, then measured using UV-spectrophotometer at 410 nm emission after excitation at 360 nm and chrysene as standard [48] .
2.4. Quality Control
Calibration curves for each variable of nutrient salts and heavy metals were constructed of a blank and four or more standards (Merck Germany). Accuracy and precision were confirmed using synthetic samples and/or reference materials of different nutrient salts and metals and measured every five samples as quality control tools.
2.5. Statistical Analysis
A stepwise multiple linear regression to give insight about the relationships between the independent variables and the dependent variables were calculated (n = 106, p ≤ 0.05) to test the relationship between variables. The correlation coefficient is significant at r ≥ 0.195. Analysis of variance (ANOVA) was applied to test significant differences in the measured variables and correlation matrices were constructed from the resulting coefficients with the aid of STATISTICA 10 program. Cluster analysis was applied to organize the observed data into meaningful structures and general categories with the aid of STATISTICA 10 program. Moreover, principle component analysis (PCA) and factor analysis as Varimax normalization rotated were applied with SPSS program version 15.0 for Windows. The number of factors was determined by the total variance explained, i.e. communality, usually more than 85% was necessary.
3. Results and Discussions
3.1. Visual Observations
Beach litter of lumps of new and old tar, oil, feces, sewage disposal, general and harmful liters as well as seaweeds of coastal beach zones especially those used for recreational purposes including pollution index and the magnitudes of pollution for respective items [15] are assessed by eyes according to: none, light, moderate and heavy, allocating respective scores ranging from “0” to “3” (Table 2).
The results of Table 3 of respective years and annual average monitoring for the density, composition, and distributions at different stations cleared out that the shoreline of the Suez Gulf, especially, Ras Gharib (SU06) area was subjected to many factors
Table 2. The total scores of seven items stand for the pollution index.
Table 3. Magnitudes of pollution of respective years and annual average monitoring stations.
which undoubtedly affected the rate of man-made litter accumulation including heavy shipping traffic, intensive commercial fishing, settlement and fast growing communities, etc. [20] [22] [23] [28] [49] [50] . Despite of that the northern parts of the Gulf were still more affected (0.84) by human impacts compared to the southern area (0.73). In fact, the beach tar has been found to be a good estimator of levels of oil contamination and an effective means of evaluating the potential threat of oil on coastal resources [26] - [29] . Stations with a higher pollution index are largely consistent with the areas of oil or natural gas field. In general, the most abundant visible items were general litter as they represented 30.64% of the total items encountered. Oil, seaweeds as well as old and new tar constituted 15.41%, 14.85% and 11.84%, respectively. On contrast, sewage, faces, and harmful litter represented 9.77%, 8.08%, and 3.70%, respectively. Besides affecting the fishing industry and scuba diving tourism, beach litter cause a destruction of living resources and reduces the recreational utility of coastal waters, especially the beaches through shore damage [20] [22] [23] [28] [29] .
3.2. Hydrography
The results of water temperature, salinity dissolved oxygen and pH (Table 4), measured at each station by using the CTD (YSI-6000) revealed that the maximum water temperature was 32.21˚C in August, 2012 at Mena Sukhna (Su04); while the minimum
Table 4. The average and mean values of different hydrochemical characteristics of Suez Gulf coastal waters during 2011-2013.
temperature was 17.56˚C in March, 2011 at Ras Gharieb (Su06). Water temperatures showed slightly higher values in the northern parts (25.18˚C) than southern parts (24.18˚C) of the Gulf (Figure 2(A)). Seasonal variations revealed higher temperatures in summer (27.61˚C) compared to their corresponding values (20.38˚C) (Figure 2(B)) suggesting more pronounced variability. In general, variations in water temperature was normal and changed according to many variables such as season, day time, depth, tide, wind, current, water inflow and turbidity [6] [8] [51] [52] . Pronounced variations in the water salinity of Suez Gulf was noticed (Table 4). Regionally, the salinity, in general, showed noticeable local variations according to the distance of the different sites from the effluents [17] [19] [53] - [55] . Based on the distribution of surface salinity in the investigated area, the maximum regional value (42.23 ppt) was observed at Suez North (Su01), while the minimum one (37.65 ppt) was measured at Suez Middle (Su 02). No significant increase in the water salinity of the gulf area from the entrance of the Gulf in the south (40.36 ppt) towards the North (41.51 ppt) revealing a water mass with salinity > 40 ppt and occupying the whole Gulf area (Figure 2(A)). Moreover, seasonal variations showed no differences between winter (41.04 ppt) and summer values (41.34 ppt) of salinity (Figure 2(B)). The distribution of pH values at the surface water in summer showed values ranging from 7.60 to 8.22. In winter, pH values were more or less comparable to that measured in summer with a variation range of 8.09 to 8.24,
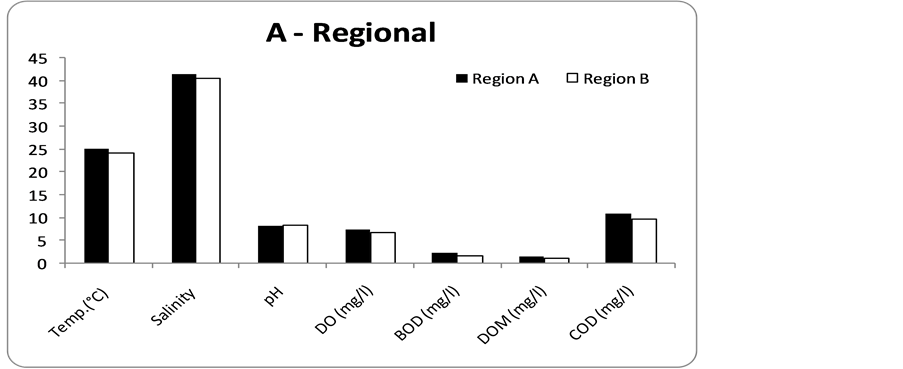
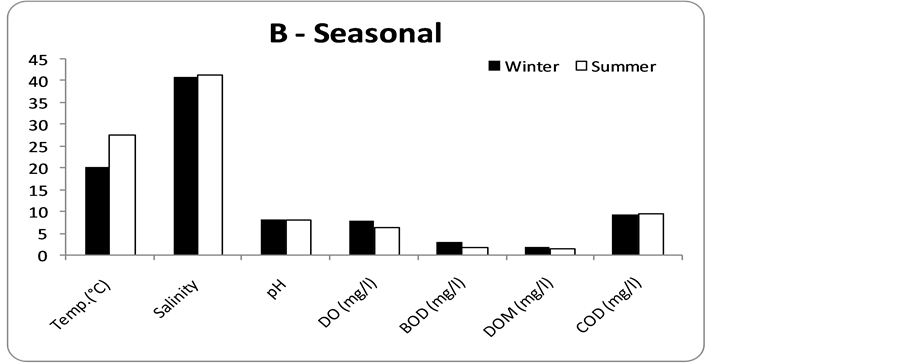
Figure 2. Average values of different hydrogrophic parameters in the Suez Gulf. (A) Regional; (B) Seasonal.
reflecting less variation. The observed higher pH values at surface water in summer (8.14) and winter (8.17) seasons could be attributed to the photosynthetic activity and long light span [3] [4] [52] . No obvious variations in the pH values were observed between the southern (8.17) and northern (8.17) parts of the Suez Gulf which is mainly associated with water temperature, dissolved oxygen, organic matter, chlorophyll-a, etc. [7] [17] [51] [53] [54] . It seems that the relative high pH-value, especially at Suez middle (Su02) which is affected by waste waters could be attributed to the phytoplankton bloom and was accompanied by an increase in dissolved oxygen [7] [17] [52] . Dissolved oxygen concentration in the surface water of the Suez Gulf showed concentrations ranging from 4.56 to 7.58 mg/l with an average value of 6.36 mg/l in summer. However, oxygen distribution in winter showed significantly higher values (5.64 to 10.82 mg/l) with an average value of 8.13 mg/l than that of summer which may probably attributed to lower temperatures [16] - [18] [34] . Horizontal distribution of dissolved oxygen concentrations showed higher concentrations in Northern parts (7.44 mg/l) compared to southern parts (6.83 mg/l) of the Gulf (Figure 2(A)) probably due to the higher photosynthetic activity [51] [52] [54] [56] , and consequently indicated a well oxygenated condition (7.14 mg/l) in the whole investigated area. The saturation values are in the range of 72.85% to 171.0% of oxygen depending on temperature and salinity values (Table 4) revealing that the Gulf is nearly super-saturated by oxygen with some tendency towards a slight decrease in oxygen contents with increasing depth. The results of BOD, DOM and COD (mg/l) showed remarkable regional variations (0.64 - 4.72), (0.64 - 3.60), and (9.16 - 12.75) with more or less similar patterns of distribution (Table 4) and revealing higher concentrations depending on the amounts of biodegradable organic matter and impacts of land based sources and/or human activities [16] - [18] [51] [53] [54] [56] . Figure 2(A) cleared out that BOD, DOM and COD levels were higher in Northern parts (2.35, 1.56, and 10.97 mg/l, respectively) compared to southern parts (1.68, 1.14, and 9.71 mg/l, respectively) of the Gulf. Seasonal variations showed concentrations ranging from 0.32 to 4.72, with an average value of 1.75 mg/l, from 0.32 t0 3.2, with an average value of 1.29 mg/l, and from 8.21 to16.82 mg/l with an average value of 9.42 mg/l, respectively in summer (Figure 2(B)). However, BOD, DOM, and COD distribution in winter showed significantly higher values (1.52 - 6.48) with an average value of 3.27 mg/l, (0.64 - 3.84) with an average value of 2.04 mg/l, and (4.54 - 12.27) with an average value of 9.52 mg/l, respectively than that of summer. DOM and COD seasonal variations in coastal surface waters of Suez Gulf were mimic to their corresponding of BOD (Figure 2(B)). According to the Environmental Egyptian law (92/2013), the permissible COD discharge limits (100 mg/l) are much higher than the measured concentrations.
3.3. Chlorophyll-a, TSM, Transparency, and Nutrient Salts
3.3.1. Chlorophyll-a and TSM, Transparency
In general, the results of Chl-a and TSM in the Suez Gulf showed remarkable regional variations (Table 5). The levels of Chl-a were fluctuated between 0.11 μg/l in March (2011 & 2012) at Su07 and 9.85 μg/l in August 2012 at Su02. On the other hand, the levels of TSM varied between 0.97 mg/l in March 2011at Su09 and 105.61mg/l in August 2012 at Su02, with more or less similar patterns of distribution. On the meantime, seechi disk fluctuated between 2.0 in March, 2011 at Su01 and 12.0 m in July, 2011 at Su04 (Table 5). Figure 3(A) cleared out that Chl-a and TSM levels were higher in the Northern parts (2.22 μg/l, and 38.69 mg/l, respectively) compared to southern parts (0.67 μg/l and 22.92 mg/l, respectively) of the Gulf. On contrast, seechi disk measurement were higher in the southern parts (6.6 m) compared to the northern parts (4.39 m). In general, secchi disk transparency reached bottom depth at most stations. Seasonal variations (Figure 3(B)) showed concentrations of chlorophyll-a ranging from 0.12 to 9.85 μg/l with an average value of 1.96 μg/l and from 6.99 to 105.61, with an average value of 33.86 mg/l, respectively in summer. However Chl-a and TSM distribution in winter showed significantly lower values (0.11 - 5.32) with an average value of 1.50 μg/l, and (2.81 - 42.75) with an average value of 21.20 mg/l than that of summer. The pronounced increase in water temperatures that results in an increase in the rate of phytoplankton growth in addition to the discharge of wastewater are the main factors responsible for such increase in both chlorophyll-a and TSM in summer. In general, the
Table 5. Ranges and average values of chlorophyll-a (μg/l), total suspended maters (mg/l) nutrient salts (μg/l) of coastal surface waters of Suez Gulf during 2011-2013.
high values of chlorophyll-a in the investigated area are due to the rich supply of DIN, reactive silicate and reactive phosphate, these nutrient salts contribute for the growth of phytoplankton expressed in high levels of Chl-a [4] [6] [7] [55] . On contrast, secchi disk patterns of distributions revealed higher values (5.02 m) in summer compared to its values (4.85 m) in winter season (Figure 3(B)). Despite TSM values were lower than the maximum permissible limit of law 4\94 that TSM 25 mg\l, yet it was at the borders in August 2012 at Su02 which is most probably attributed to the discharge of huge amounts of wastewaters from El-Kabanon drain (approximately 120,000 m3/day), from the city of Ras Gharib, Raks beach and Attaka port. The outflow of wastewater is not free from the suspended matters [3] [6] [53] [54] .
3.3.2. Nutrient Salts
The concentration of nitrogen and phosphorus are known to play a key role in determining the ecological status of aquatic systems [57] . These nutrients in excess may leads to diverse problems such as an increase in the occurrence and extent of algal

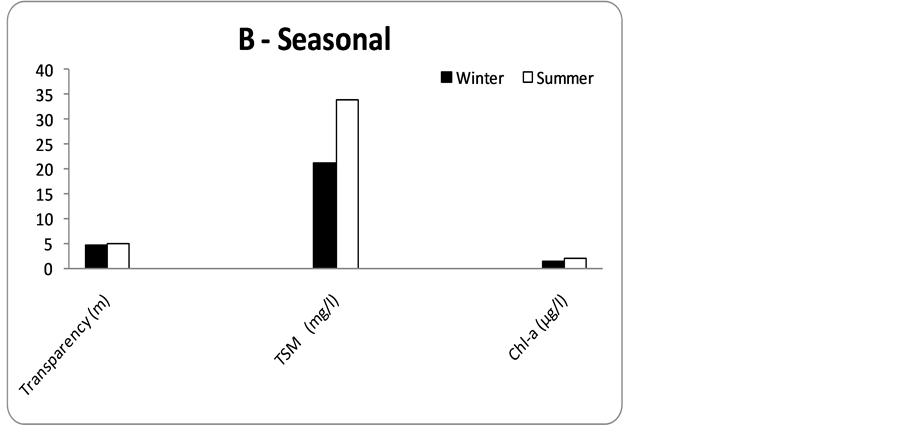
Figure 3. Average values of transparency, TSM, and Chl-a in the Suez Gulf. (A) Regional; (B) Seasonal.
blooms, loss of oxygen, taste and odour problems, fish deaths and loss of biodiversity. Nutrient enrichment seriously degrades aquatic ecosystems, impairing the use of water for drinking, industry, agriculture, recreation and other purposes [58] . On contrast to most of the Red Sea water which is considered oligotrophic, the coastal waters of the Suez Gulf especially the northern parts are nutrient-rich [3] [4] [6] - [8] . The results of the present study (Table 5) indicated that dissolved inorganic nitrogen concentrations were quite high especially in the northern parts of the Gulf. Figure 4(A) cleared out that dissolved inorganic nitrogen (DIN), i.e. ammonium ion (158.34 μg/l), nitrite (28.44 μg/l), nitrate (212.61 μg/l), total nitrogen (1360.3 μg/l) levels were higher in Northern parts compared to southern parts (68.69, 4.89, 23.94 and 1124.4 μg/l, respectively) of the Gulf developing an eutrophic region in the northern Suez Gulf. Generally, the concentrations of DIN were found to be highest in the area surrounding Suez City due to
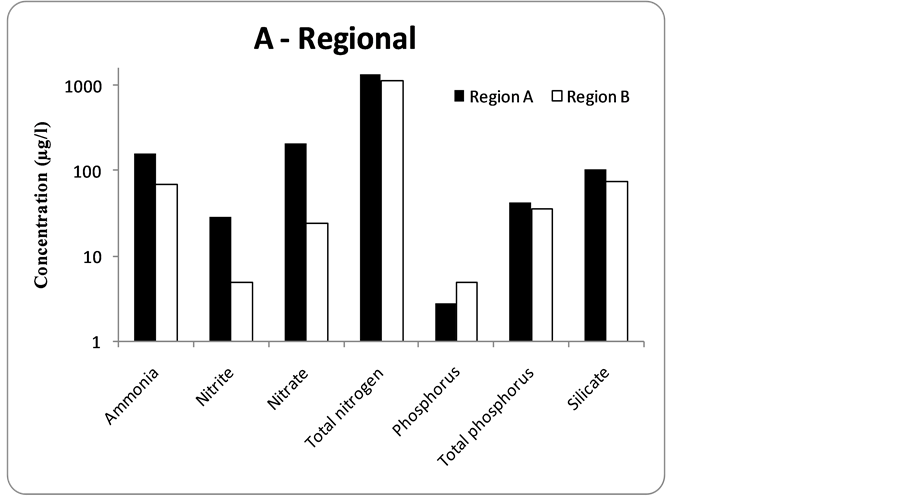
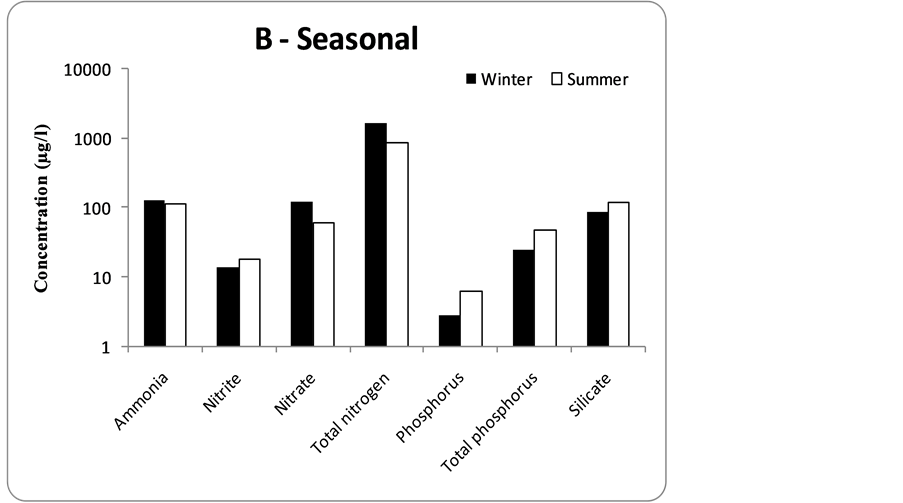
Figure 4. Average values of different nutrient salts in the Suez Gulf. (A) Regional; (B) Seasonal.
the discharge of untreated sewage and industrial wastewater as well as the wastes resulting from ships waiting to cross the Suez Canal and are considered as an indicator of high anthropogenic inputs and bacterial activity [3] [4] [6] [7] [10] - [12] [20] - [23] . Dissolved inorganic nitrogen constituted 29.4% and 8.7% of the TN in the waters of both northern and southern parts of the Gulf, respectively (Figure 4(A)). This finding revealed that the majority of TN content in both areas of the Gulf were in the form of organic-N which constituted more than 80% of TN. Based on the mean annual values, the concentrations of dissolved inorganic nitrogen forms in the northern Suez Gulf followed the following order: NO3 > NH4 > NO2, while in the southern parts it was: NH4 > NO3 > NO2. In general, dissolved inorganic nitrogen (DIN) species were almost 9 times higher in the northern parts compared to the southern ones. Ammonia, nitrite and nitrate represented 39.6%, 7.1%, and 53.2%, respectively of DIN, whereas these percentages were 70.4%, 5.0%, and 24.6%, respectively in the southern parts of the Gulf. The high value of nutrients in the Gulf was mainly attributed to the fertilizer waste from El-Nasr fertilizer factory and sewage waste disposal from El-Kabanon drain [3] [6] [7] [10] [11] . However, the higher percentages of ammonia in the southern parts are due to the relatively lower concentrations of DO and the direct discharge of industrial, agricultural and domestic sewage through El-Kabanon drain which is considered the main industrial and sanitary drain. On the meantime, total phosphorus (43.18 μg/l) and silicate (106.4 μg/l) showed also higher concentrations in the northern parts of the Gulf compared to the southern parts (35.84 and 76.65 μg/l, respectively) as shown in as shown in Figure 4(a). The quite high total phosphorus and silicate contents in the northern parts compared to southern parts were attributed to allochthonous huge amounts of domestic and drainage effluents enriched with phosphate and other fertilizers discharge into this area through El-Kabanon drain which is considered the main industrial and sanitary drain [3] [6] [7] [10] [11] . On contrast, inorganic phosphorus (2.79 μg/l) levels were lower in northern parts compared to the southern parts (5.00 μg/l) of the Gulf. According to Skrivanic and Strin [59] well as Franco and. Fatorri [60] especially in the northern parts as eutrophic waters. They indicated that seawater displaying concentrations of 7.0 μg/l for each NH4 and NO3 is classified as oligotrophic. Whereas, in eutrophic waters the concentration of these nutrients are usually in order of 28.0 μg/l for NH4 and 56.0 μg/l for NO3. Seasonal variations showed concentrations of ammonia ranging from 4.05 to 614.67, with an average value of 130.93 μg/l, nitrate ranging from 5.75 to 481.70, with an average value of 126.46 μg/l, total nitrogen ranging from 181.03 to 16700, with an average value of 1701.1 μg/l which were significantly higher in winter compared to their corresponding values (ammonia: 3.94 - 696.99, av. 113.30 μg/l, nitrate: 1.52 - 166.15, av. 60.61 μg/l, total nitrogen: 134.4 - 2310, av. 861.75 μg/l) in summer (Figure 4(b)). On contrast, seasonal distributions of nitrite (0.99 - 55.36, 13.89 μg/l), phosphate (0.46 - 9.57, 2.88 μg/l), and silicate (16.47 - 693.90, 90.04 μg/l) exhibited significantly lower values in winter compared to their corresponding values (nitrite: 0.35 - 98.18, 17.79 μg/l, phosphate: 1.17 - 36.91, 30.34 μg/l, and silicate: 15.03 - 283.97, 119 μg/l) in summer (Figure 4(b)). Total phosphorus exhibited lower concentrations in winter (0.60 - 43.16, av. 25.14) compared to their corresponding value in summer (17.30 - 96.10, av. 48.42). In general, the majority of TN and TP in winter were in the form of organic-N (87.2%) and organic P (94.1%). These percentages were 77.8% and 37.3%, respectively in summer. The lower concentrations of silicate during winter compared to summer were owing to its consumption by diatoms and radiolarian. Dissolved inorganic nitrogen (DIN) and PO4-P are the main forms of N and P that are bioavailable for the growth of phytoplankton. Smith [61] found that phytoplankton yield depends mainly on N/P ratio; ratio > 15 - 17 was indicating that phosphorus was the critical controlling factor, from <9 - 10: 1 indicates that the yield varied with nitrogen and >21 shows that phosphorus was the primary controlling factor. The DIN/DIP ratio was higher in Northern parts (143.2:1) compared to southern parts (19.5:1). The higher ratios than that reported by Redfield’s ratio with value of (16:1) revealed high nitrogen concentrations in comparison with that of phosphorous. The surface coastal water of the Suez Gulf are principally, P-limited for phytoplankton growth in different investigated regions (Table 5). The high N/P ratio could be related to the high anthropogenic inputs [3] [4] [6] [7] [17] [10] - [12] . Furthermore, the DIN/DIP ratio are higher (94.2:1) in winter season compared to summer season (6.3:1).
3.4. Heavy Metals
The ranges and mean concentrations of the studied heavy metals, namely, Fe, Zn, Mn, Ni, Cu, Cr, Cd, Pb, and Hg are given in Table 6. The results of the present study (Table 6) indicated that concentrations of most studied metals were quite high especially in the
Table 6. Ranges and regional average values of heavy metals and petroleum hydrocarbons (μg/l) in the Suez Gulf Coastal waters during 2011-2013.
northern parts of the Gulf. Figure 5(A) cleared out that dissolved metals, i.e. Zn (17.48 μg/l), Mn (2.04 μg/l), Ni (1.66 μg/l), Cu (6.78 μg/l), Cr (1.32 μg/l), Cd (0.88 μg/l), Pb (4.50 μg/l), and Hg (0.112 μg/l) concentrations were higher in Northern parts compared to southern parts (15.60, 1.86, 1.34, 4.38, 1.18, 0.44, 4.07, and 0.050 μg/l, respectively) of the Gulf. Fe exhibited more or less comparable concentrations (39.40 μg/l) in the northern and southern parts (40.78 μg/l) of the Gulf. Generally, concentrations of most dissolved metals exhibited the highest concentrations in the area surrounding Suez City where the bay is subjected to industrial run-off from oil refineries, fertilizer plants, and power station in addition to sewage and garbage [21] [24] [62] [63] . Based on the mean annual values, the concentrations of dissolved metals in the northern and southern Suez Gulf followed the following order: Fe (39.40 ± 4.78 μg/l)  Zn (16.46 ± 14.75 μg/l)
  Cu (6.93 ± 4.34 μg/l) > Pb (4.66 ± 4.16 μg/l) > Mn (2.30 ± 2.53 μg/l) >
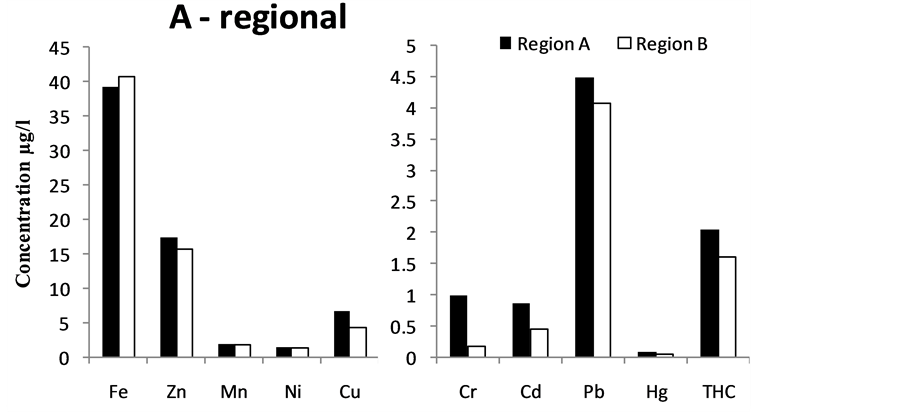
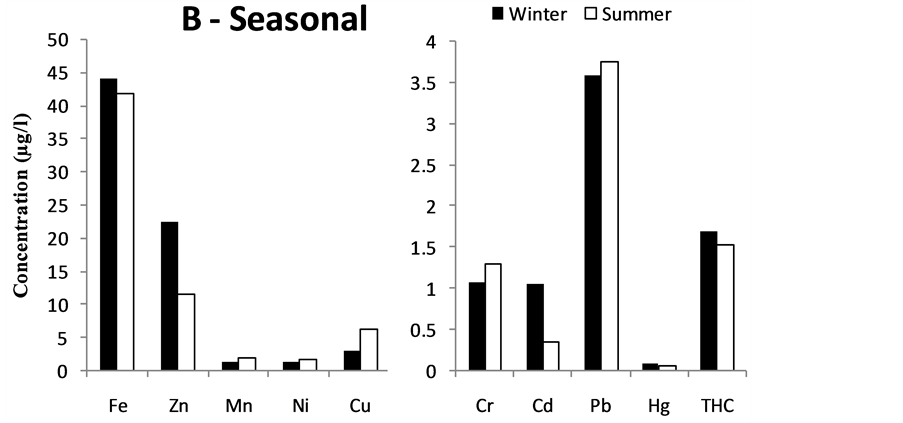
Figure 5. Average values of heavy metals and total petroleum hydrocarbons in the Suez Gulf. (A) Regional; (B) Seasonal.
Ni (1.66 ± 1.31 μg/l) > Cr (1.38 ± 1.21 μg/l) > Cd (0.67 ± 0.40 μg/l)  Hg (0.12 ± 0.046 μg/l). In general, Hg, Cd, Cu, Ni, Zn, Cr, Mn, and Pb concentrations were almost 2.24, 2.00, 1.60, 1.24, 1.12, 1.12, 1.10, 1.10 times, respectively higher in the northern parts compared to the southern ones (Figure 5(A)). Fe concentrations, on the other hand, were 1.04 times higher in the southern parts compared to the northern ones. The high values of most metals in the northern parts are mainly due to allochthonous huge amounts of domestic and drainage effluents from El-Kabanon drain in addition to the fertilizer waste from El-Nasr fertilizer factory [3] [6] [7] . However, the relatively higher concentrations of Fe in the southern parts are due to the more oxic conditions in the southern area of the Gulf. Seasonal variations showed concentrations of Fe ranging from 21.779 to 64.115, with an average value of 44.1 μg/l, Zn ranging from 10.783 to 49.406, with an average value of 22.46 μg/l, Cd ranging from 0.467 to 4.816, with an average value of 1.06 μg/l, and Hg ranging from 0.006 to 0.489, with an average value of 0.095 μg/l, which were significantly higher in winter compared to their corresponding values (19.79 - 75.56, 41.82 μg/l), (3.992 - 21.569, 11.60 μg/l), (0.146 - 0.75, 0.34 μg/l), and (0.028 - 0.1772, 0.064 μg/l), respectively in summer (Figure 5(B)). On contrast, seasonal distributions of Mn (0.256 - 17.25, 1.92 μg/l), Ni (1.013 - 2.204, 1.58 μg/l), Cu (1.72 - 23.587, 6.32 μg/l), Cr (0.326 - 3.900, 1.29 μg/l), and Pb (2.823 - 9.99, 3.74 μg/l) exhibited significantly higher values in summer compared to their corresponding values (0.047 - 4.36, 1.45 μg/l), (0.894 - 1.825, 1.34 μg/l), (1.684 - 5.07, 3.16 μg/l), 0.64 - 1.341, 1.08 μg/l), (2.613 - 4.002, 3.60 μg/l), respectively in winter (Figure 5(B)). Except for SU 01 & Su 02, the present study revealed that all water samples exhibited dissolved heavy metals concentrations in the international acceptable ranges [64] . Stations (SU 01 & SU 02) attained Hg concentrations slightly higher than the permissible levels.
3.5. Petroleum Hydrocarbons
Total petroleum hydrocarbons in Suez Gulf ranged from 0.56 and 2.38 µg/l with an average of 1.35 µg/l (Table 6). The maximum concentration in all studied locations was measured for Suez north (SU01) and the minimum one was observed at Suez south (SU03). The coastal waters at the northern parts are more suffered from oil pollution (2.06 µg/l) compared to the southern parts (1.60 µg/l) of the Gulf (Figure 5(A)). The higher concentrations are mainly attributed to accidental, deliberate or operational discharges and spills of oil from ships, especially tankers. Offshore platforms and pipelines are additional reasons for the increase of total petroleum hydrocarbons in the northern Suez Gulf. Stations of SU02 and SU06 in the Gulf of Suez (2.88 & 2.47 µg/l, respectively) were found to suffer from extensive chronic petroleum pollution inputs compared to other areas of the Gulf. The impacts of oil pollution land-based sources and/or offshore sources are the main reasons for such increase [20] [22] [23] [26] [27] . Furthermore, seasonal variations showed concentrations of petroleum hydrocarbons ranging from 0.18 to 9.0 µg/l, with an average value of 1.70 µg/l which were significantly higher in winter compared to their corresponding values (0.56 - 3.57, av. 1.52 µg/l) in summer (Figure 5(B)). The lower concentrations of petroleum hydrocarbons in summer are mainly attributed to the increase in the rate of evaporation for petroleum hydrocarbons in summer season due to the increase in water temperature and water salinity [20] [22] [23] [26] [27] . In general, the maximum concentration was much lower than the harmful concentrations reported for seawater. On the other hand, the reported concentrations are very far below the accepted level given by EEAA of Egypt and that recorded by the International level of 500 µg/l.
3.6. Statistical Analysis
3.6.1. Correlation Analysis
Pearson correlation matrix was studied on the present data for all investigated environmental parameters (26 parameters) during the study period (n = 96, p ≤ 0.05). The correlation analysis (Table 7) confirmed the significant interrelation among studied parameters. It was showed that, water temperature represents a positive significant correlation with each of TSM (0.32), salinity (0.24), some heavy metals such as Cu, Cr Ni and Pb (0.32, 0.23, 0.20 and 0.48, respectively) and a negative significant correlation with each of DO (−0.52), BOD (−0.43) OM, (−0.27) and Zn (−0.46). The correlations among the nutrients illustrated that there was a positive significant correlation between TN and each of  (0.52),
  (0.57) and TSM (0.43). Also, a positive significant correlation between
  and each of
  (0.52),
  (0.51),
  (0.44) and TP (0.57) as well as, between
  and TP (0.57) were calculated. The positive correlations among the nutrients may mean that, there are all have the same source. It was observed that, there are strong relationships among the metals in the coastal water of Suez Gulf during the present study. There is a positive significant correlation between Mn and each of Fe (0.30) and Pb (0.21), and a positive significant correlation between Pb and each of Zn (0.21), Cr (0.43), Cu (0.38) and Hg (0.20). Ni was positive correlated with each of Cu (0.43) and Hg (0.20). PHC was showed a negative significant correlation with Fe (−0.23) and a positive significant correlation with each of TSM (0.30),
  (0.31). Metals give a positive significant correlation with each of nitrogen and phosphorus forms, TP was positive correlated with Cd (0.32), TN was positive correlated with each of Ni (0.3), Pb (0.22) and Hg(0.22).
  was positive correlated with Hg (0.27). A positive significant correlation between
  and each of Ni (0.33) and Hg (0.24) was deduced. Similarly, a positive significant correlation between
  and each of Ni (0.21) and Hg (0.33) was deduced. The relationships between PHC and metals were weak.
3.6.2. Principal Component Analysis (PCA)
PCA is an application for assessment of water pollution. PCA is a multivariate statistical technique employed to reduce the dimensionality of dataset while attempting to preserve the relationships present in the original data. The Eigen values were computed for the standardized data using specialized statistical software package (SPSS version 16). PCA is applied for multivariate data derived from the water analysis of 96 coastal water samples of Suez Gulf using 26 variables: water temperature, salinity, pH, DO, BOD, OM, COD, Chl-a, TSM,  ,
,  ,
,  , TN,
, TN,  , TP, SiO4, Fe, Mn, Ni, Zn,
Table 7. Pearson correlation matrix on the present data for all investigated environmental parameters (26 parameters) during the study period (n = 96, p ≤ 0.05).
n = 96. P < 0.05 r significant at 0.1998.
Cd, Cr, Pb, Cu, Hg and PHC. The output data revealed that ten factors (PC1-PC8) affected parameters distributions, association and sources, with cumulative covariance of 72.02%. Varimax rotation components matrix is given in Table 8 to give an overview on the nature of loading among the parameters.
PC1 represented positive high loading for Chll-a 0.46, TSM 0.61,  0.58,
0.58,  0.81,
0.81,  0.87, TN 0.82 and Hg 0.41. PC2 represented positive loading for DO 0.86,
Table 8. Varimax rotated component matrix.
BOD 0.68, Zn 0.68 and Cd 0.69 and negative loading for water temperature −0.80. PC3 represented high positive loading for BOD 0.47, DOM 0.45, COD 0.78,  0.60,
0.60,  0.78, and TP 0.77. PC4 represented high negative loading for pH −0.81and high positive loading for Cr 0.79 and Pb 0.75. PC5 represented high positive loading for salinity 0.77, Chll-a 0.56, TSM 0.43 and Ni 0.56. PC6 represented loading for Fe 0.82 and Mn 0.66. PC7 represented positive loading for Cu 0.65, Cd 0.38 and negative loading for THC-0.64. PC8 represented positive loading for DOM 0.46, SiO4 0.72 and Hg 0.46.
Statistical analysis of the results for different investigated parameters revealed that there are several commutative and correlative relations between several physicochemical parameters, nutrient salts, heavy metals and petroleum hydrocarbons.
4. Conclusions and Recommendations
Based on the results of the present study, one can safely conclude and recommend that:
1) The results of respective years and annual average monitoring for the density, composition, and distributions at different stations cleared out that the shoreline of the Suez Gulf, especially, Ras Gharib area was subjected to many factors which undoubtedly affected the rate of man-made litter accumulation including heavy shipping traffic, intensive commercial fishing, settlement and fast growing communities, etc. Despite of that the northern parts of the Gulf were still more affected by human impacts compared to the southern parts.
2) Most of the hydrographic parameters, e.g. salinity, pH, etc. showed noticeable local variations and concentrations of pollution indicators such as BOD, DOM and COD, etc. are relatively high and varied according to the distance of the different sites from the effluents.
3) Based on the annual average of the three years, high Chl-a, TSM, and nutrient salts concentrations were generally encountered and reflected eutrophication signs at the coastal water of the Aqaba Gulf.
4) Concentrations of heavy metals and petroleum hydrocarbons displayed remarkable variations during the three years and still under the permissible levels given by EEAA of Egypt and that recorded by the International organizations.
5) There are several commutative and correlative relations between physicochemical parameters, nutrient salts, heavy metals and petroleum hydrocarbons.
6) Therefore, it is highly recommended coastal and marine pollution from fertilizer and chemical industries in Suez should be prevented. Industrial discharges, especially from fertilizers and chemical industries, on a regular basis, should be monitored, to ensure their compliance with local standards, and the criteria set for effluent discharge into the marine environment.
Cite this paper
Abo-El-Khair, E.M., Fattah, L.M.A., Abdel-Halim, A.M., Abd- Elnaby, M.A., Fahmy, M.A., Ahdy, H.H., Hemeilly, A., El-Soud, A.A. and Shreadah, M.A. (2016) Assessment of the Hydroche- mical Characteristics of the Suez Gulf Coas- tal Waters during 2011-2013. Journal of En- vironmental Protection, 7, 1497-1521. http://dx.doi.org/10.4236/jep.2016.711126
References
- 1. Okbah, M.A., Shata, M.A. and Shriadah, M.A. (2005) Gochemical Forms of Trace Metals in Mangrove Sediments—Red Sea (Egypt). Chemistry and Ecology, 21, 23-36.
http://dx.doi.org/10.1080/02757540512331323953 - 2. Shriadah, M.A., Okbah, M.A. and El-Deek, M.S. (2004) Trace Metals in the Water Columns of the Red Sea and the Gulf of Aqaba, Egypt. Water, Air, and Soil Pollution, 153, 115-124.
http://dx.doi.org/10.1023/B:WATE.0000019938.57041.21 - 3. Fahmy, M.A., Shriadah, M.A., Abul-Soud, A., Abdel Rahman, S.M. and Shindy, M. (2005) Hydrography and Chemical Characteristics of the Coastal Water along the Gulf of Suez. Egyptian Journal of Aquatic Research, 31, 1-14.
- 4. Abdel-Halim, A.M., Aboel-Khair, E.M., Fahmy, M.A. and Shreadah, M.A. (2007) Environmental Assessment on the Aqaba Gulf Coastal Waters, Egypt. Egyptian Journal of Aquatic Research, 33, 1-14.
- 5. Shreadah, M.A., Said, T.O., El Zokm, G. and Masoud, M.S. (2008) Physico-Chemical Characteristics of the Surficial Sediments along the Egyptian Red Sea Coasts. Egyptian Journal of Aquatic Research, 34, 16-34.
- 6. Abo-El-Khair, E.M., Abdel Halim, A.M., Shriadah, M.A. and Fahmy, M.A. (2007) Environmental Conditions of the Suez Gulf and the Red Sea Coastal Waters, Egypt. Proceedings of the 8th International Conference on the Mediterranean Coastal Environment, Alexandria, Egypt, 13-17 November 2007, 517-526.
- 7. Abo-El Khair, E.M., Abdel Halim, A.M., Fahmy, M.A. and Shreadah, M.A. (2008) Environmental Impact Assessment of Northern Red Sea Regions during 2005-2007. Egyptian Journal of Aquatic Research, 34, 20-30.
- 8. Gurguess, S.M., Shreadah, M.A., Fahmy, M.A., Aboul El Kheir, E.M. and Abdel Halim, A.M. (2009) Assessment of Water Quality in the Red Sea using in Situ Measurements and Remote Sensing Data. Egyptian Journal of Aquatic Research, 35, 1-13.
- 9. Masoud, M.S., Said, T.O., El-Zokm, G. and Shreadah, M.A. (2010) Speciation of Fe, Mn and Zn in Surficial Sediments from the Egyptian Red Sea Coasts. Chemical Speciation and Biodiversity, 22, 257-269.
http://dx.doi.org/10.3184/095422910X12894975123773 - 10. Said, T.O., Shreadah, M.A., Abdel Ghani, S.A. and Ahmed, A.M. (2010) Alkyltin and Alkayllead Compounds in Coastal Water of Suez Gulf, Egypt. Egyptian Journal of Aquatic Research, 36, 33-42.
- 11. Shreadah, M.A., Said, T.O., Abdel Ghani, S.A. and Ahmed, A.M. (2011) Distribution of Different Organotin and Organolead Compounds in Sediment of Suez Gulf. Journal of Environmental Protection, 2, 545-554.
http://dx.doi.org/10.4236/jep.2011.25063 - 12. Masoud, M.S., Said, T.O., El-Zokm, G. and Shreadah, M.A. (2012) Assessment of Heavy Metals Contamination in Surface Sediments of the Egyptian Red Sea Coasts. Australian Journal of Basic and Applied Sciences, 6, 44-58.
- 13. Hegazy, F.M., Mohamed, T.A., Elshamy, A.I., Hassanien, A.A., Abdel Azim, N.S., Shreadah, M.A., Abdelgawad, I.I., El Kady, E.M. and Paré, P.W. (2015) A New Steroid from the Red Sea Soft Coral Lobophytum Lobophytum. Natural Products Research, 30, 340-344.
- 14. Hegazy, M.F., Gamal-Eldeen, M.A., Mohamed, T.A., Alhammady, M.A., Hassanien, A.A., Shreadah, M.A., Abdelgawad, I.I. and Elkady, E.M. (2015) Cytotoxic Constituents from the Red Sea Soft Coral Nephthea sp. Natural Products Research, 30, 1266-1272.
- 15. REMIP (2008) State of Oil Pollution and Management in Suez Gulf Region. A Report of Regional Environmental Management Improvement Project, July 2008, 132 p.
- 16. Emara, M.M., Farid, N.A., El-Sabagh, E.A., Ahamed, O.E. and Kamal, E.M. (2013) Physico-Chemical Study of Surface Seawater in the Northwestern Gulf of Suez. Egyptian Journal of Chemistry, 56, 345-365.
- 17. Wahby, S.D. and Shriadah, M.A. (1984) The Effect of Sewage Discharge on Some Chemical Characteristics of Seawater. VII Journees Etud Pollutions, Lvcerene, CIESM, 81-90.
- 18. Shriadah, M.A. (2002) Water Quality of Two Semi-Closed Areas in the United Arab Emirates Coast along the Arabian Gulf—A Comparative Study. Pakistan Journal of Marine Science, 11, 19-26.
- 19. Shriadah, M.A. and Abdel Ghani, S. (2007) Impacts of Land Based Sources on Water Quality of Abu-Qir Drain, Egypt. Proceeding of 8th International Conference on the Mediterranean Coastal Environment, Alexandria, Egypt, 13-17 November 2007, 863-872.
- 20. Shriadah, M.A. (1998) Impacts of an Oil Spill on the Marine Environment of the United Arab Emirates along the Gulf of Oman. Marine Pollution Bulletin, 36, 876-879.
http://dx.doi.org/10.1016/S0025-326X(98)00055-1 - 21. Shriadah, M.A. (1998) Metals Pollution in Marine Sediments of the United Arab Emirates Creeks along the Arabian Gulf Shoreline. Bulletin of Environmental Contamination and Toxicology, 60, 417-424.
http://dx.doi.org/10.1007/s001289900642 - 22. Shriadah, M.A. (1999) Oil Contamination along Oil Tanker Routes off the United Arab Emirates (The Arabian Gulf and The Gulf of Oman). Bulletin of Environmental Contamination and Toxicology, 63, 203-210.
http://dx.doi.org/10.1007/s001289900967 - 23. Shriadah, M.A. (1999) Petroleum Hydrocarbons along the Arabian Gulf Coast of the United Arab Emirates. Indian Journal of Marine Science, 28, 10-16.
- 24. Shriadah, M.A. (1999) Occurrence of Trace Metals in the Arabian Gulf and the Gulf of Oman Sediments off the United Arab Emirates. Oebailla, 25, 43-52.
- 25. Shriadah, M.A. (2000) Chemistry of the Mangrove Waters and Sediments along the Arabian Gulf Shoreline of the United Arab Emirates. Indian Journal of Marine Sciences, 29, 224-229.
- 26. Shriadah, M.A. (2000) Levels and Distributions of Petroleum Hydrocarbons in the Coastal Waters and Sediments of the United Arab Emirates in the Arabian Gulf and the Gulf of Oman. Water, Air, and Soil Pollution, 119, 247-256.
http://dx.doi.org/10.1023/A:1005192523876 - 27. Shriadah, M.A. (2000) Contamination by Petroleum Hydrocarbons in Two Semi-Enclosed Areas along the Arabian Gulf Coast of the United Arab Emirates. Oebailla, 26, 49-62.
- 28. Shriadah, M.A. (2003) Tar Contamination on Beaches of the United Arab Emirates. Bulletin of Environmental Contamination and Toxicology, 70, 680-687.
http://dx.doi.org/10.1007/s00128-003-0038-9 - 29. Shriadah, M.A. (2008) Beach Litter along the Coastal Regions of the United Arab Emirates. Egyptian Journal of Aquatic Research, 34, 31-37.
- 30. Shriadah, M.A. (2001) Petroleum Hydrocarbons Concentrations in Arabian Gulf Fish Tissues. Bulletin of Environmental Contamination and Toxicology, 67, 560-567.
http://dx.doi.org/10.1007/s001280160 - 31. Fathy, S.A., Abdel Hamid, F.F., Shreadah, M.A., Mohamed, L.A. and El-Gazar, M.G. (2012) Effect of Some Environmental Pollutants on Enzymatic and Total Antioxidant Activities in Tilapia Niloticus. Blue Biotechnology Journal (BBJ), 1, 433-443.
- 32. Fathy, S.A., Abdel Hamid, F.F., Shreadah, M.A., Mohamed, L.A. and El-Gazar, M.G. (2012) Application of Principal Component Analysis for Developing Water Quality Index for Selected Coastal Areas of Alexandria Egypt. Recourses and Environment Journal, 2, 297-305.
- 33. Fahmy, M.A., Tayel, F.R. and Shriadah, M.A. (1997) Spatial and Seasonal Variations of Dissolved Trace Metals in Two Contaminated Basins of the Coastal Mediterranean Sea, Alexandria, Egypt. Bulletin of Faculty of Science, Alexandria University, 37, 187-198.
- 34. Emara, H.I., Said, T.O., El Naggar, N.A. and Shreadah, M.A. (2008) Aliphatic and Polycyclic Hydrocarbon Compounds as Chemical Markers for Pollution Sources in Relation to Physico-Chemical Characteristics of the Eastern Harbour (Egyptian Mediterranean Sea). Egyptian Journal of Aquatic Research, 34, 1-19.
- 35. Emara, H.I. and Shriadah, M.A. (1991) Manganese, Iron, Cobalt, Nickel, and Zinc in the Eastern harbor and El-Mex Bay Waters (Alexandria). International Proceedings Symposium of Marine Chemistry in the Arab Region, Suez, April 1991, 97-112.
- 36. Shriadah, M.A. and Emara, H.I. (1991) The Distribution of Chromium, Copper, Cadmium, and Lead in Areas of Multi-Polluting Factors of Alexandria. International Proceedings Symposium of Marine Chemistry in the Arab Region, Suez, April 1991, 30-50.
- 37. Emara, H.I., Shriadah, M.A., Maoustafa, Th.H. and El-Deek, M.S. (1995) Trace Metals-Nutrient Salts Relationship in Coastal Seawater of Alexandria. MEDCOAST, Tarragona, 24-27 October 1995, 1457-1464.
- 38. Tayel, F.R., Shriadah, M.A. and El-Shenawy, M. (1997) The Occurrence of Zinc, Copper, Cadmium, and Lead in the Seawater of Alexandria Harbor, Egypt. Proceedings of the 7th International Conference on Environmental Protection, Alexandria, Egypt, 20-22 May 1997, 106-116.
- 39. El Deeb, M.K.Z., Said, T.O., El Naggar, M.H. and Shriadah, M.A. (2007) An Assessment of Pollution Status of Abu Qir Bay with Polycycic Aromatic Hydrocarbons (PAHs) and Their Possible Origins. Proceedings of the 8th International Conference on the Mediterranean Coastal Environment, Alexandria, Egypt, 13-17 November 2007, 895-906.
- 40. Emara, H.I. and Shriadah, M.A. (2009) Distribution and Composition of Aliphatic Aromatic Petroleum Hydrocarbons at Some Hot Spots of Alexandria Coastal Water, Egypt. International Workshop on Integrated Coastal Zone Management, 20-22 October 2009, Izmir, Turkey, 201-217.
- 41. APHA (1995) Standard Methods for the Examination of Water and Wastewater. 19th Edition, American Public Health Association, Inc., New York.
- 42. Calberg, S.R. (1972) New Baltic Manual International Council for the Exploration of the Sea. Cooperative Research Report Copenhagen. Series A. N., 29 p.
- 43. Strickland, J.D.H. and Parsons, T.R. (1972) A Practical Handbook of Seawater Analysis. 2nd Edition, Fisheries Research Board of Canada Bulletin, No. 167, Fisheries Research Board of Canada, 310.
- 44. Intergovernmental Oceanographic Commission (IOC) (1983) Chemical Methods for Use in Marine Environmental Monitoring. Manuals and Guides, UNESCO, 53 p.
- 45. Valderrama, J.C. (1981) The Simultaneous Analysis of Total Nitrogen Total Phosphorus in Natural Waters. Marine Chemistry, 10, 109-122.
http://dx.doi.org/10.1016/0304-4203(81)90027-X - 46. Riley, J.P. and Taylor, D. (1968) Chelating Resins for the Concentration of Trace Elements from Sea Water and Their Analytical Use in Conjunction with Atomic Absorption Spectrophotometry. Analytica Chimica Acta, 40, 479-485.
http://dx.doi.org/10.1016/S0003-2670(00)86764-1 - 47. Abdullah, M.I. and Royle, L.G. (1974) A Study of the Dissolved and Particulate Trace Elements in the Bristol Channel. Journal of the Marine Biological Association of the United Kingdom, 54, 581-597.
http://dx.doi.org/10.1017/S0025315400022761 - 48. Parsons, T.R., Maita, Y. and Malli, G.M. (1985) Determination of Petroleum Hydrocarbons. In: A Manual of Chemical and Biological Method for Seawater Analysis, Pergamon Press, Oxford, 1-78.
- 49. Abu-Hilal, A. and Al-Najar, T. (2004) Litter Pollution on the Jordanian Shores of the Gulf of Aqaba (Red Sea). Marine Environmental Research, 58, 39-63.
http://dx.doi.org/10.1016/j.marenvres.2003.12.003 - 50. Abu-Hilal, A. and Al-Najar, T. (2009) Marine Litter in Coral Reef Areas along the Jordan Gulf of Aqaba, Red Sea. Journal of Environmental Management, 90, 1043-1049.
http://dx.doi.org/10.1016/j.jenvman.2008.03.014 - 51. Shriadah, M.A. and Al-Ghais, S.M. (1999) Environmental Characteristics of the United Arab Emirates Waters along the Arabian Gulf: Hydro Graphical Survey and Nutrient Salts. Indian Journal of Marine Sciences, 28, 225-232.
- 52. Shriadah, M.A. (2001) Physicochemical Properties of the United Arab Emirates Waters along the Arabian Gulf and the Gulf of Oman. Acta Adriatica, 42, 93-102.
- 53. Shreadah, M.A., Said, T.O., Othman, I.M., Fathallah, E.M.I. and Mahmoud, M.E. (2014) Organochlorines in Seawater from Egyptian Mediterranean Coast of Alexandria. Development in Analytical Chemistry, 1, 19-24.
- 54. Shreadah, M.A., Masoud, M.S., Khattab, A.M. and El Zokm, G. (2014) Impacts of Different Drains on the Seawater Quality of El-Mex Bay (Alexandria, Egypt). Journal of Ecology and the Natural Environment, 8, 287-303.
- 55. Shreadah, M.A., Masoud, M.S., Khattab, A.M. and El Zokm, G. (2015) Nutrient Fluxes and Sediments Composition in El Mex Bay and Surround Drains, Alexandria, Egypt. American Journal of Analytical Chemistry, 6, 513-527.
http://dx.doi.org/10.4236/ajac.2015.66050 - 56. Shriadah, M.A., Said, T.O., Younis, A.M. and Farag, R.S. (2006) Physico-Chemical Characteristics of the Semi-Closed Areas along the Mediterranean Coast of Alexandria, Egypt. Egyptian Journal of Aquatic Research, 32, 38-48.
- 57. Jarvie, H.P., Whitton, B.A. and Neal, C. (1998) Nitrogen and Phosphorus in East Coast British River: Speciation, Sources and Biological Significance. Science of the Total Environment, 210-211, 79-109.
http://dx.doi.org/10.1016/S0048-9697(98)00109-0 - 58. Carpenter, S.R., Caraco, N.F., Correll, D.L., Howarth, R.W., Sharpley, A.N. and Smith, V.H. (1998) Nonpoint Pollution of Surface Waters with Phosphorus and Nitrogen. Ecological Applications, 8, 559-568.
http://dx.doi.org/10.1890/1051-0761(1998)008[0559:NPOSWW]2.0.CO;2 - 59. Vucak, Z.A.S. and Strin, J. (1982) Basic Physical Chemical and Biological Data Reports. R.V.A Mohorov ICIC Adriatic Cruises 1974-76, Hydrographic Institute of Yugoslav Navy split, 175.
- 60. Franco, P. (1983) Fatorri influent sulla productivita primaria dell Adriatico settentrionale. Proceeding of the International Conference Problems of the Adriatic Sea, Trieste, 155-174.
- 61. Smith, S.V. (1984) Phosphorus versus Nitrogen Limitation in the Marine Environment. Limnology & Oceanography, 29, 1149-1160.
http://dx.doi.org/10.4319/lo.1984.29.6.1149 - 62. Abrahim, G.M.S. and Parker, R.J. (2008) Assessment of Heavy Metal Enrichment Factors and the Degree of Contamination in Marine Sediments from Tamaki Estuary, Auckland, New Zealand. Environmental Monitoring and Assessment, 136, 227-238.
http://dx.doi.org/10.1007/s10661-007-9678-2 - 63. Al-Najar, T., Rasheed, M., Ababneh, Z., Abaneh, A. and Al-Omary, H. (2011) Heavy Metals Pollution in Sediment Cores from the Gulf of Aqaba, Red Sea. Natural Science, 3, 775-782.
http://dx.doi.org/10.4236/ns.2011.39102 - 64. US EPA (1999) National Recommended Water Quality Criteria. Correction Office of Paper, EPA 822-Z-99,001, 25.