Journal of Environmental Protection
Vol.07 No.09(2016), Article ID:70119,12 pages
10.4236/jep.2016.79107
The Air Quality, Characterization of Polycyclic Aromatic Hydrocarbon, Organic Carbon, and Diurnal Variation of Particulate Matter over Riyadh City
Abdullah S. Modaihsh*, Mohamed O. Mahjoub, Mahmoud E. A. Nadeem, Adel M. Ghoneim, Fahd N. Al-Barakah
Department of Soil Science, College of Food and Agricultural Sciences, King Saud University, Riyadh, Saudi Arabia

Copyright © 2016 by authors and Scientific Research Publishing Inc.
This work is licensed under the Creative Commons Attribution International License (CC BY).
http://creativecommons.org/licenses/by/4.0/


Received 14 June 2016; accepted 23 August 2016; published 26 August 2016
ABSTRACT
Concentrations of airborne particulate matter (PM10 & PM2.5) were measured over a period extended from January 2012 to October 2013 at two sites: a suburban area, Riyadh airport (AP) and an urban area, King Fahd road district (KF) (densely trafficked site) in Riyadh city, Saudi Arabia. The quality of ambient air using the U.S. Environmental Protection Agency (USEPA) Air Quality Index (AQI) was evaluated during this period. The average AQI values exceeded 100 on 6 months out of 11 in AP district. At KF district the condition was worse, and AQI values exceeded 100 on all months. This emphasizes the fact that PM concentrations over Riyadh can be regarded as a real environmental problem that could be a severe risk to quality of life and threaten human health. A higher-volume air sampler at the two sites was used to collect particulate matter (PM10 and PM2.5) for chemical analysis of the PM for PAHs and total organic carbon. At KF station the mean concentrations’ values of total PAHs in PM2.5 and PM10 were 4.89 ng/m3 and 12.96 ng/m3 respectively. At the AP station the corresponding values of total PAHs in PM2.5 and PM10 were 8.07 ng/m3 and 11.91 ng/m3 respectively. The PAHs did not exceed the air criteria of World Health Organization indicating the air pollution of PAHs in Riyadh District was not serious. As for the total organic carbon the results demonstrated that the concentration ranged from 0.211 to 0.506 g/kg at KF station and from 0.054 to 0.342 g/kg at AP station. On an annual basis, OC concentrations were two times higher for the city center site (KF) compared to the rural AP site. This can most likely be explained by increased emissions from higher traffic at KF site. The diurnal variability of PM was mainly associated with the severity of pollution.
Keywords:
Organic Carbon, PAHs, Air Quality, Riyadh, Saudi Arabia

1. Introduction
Particulate Matter (PM) has been associated with a wide range of adverse health effects [1] - [3] . PM10 and PM2.5, with aerodynamic diameters less than 10 μm and 2.5 μm, respectively, can be inhaled into the respiratory tract leading to critical health problems. As such, the concentration of PM10 has been monitored extensively in urban areas in many western countries [4] [5] followed by many Asian countries [6] [7] .
The importance of air pollution research further increases as the International Agency for Research on Cancer (IARC), an agency of World Health Organization (WHO), has classified it as carcinogenic. While air pollution is a complex mixture of gases and compounds, Particulate Matter (PM) in the air has been particularly identified as the main component causing the caner [8] . Many studies have revealed an increasing risk of lung cancer, morbidity, mortality and other diseases with increasing levels of exposure to outdoor air pollution and particulate matter [9] - [17] .
In 2014 WHO issued new information estimating that outdoor air pollution was responsible for the deaths of some 3.7 million people under the age of 60 in 2012. The Organization also emphasized that indoor and outdoor air pollution combined was among the largest risks to health worldwide [18] .
Data released by the WHO [18] showed that air quality in most cities worldwide that monitored outdoor (ambient) air pollution failed to meet WHO guidelines for safe levels, putting people at additional risk of respiratory diseases and other health problems. WHO’s urban air quality database covers 1600 cities across 91 countries― 500 more cities than the previous database (2011). This reveals that more cities worldwide are monitoring outdoor air quality, reflecting growing recognition of air pollution’s health risks. About half of the urban population being monitored is exposed to air pollution that is at least 2.5 times higher than the levels WHO recommends, putting those people at additional risk of serious, long-term health problems. Riyadh is the capital and largest city of Saudi Arabia with a population of over 5 million. In recent years, due to strong economic growth, initiation of massive construction projects, expansion of industries, and increase in traffic flow, severely affected the atmospheric environment, particularly contamination by atmospheric particulate matter. Previous studies focusing on air quality over Riyadh was earlier addressed by El-Shobokshy [19] . He conducted his pioneering study on particulate pollution in Saudi Arabia, but his studies concentrated only on atmospheric lead-pollution in the city of Riyadh. In 1990, El-Shobokshy [20] investigated the influence of meteorology on the concentration of inhalable particulate, which was usually observed in the atmosphere of Riyadh at high concentrations. A relatively detailed study on PM samples collected from June 2006 to May 2007 showed that the PM concentrations were higher for PM10 compared to PM2.5, indicating that the major PM source was local dust [21] .
Al-Harby et al. [22] performed a comparative study of air quality in Riyadh at five air quality monitoring network stations. The results revealed that 71% of the time Riyadh city air is of “Good” quality using the AQI and causes almost no health impacts on city inhabitants. The remaining 29% of more problematic air quality is caused by PM10 (74%) and SO2 (~24%). The study has revealed that both ozone (O3) and carbon monoxide (CO) have little contribution to Riyadh air pollution at 2% and 0.52%, respectively. A recent study [23] showed that PM concentration was approximately 3 times higher than the country’s ambient air quality standards. In addition, this study demonstrated that summer vs. winter comparison showed that PM concentrations were approximately 84% higher in summer. The weekdays PM concentrations were 17% more than the weekend concentrations, indicating weekday activities contributed to the concentrations. Spatial comparison at industrial and residential locations revealed about 60% increase in PM concentrations [23] .
Modaihsh et al. [24] measured mass concentrations of PM10 and PM2.5 for January 2012 up to October 2013 at two sites: a suburban area, and a densely trafficked site). It was found that both PM10 and PM2.5 showed substantial variations at these two monitoring stations during the study period. In the urban station (King Fahd Road), average annual PM varied by up to roughly a factor of two. The temporal variation observed for either PM10 or PM2.5 was associated mainly with the dust events. The annual pattern of PM10 and PM2.5 at the suburban station shows a significant increase in spring and summer (dusty seasons).
The primary goal of this study was to carry out a comprehensive characterization of these pollutants in Riyadh city, Saudi Arabia and provide the scientific background for further control of air pollution at Riyadh and to develop effective strategies to reduce the ambient deposition and concentrations of the various pollutants to the city. As such this study addresses several concerns related to air quality in Riyadh city and contributes to the knowledge that could tackle one of the major national environmental issues. Mass concentrations of PM2.5, PM10, and PM1 (only at KF site) for January 2012 up to October 2013 were measured at two sites: a suburban area, Riyadh airport (AP) and an urban area, King Fahd road (KF) (densely trafficked site).
2. Materials and Methods
In this study, the concentrations of coarse (PM10), and fine (PM2.5), particulate matter were measured using a Grimm model EDM 365 aerosol spectrometer (Grimm Aerosol Technique GmbH, Airing, Germany). The advantages of this instrument over other real-time measurement instruments, such as TEOM or DMA devices, are its convenience, its low maintenance requirements, and its ability to run for long periods without specific supervision. The validity of the measurements performed by the instrument has been evaluated by several studies [25] . The dust monitor was installed at two sites; a suburban area, Riyadh airport (AP) and an urban area, King Fahd road district (KF) (densely trafficked site). in Riyadh city, Saudi Arabia.
2.1. Calculation of Air Quality Index
In order, to assess the temporal and spatial air quality of Riyadh and to identify the impact of air pollution on human health, we used the air quality index standard by EPA [26] . The AQI varies from 0 to 500, is divided into six categories, and its health indicators corresponds to a different level of health concern [26] . All AQI categories have less or more impact on human health, and specifically the last AQI category (hazardous, >425 PM10 μg.m−3), is associated with a serious risk of respiratory symptoms and aggravation of lung diseases, such as asthma, for sensitive groups and with respiratory effects likely in the general population [27] [28] .
Based on the technological rules related to AQI, the following formula was used to derive the PM10 concentration from AQI:

where I the (Air Quality) sub-index, C is the pollutant concentration, I low and I high are the index breakpoints corresponding to C low and C high, respectively and, C low and C high are the concentration breakpoints that are ≤ C or ≥ C.
2.2. Chemical Analysis
2.2.1. Sampler and Sample Preparation
A high-volume air sampler (Precision Hi-Volume Air Sampler, GCA Corp., Precision Scientific Group, 3737 West Cortland St., Chicago, IL, USA) was used to collect particulate matter with 10 μm size cutoff (PM10). A quarter of the filter was cut, weighed (samples and method blanks (~0.5 g GF filter) were weighed on an analytical balance), and then folded and placed in a 100-mL stainless steel Accelerated Solvent Extractor (ASE) cell (Dionex, Sunnyvale, CA, USA).
2.2.2. Analysis
PAHs together with organic carbon were analyzed systematically for characterization of Riyadh aerosol Analyze separation, detection, and identification were performed by gas chromatography ? mass spectrometry (GC-MS) on an Agilent (Palo Alto, CA) 6890N gas chromatograph equipped with an Agilent HP-5MS column (30 m × 0.25 mm × 0.25 μm film thickness) and 5973N mass selective detector. The oven temperature was ramped from 60˚C (2 min) to 320˚C (20 min) at a rate of 6˚C/min. PAHs concentrations in filter extracts were determined by GC-MS in the selected ion monitoring (SIM) mode using electron impact (EI).
3. Results and Discussion
3.1. Air Quality for Aerosol PM2.5 and PM10
Tables 1-4 show the average monthly air quality index for the study period in the AP and KF stations as calculated

Table 1. Indication of health quality with the AQI, for PM10 at AP during the period February 2012 to January 2013.
Table 2. Indication of health quality with the AQI, for PM2.5 at AP during the period February 2012 to January 2013.
Table 3. Indication of health quality with the AQI, for PM10 at KF.
Table 4. Indication of health quality with the AQI, for PM2.5 at KF.
from the above formula. Based on the overall PM concentrations, the air quality of the AP district Riyadh ranged from moderate to hazardous for PM10 (Table 1) and from very unhealthy to moderate for PM2.5 (Table 2). In Spring (Feb. to April) the air quality ranged from hazardous to very unhealthy for both PM2.5 and PM10; whereas in fall (November), it was moderate for both PM2.5 and PM10. In summer, the AQI ranged from unhealthy to moderate for both PM10 and unhealthy for PM2.5.
The air quality of the KF district in Riyadh ranged from hazardous (June July 2012 and March 2013) to unhealthy the rest of the year for PM10. For PM2.5 the air quality was unhealthy throughout the study period (Table 3 & Table 4), respectively.
Considering air pollution standards as defined by the USEPA which specifies that AQI values can be higher than 100 on only one day of the year, the city of Riyadh did not perform well at all. It was found that average AQI values exceeded 100 on 6 months out of 11 in AP district. At KF district the condition is worse AQI values exceeded 100 on all months. At KF apart from the dust storms, re-suspended dust within the urban environment is an additional strong source of PM10 concentrations. Many studies have confirmed a close relationship between particulate matter (PM10) pollution and worsening in human health. The key properties of airborne particles are generally considered to be the size of aerosols and the associated capacity for infiltration into the human respiratory system. This is supported by epidemiological evidence. As such, the concentration of PM10 needs continuous monitoring in Riyadh city.
3.2. Chemical Composition
3.2.1. Total Organic Carbon
The annual mean concentration of total Organic Carbon (OC) in PM10 ranged from 0.211 at AP to 0.506 g/kg at KF station and from 0.054 to 0.342 g/kg at AP station. On an annual basis, OC concentrations were two times higher (Table 5) for the city center site (KF) compared to the rural AP site. This can most likely be explained by increased emissions from higher traffic at KF site. In study covering several European countries Yitril et al., 2007 found that OC concentration were three times higher for the rural background sites in continental Europe compared to Scandinavia and British Isles, most of the sites are situated in the densely populated Central Europe, and thus elevated concentrations could be expected. In the present study, both sites experienced higher concentrations of OC during summer compared to winter (January). Similar to our result Malm et al. [29] , in study addressing the level of OC in PM2.5 at 143 rural and four urban sites within the network in the United States for 2001, found that only the urban sites reported higher concentrations of OC during winter compared to summer. This indicates greater impact from urban areas at rural background sites in Europe compared to the USA, either as a result of a higher pollution level in general, and/or due to a denser and more uniformly distributed population pattern [30] .
3.2.2. Polycyclic Aromatic Hydrocarbon PAHs
Sixteen PAHs, Naphthalene (NaP), Acenaphthylene (Acy), Acenaphthene (Ace), Fluorene (Flu), Phenanthrene (Phe), Anthracene (Ant), Fluoranthene (Fluo), Pyrene (Pyr), Benzo[a]anthracene (BaA), Chrysene (Chr), Benzo[b] fluoranthene (BbF), Benzo[k]fluoranthene (BkF), Benzo[a]pyrene (BaP), Indeno[1, 2, 3-cd]pyrene (Ind), Dibenzo[a, h]anthracene (Dib) and Benzo[ghi]perylene (BghiP), were detected in PM10, and PM2.5 except NaP in PM2.5 at the AP station. Table 6 shows the variation of PAHs in PM10 and PM2.5 in AP and KF stations during 2012.
At KF station the mean Concentrations values of total PAHs in PM2.5 and PM10 were 4.89 ng/m3 and 12.96 ng/m3 respectively. The corresponding maximum values were 8.15 ng/m3 and 24.75 ng/m3 respectively and the corresponding minimum values were 1.4 ng/m3 and 3.8 ng/m3 respectively (Table 6).
At the AP station the mean Concentrations values of total PAHs in PM2.5 and PM10 were 8.07 ng/m3 and 11.91 ng/m3 respectively. The corresponding maximum values were 13.5 ng/m3 and 14.5 ng/m3 respectively and the corresponding minimum values were 3.2 ng/m3 and 9.4 ng/m3 respectively (Table 6). Content of PAHs in PM10 were found highest in the urban site and lowest in the suburban site. For concentrations of PAHs in PM2.5 the highest were recorded in the suburban site (AP). Among the PAHs, concentration of (BaP) was lower and (Dib) was higher than other compounds in PM10 at AP station. At KF station the highest PAHs recorded was NaP. On the other hand at the airport there was comparatively lower amount of NaP in PM10 while no
Table 5. Monthly ambient concentrations of OC, in AP and KF stations 2012.
Table 6. Variation of PAHs (ng/m3) in PM10 and PM2.5 in AP and KF stations 2012.
amounts were detected in PM2.5. The PAHs did not exceed the air criteria of World Health Organization, indicating the air pollution of PAHs in Riyadh District was not serious. In comparison to previous research, PAHs contents in PM2.5 in Tanggu District were lower than the heaviest traffic road in Qingdao (263 ng/m3), China [31] and much higher than downtown Atlanta (3.16 - 3.40 ng/m3), US [32] , whereas in PM10, concentration of PAHs was significantly higher than Algiers (15.8 - 29.3 ng/m3), Algeria [33] and the Greater Area of Athens, Greece (7.9 ng/m3) [34] in winter.
3.3. Diurnal Variation of Particulate Matter
The diurnal concentration patterns are mostly determined by emission characteristics of the dominant sources and the metrological conditions. Therefore, differences between traffic influenced sites (KF) and rural sites (AP) as well as seasonal differences are to be expected. Days with relatively high PM10 concentrations (22/12/2012), and low PM10 concentration (8/12/2012) in the KF site and AP site, are further examined regarding diurnal variability of PM10, PM2.5. At KF site (Figure 1), during severe pollution day in winter, PM10 and also, PM2.5 values are much higher during the day as compared to night and early morning hours. During less polluted day

Figure 1. Diurnal variation of PM10 and PM2.5 on selected days in winter KF station.
PM10 values are much higher during night and early morning. The thin boundary layer and the strong thermal reversal that occur during nights in the arid environment of Riyadh may lessen buoyancy and, therefore, trap pollutants near the surface. Thus, explaining the extremely large PM10 concentrations sometimes found during winter nights and early morning hours.
During severely polluted days in spring, and/or summer (June in KF and April in AP, the diurnal variability in PM10 concentrations follows an opposite pattern (Figure 2) with low values in the nighttime and early morning and extremely high values at noon and afternoon hours. it was found that during most summer days PM10 values were high in the afternoon. This can be explained by the frequent arrival of dust storms during noon and afternoon.
The diurnal variability in PM2.5 on the selected days is similar to that of PM10. Higher PM2.5 and PM1.0 concentrations were also measured from noon to afternoon hours in summer, indicating that dust storms can also carry significant quantities of small fraction particles over distances from the source region. This may indicates that during, the main source region for all particle sizes is the transported dust. It should be noted that the influence of long-range transported aerosols, such as dust particles, on surface aerosol concentrations is more profound in rural areas; AP site (Figure 3 & Figure 4) with local background pollution levels than in downtown
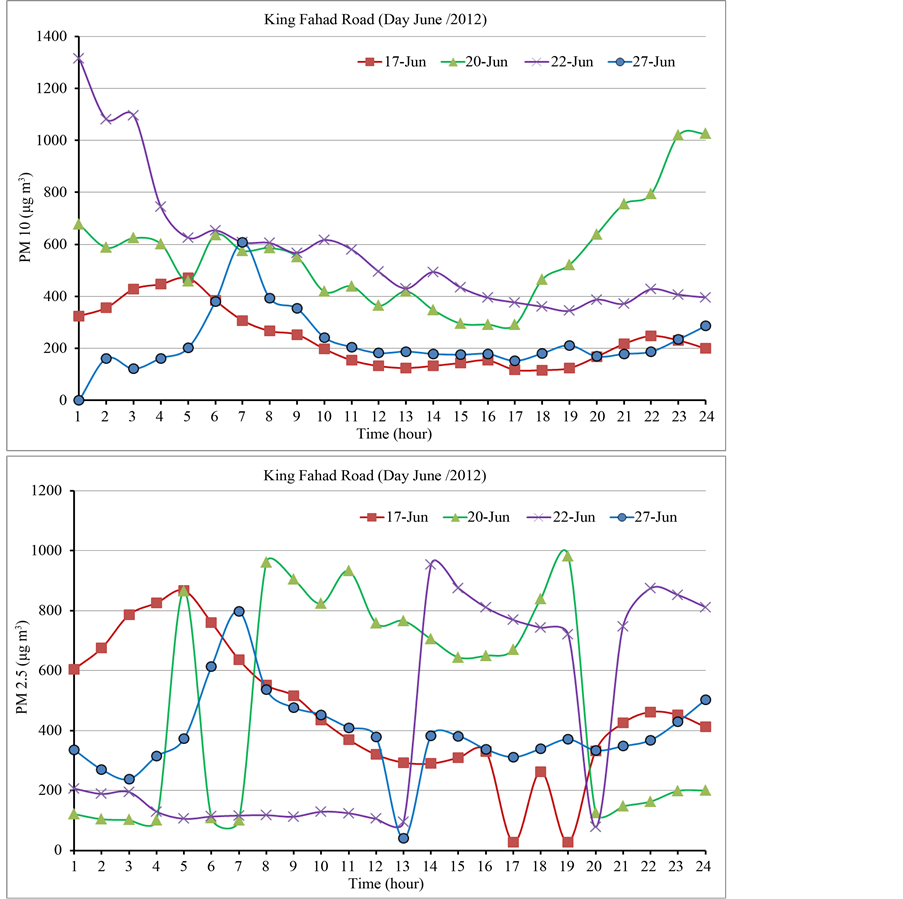
Figure 2. Diurnal variation of PM10 and PM2.5 on selected days in summer KF station.

Figure 3. Diurnal variation of PM10 and PM2.5 on selected days in winter AP station.
urban environments (KF), as has also been found in Rome [35] . Traffic influence as shown when comparing working days versus nonworking days at the urban site (KF) is not clearly noticed and the basic characteristics is similar for both sites on working and non-working days.
4. Conclusion
Considering air pollution standards as defined by the USEPA, the city of Riyadh did not perform well at all. However, it should noted that the low PM2.5/PM10 in this study implies that PM in Riyadh mainly consists of coarse particles and this could indicate lower health impact. Since the ultrafine particles produced by combustion or anthropogenic activities that generate PM seem to be more consistently pathogenic than crustal particles, there is also a need to take further restriction to limit emissions of these ultrafine particles. Moreover, the natural inflows of suspended particulate matter, from desert origin, may need to be taken into consideration in the future air quality guidelines and standards for the geographical areas that are affected by Saharan dust. Future strategies should be directed to combat dust storms and concentrate on preventing the dust from being picked up in the source area as it may often be cheaper. This could be done by reduction of the impact of wind speed through the
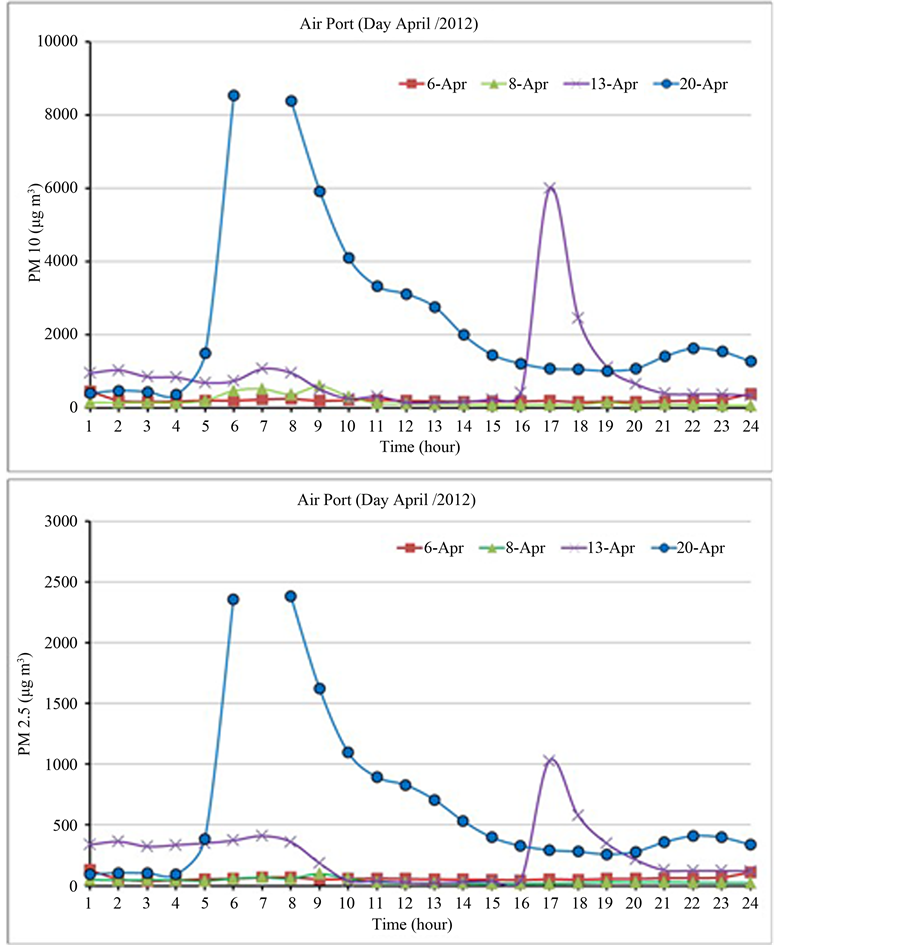
Figure 4. Diurnal variation of PM10 and PM2.5 on selected days in summer AP station.
use of live windbreaks or shelterbelts and protecting the loose soil particles by use of vegetative cover or plastic sheets or chemical adhesives.
Acknowledgements
This study was funded by the National Plan for Science, Technology and Innovation (MAARIFAH), King Abdul-Aziz City for Science and Technology, Kingdom of Saudi Arabia, Project #8 ENV319-02 under the title “Characteristics and Composition of the Falling Dust and Particulate Matter and Its Health Hazards in Riyadh City, Saudi Arabia”.
Cite this paper
Abdullah S. Modaihsh,Mohamed O. Mahjoub,Mahmoud E. A. Nadeem,Adel M. Ghoneim,Fahd N. Al-Barakah, (2016) The Air Quality, Characterization of Polycyclic Aromatic Hydrocarbon, Organic Carbon, and Diurnal Variation of Particulate Matter over Riyadh City. Journal of Environmental Protection,07,1198-1209. doi: 10.4236/jep.2016.79107
References
- 1. Kappos, .D., Bruckmann, P., Eikmann, T., Englert, N., Heinrich, U., Hoppe, P., Koch, E., Krause, G.H.M., Kreyling, W.G., Rauchfuss, K., Rombout, P., Schulz-Klemp, V., Thiel, W.R. and Wichmann, H.E. (2004) Health Effects of Particles in Ambient Air. International Journal of Hygiene and Environmental Health, 207, 399-407.
http://dx.doi.org/10.1078/1438-4639-00306 - 2. Wilson, J.G., Kingham, S., Pearce, J. and Sturman, A.P. (2005) A Review of Intraurban Variations in Particulate Air Pollution: Implications for Epidemiological Research. Atmospheric Environment, 39, 6444-6462.
http://dx.doi.org/10.1016/j.atmosenv.2005.07.030 - 3. Dutton, S.J., Rajagopalan, B., Vedal, S. and Hannigan, M. (2010) Temporal Patterns in Daily Measurements of Inorganic and Organic Speciated PM2.5 in Denver. Atmospheric Environment, 44, 987-998.
http://dx.doi.org/10.1016/j.atmosenv.2009.06.006 - 4. Bernardoni, V., Vecchi, R., Valli, G., Piazzalunga, A. and Fermo, P. (2011) PM10 Source Apportionment in Milan (Italy) Using Time-Resolved Data. Science of the Total Environment, 409, 4788-4795.
http://dx.doi.org/10.1016/j.scitotenv.2011.07.048 - 5. Vicente, A.B., Sanfeliu, T. and Jordan, M.M. (2012) Assessment of PM10 Pollution Episodes in a Ceramic Cluster (NE Spain): Proposal of a New Quality Index for PM10, As, Cd, Ni and Pb. Journal of Environmental Management, 108, 92-101.
http://dx.doi.org/10.1016/j.jenvman.2012.04.032 - 6. Wong, G.W.K. and Chow, C.M. (2008) Childhood Asthma Epidemiology: Insights from Comparative Studies of Rural and Urban Populations. Pediatric Pulmonology, 43, 107-116.
http://dx.doi.org/10.1002/ppul.20755 - 7. Lee, I.S., Kim, H.J., Lee, D.H., Hwang, G.B., Jung, J.H., Lee, M., Lim, J. and Lee, B.U. (2011) Aerosol Particle Size Distribution and Genetic Characteristics of Aerosolized Influenza A H1N1 Virus Vaccine Particles. Aerosol and Air Quality Research, 11, 230-237.
http://dx.doi.org/10.4209/aaqr.2010.12.0105 - 8. IARC (International Agency for Research on Cancer) (2013) Outdoor Air Pollution a Leading Environmental Cause of Deaths.
http://www.iarc.fr/en/media–centre/iarcnews/pdf/pr221_E.pdf - 9. Dockery, D.W. (2001) Epidemiologic Evidence of Cardiovascular Effects of Particulate Air Pollution. Environmental Health Perspectives, 109, 483-486.
http://dx.doi.org/10.1289/ehp.01109s4483 - 10. Lin, M., Chen, Y., Burnett, R.T., Villeneuve, P.J. and Krewski, D. (2002) The Influence of Ambient Coarse Particulate Matter on Asthma Hospitalization in Children: Case-Crossover and Time Series Analyses. Environmental Health Perspectives, 110, 575-581.
http://dx.doi.org/10.1289/ehp.02110575 - 11. Pope, C.A., Burnett, R.T., Thun, M.J., Calle, E.E., Krewski, D., Ito, K. and Thurston, G.D. (2002) Lung Cancer, Cardiopulmonary Mortality, and Long-Term Exposure to Fine Particulate Air Pollution. Journal of the American Medical Association, 287, 1132-1141.
http://dx.doi.org/10.1001/jama.287.9.1132 - 12. Brunekreef, B. and Forsberg, B. (2005) Epidemiological Evidence of Effects of Coarse Airborne Particles on Health. European Respiratory Journal, 26, 309-318.
http://dx.doi.org/10.1183/09031936.05.00001805 - 13. Sioutas, C., Delfino, R.J., Singh, M. (2005) Exposure Assessment for Atmospheric Ultrafine Particles (UFPs) and Implications in Epidemiologic Research. Environmental Health Perspectives, 113, 947-955.
http://dx.doi.org/10.1289/ehp.7939 - 14. Nieuwenhuijsen, M.J., Gomez Perales, J.E. and Colvile, R.N. (2007) Levels of Particulate Air Pollution, Its Elemental Composition, Determinants and Health Effects in Metro Systems. Atmospheric Environment, 41, 7995-8006.
http://dx.doi.org/10.1016/j.atmosenv.2007.08.002 - 15. Perez, L., Tobias, A., Querol, X., Pey, J., Alastuey, A., Diaz, J. and Sunyer, J. (2012) Saharan Dust, Particulate Matter and Cause-Specific Mortality: A Case-Crossover Study in Barcelona (Spain). Environment International, 48, 150-155.
http://dx.doi.org/10.1016/j.envint.2012.07.001 - 16. Fossati, S., Baccarelli, A., Zanobetti, A., Hoxha, M., Vokonas, P.S., Wright, R.O. and Schwartz, J. (2014) Ambient Particulate Air Pollution and MicroRNAs in Elderly Men. Epidemiology, 25, 68-78.
http://dx.doi.org/10.1097/EDE.0000000000000026 - 17. Tao, Y., Mi, S.Q., Zhou, S.H., Wang, S.G. and Xie, X.Y. (2014) Air Pollution and Hospital Admissions for Respiratory Diseases in Lanzhou, China. Environmental Pollution, 185, 196-201.
http://dx.doi.org/10.1016/j.envpol.2013.10.035 - 18. WHO (2014) http://www.who.int/phe/health_topics/outdoorair/databases/cities/en/
- 19. El-Shobokshy, M. (1985) Atmospheric Lead Pollution in Area of Children’s School in the City of Riyadh. Proceedings of 78th APCA Annual Meeting, CoboHall·Detroit APCA’85, Detroit, 16-21 June 1985.
- 20. El-Shobokshy, M., Al-Tamrah, S. and Hussein, F. (1990) Inhalable Particulates and Meteorological Characteristics of the City of Riyadh, Saudi Arabia. Atmospheric Environment, Part B: Urban Atmosphere, 24, 261-265.
http://dx.doi.org/10.1016/0957-1272(90)90031-O - 21. Rushdi, A.I., Al-Mutlaq, K.F., Al-Otaibi, M., El-Mubarak, A.H. and Simoneit, B.R. (2013) Air Quality and Elemental Enrichment Factors of Aerosol Particulate Matter in Riyadh City, Saudi Arabia. Arabian Journal of Geosciences, 6, 585-599.
http://dx.doi.org/10.1007/s12517-011-0357-9 - 22. Alharbi, B., Shareef, M.M. and Husain, T. (2015) Study of Chemical Characteristics of Particulate Matter Concentrations in Riyadh, Saudi Arabia. Atmospheric Pollution Research, 6, 88-98.
http://dx.doi.org/10.5094/APR.2015.011 - 23. Alharbi B.H., Pashai, M.J. and Tapper N. (2014) Assessment of Ambient Air Quality in Riyadh City, Saudi Arabia. Current World Environment, 9, 227-236.
http://dx.doi.org/10.12944/CWE.9.2.01 - 24. Modaihsh, A.S., Al-Barakah F.N., Nadeem M.E.A. and Mahjoub, M.O. (2015) Spatial and Temporal Variations of the Particulate Matter in Riyadh City, Saudi Arabia. Journal of Environmental Protection, 6, 1293-1307.
http://dx.doi.org/10.4236/jep.2015.611113 - 25. Burkart, J., Steiner, G., Reischl, G., Moshammer, H., Neuberger, M. and Hitzenberger, R. (2010) Characterizing the Performance of Two Optical Particle Counters (Grimm OPC1.108 and OPC1.109) under Urban Aerosol Conditions. Journal of Aerosol Science, 41, 953-962.
http://dx.doi.org/10.1016/j.jaerosci.2010.07.007 - 26. EPA (1999) Guidelines for Reporting of Daily AQI.
https://www3.epa.gov/ttn/caaa/t1/memoranda/rg701.pdf - 27. Ozer, P., Bechir, M., Laghdaf, O.M. and Gassani, J. (2006) Estimation of Air Quality Degradation due to Saharan Dust at Nouakchott, Mauritania, from Horizontal Visibility Data. Water, Air, & Soil Pollution, 178, 79-87.
http://dx.doi.org/10.1007/s11270-006-9152-8 - 28. Mohan, M. and Kandya, A. (2007) An Analysis of the Annual and Seasonal Trends of Air Quality Index of Delhi. Environmental Monitoring and Assessment, 131, 267-277.
http://dx.doi.org/10.1007/s10661-006-9474-4 - 29. Malm, W.C., Schichtel, B.A., Pitchford, M.L., Ashbaugh, L.L. and Eldred, R.A. (2004) Spatial and Monthly Trends in Speciated Fine Particle Concentration in the United States. Journal of Geophysical Research: Atmospheres, 109, Article ID: D03306.
http://dx.doi.org/10.1029/2003jd003739 - 30. Yitril, K.E., Aas, W., Bjerke, A., Cape, J.N., Cavalli, F., Ceburnis, D., Dye, C., Emblico, L., Facchini, M.C., Forster, C., Hanssen, J.E., Hansson, H.C., Jennings, S.G., Maenhaut, W., Putaud, J.P. and Torseth, K. (2007) Elemental and Organic Carbon in PM10: A One Year Measurement Campaign within the European Monitoring and Evaluation Programme EMEP. Atmospheric Chemistry and Physics, 7, 5711-5725.
http://dx.doi.org/10.5194/acp-7-5711-2007 - 31. Wang, G.H., Huang, L.M., Gao, S.X., Gao, S.T. and Wang, L.S. (2002) Measurements of PM10 and PM2.5 in Urban Area of Nanjing, China and the Assessment of Pulmonary Deposition of Particle Mass. Chemosphere, 48, 689-695.
http://dx.doi.org/10.1016/S0045-6535(02)00197-2 - 32. Li, Z., Sjodin, A., Porter, E.N., Patterson Jr., D.G., Needham, L.L., Lee, S., Russell, A.G. and Mulholland, J.A. (2009) Characterization of PM2.5-Bound Polycyclicaromatic Hydrocarbons in Atlanta. Atmospheric Environment, 43, 1043-1105.
http://dx.doi.org/10.1016/j.atmosenv.2008.11.016 - 33. Ladji, R., Yassaa, N., Balducci, C., Cecinato, A. and Meklati, B.Y. (2009) Annual Variation of Particulate Organic Compounds in PM10 in the Urban Atmosphere of Algiers. Atmospheric Research, 92, 258-269.
http://dx.doi.org/10.1016/j.atmosres.2008.12.002 - 34. Mantis, J., Chaloulakou, A. and Samara, C. (2005) PM10-Bound Polycyclic Aromatic Hydrocarbons (PAHs) in the Greater Area of Athens, Greece. Chemosphere, 59, 593-604.
http://dx.doi.org/10.1016/j.chemosphere.2004.10.019 - 35. Gobbi, G.P., Kaufman, Y.J., Koren, I. and Eck, T.F. (2007) Classification of Aerosol Properties Derived from AERONET Direct Sun Data, Atmos. Chemical Physics, 7, 453-458.
http://dx.doi.org/10.5194/acp-7-453-2007
NOTES

*Corresponding author.