Journal of Environmental Protection
Vol.5 No.10(2014), Article ID:48071,9 pages
DOI:10.4236/jep.2014.510085
Analyses of Physical and Chemical Parameters in Surface Waters nearby a Cement Factory in North Central, Nigeria
Francis K. Meme1, Francis O. Arimoro2, Francis O. Nwadukwe1
1Department of Animal and Environmental Biology, Delta State University, Abraka, Nigeria
2Department of Biological Sciences, Federal University of Technology, Minna, Nigeria
Email: memfranduken@yahoo.com
Copyright © 2014 by authors and Scientific Research Publishing Inc.
This work is licensed under the Creative Commons Attribution International License (CC BY).
http://creativecommons.org/licenses/by/4.0/


Received 16 March 2014; revised 12 April 2014; accepted 4 May 2014
Abstract
Water samples were collected from three stations along the water course of Oinyi River, Kogi State, Nigeria, bi-monthly for 12 months (October 2010 to September 2011). A total of 16 physical and chemical parameters (temperature, dissolved oxygen, biochemical oxygen demand, chemical oxygen demand, electrical conductivity, flow velocity, depth, nitrate, nitrite, phosphate, ammonia, pH, turbidity, total suspended solids, total dissolved solids and colour) were analyzed and results showed that pH (6.8 to 7.26), conductivity (106.0 to 211.7 µS/cm), colour (3.87 ± 0.159 Pt.Co), turbidity (14 - 22.7 NTU), total suspended solids (45 - 54 mg/l), biochemical oxygen demand (2.05 - 2.89 mg/l), chemical oxygen demand (17.19 ± 0.15 mg/l), temperature (24˚C to 27˚C) and depth (0.23 to 0.35 m) were significantly different across the different stations and between the months. However, total dissolved solids (52.7 to 108.8 mg/l), dissolved oxygen (6.02 to 7.01 mg/l), ammonia (0.00 to 0.02 mg∙l−1), nitrite (0.01 - 0.09 mg∙l−1), nitrate (0.045 ± 0.006 mg∙l−1), phosphate (0.2 to 2.05 mg∙l−1) and flow velocity (0.1 to 0.35 m∙s−1) showed variations within the sampling stations. Maximum conductivity (211.7 µS/cm), colour (5.83 Pt.Co), turbidity (22.7 NTU), total suspended solids (54 mg/l), total dissolved solids (108.8 mg/l), nitrite (0.09 mg/l) and nitrate (0.006 mg/l) values were recorded at station 2 which is the discharge point of industrial waste. River water did show significant pollutional increase at the effluent impacted site during the present study. Dissolved oxygen showed direct relation with temperature, biochemical oxygen demand and chemical oxygen demand. The non-stop and continuous discharges of cement waste water into the river lessened water quality with significant or corresponding effect on the biota of the studied area, thus paving way for clear assertion that the water quality deterioration was as a result of the impacts of the waste water from cement industry.
Keywords: Cement, Oinyi River, Water Quality, Pollution, Discharge Point

1. Introduction
Water quality guidelines provide basic scientific information about water quality parameters and ecologically relevant toxicological threshold values to protect specific water uses. Important physical and chemical parameters influencing the aquatic environment are pH, nutrient, temperature, salinity, dissolved oxygen and biochemical oxygen demand, chemical oxygen demand, colour, flow velocity. Others are total suspended and dissolved solids, total alkalinity and acidity and heavy metal contaminants. These parameters are the limiting factors for the survival of aquatic organisms (flora and fauna) [1] . Water pollution in Nigeria occurs in both rural and urban areas. In most rural communities, the predominant source of drinking water is rivers and streams which are usually polluted by organic substances from upstream users who may as well use water for some agricultural and industry related activities. The outcome of anthropogenic activities along streams and rivers in the world is the alteration of the ecological status of the receiving water body [2] -[5] . Many chemicals have the potential of travelling throughout a waterway and thus, because some are pollutants, they may cause significant distress to the habitat as well as the biota. Effluent from cement industries is composed of a complex mixture of chemicals, such as potassium and sodium hydroxide, chlorides, sulphates and calcium carbonate, varying in composition over time. When mixed with the receiving water, this effluent may trigger a consequential change in pH, temperature, color, suspended solid, conductivity and biological oxygen demand (BOD5) of the receiving water body thus, affecting the normal environment for aquatic biota, with an unprecedented change in the amount of dissolved oxygen [6] . This will affect the ecological parameters of the water body.
Oinyi River serves for both domestic and industrial purposes and it is constantly perturbed by waste water from a cement industry. The impacts of this waste water on the water quality are presently unknown as there is no documented information.
Thus, this study was structured with the following aims:
1) to determine the physicochemical parameters of Oinyi River in relation to water quality requirements for domestic purpose.
2) to determine the effects of the industrial effluent if any on the physical and chemical parameters of the river.
2. Materials and Methods
The study was conducted in Oinyi River at Obajana, Kogi State, Nigeria. The location is situated 289 km Southwest (217˚) of the approximate centre of Nigeria and 177 km Southwest (223˚) of Abuja, the Nigerian capital. It lies between latitude 7.92 (7˚55'0''N) and longitude 6.43 (6˚25'60''E) (Figure 1). Oinyi River is a third order river and presently houses the Obajana mini-dam where a cement factory is situated. The study area shows characteristic tropical climate of two distinct seasons that is, the wet (runs from May to October) and dry season (runs from November to April). The mean annual relative humidity is 81% and the mean annual temperature is 29˚C.
3. Sampling Stations
Three stations were chosen along the river length of about 3 km apart and each sampling station was 25 m stretch along the stream. Station 1 was located upstream toward the Obajana mini-dam and has a relatively high flow, and a sandy and rocky floor. This station has to the left flank the Obajana Cement Factory and water for all industrial activities for the running of the day to day activities of the Cement Industry is extracted from this station. Human activities here include fishing, laundry works and bathing. Flora composition is chiefly grasses, herbs and shrubs.
Station 2 was located 25 m downstream of station 1 and about 3 m from the point of discharge of industrial effluent under the main Obajana Bridge. This station has a characteristic moderate flow, sandy floor with lesser rocks and houses some aquatic macrophytes. This station is surrounded by grasses, herbs and shrubs. Major agricultural activities take place here including fishing. Other human activities include laundry works and bathing.
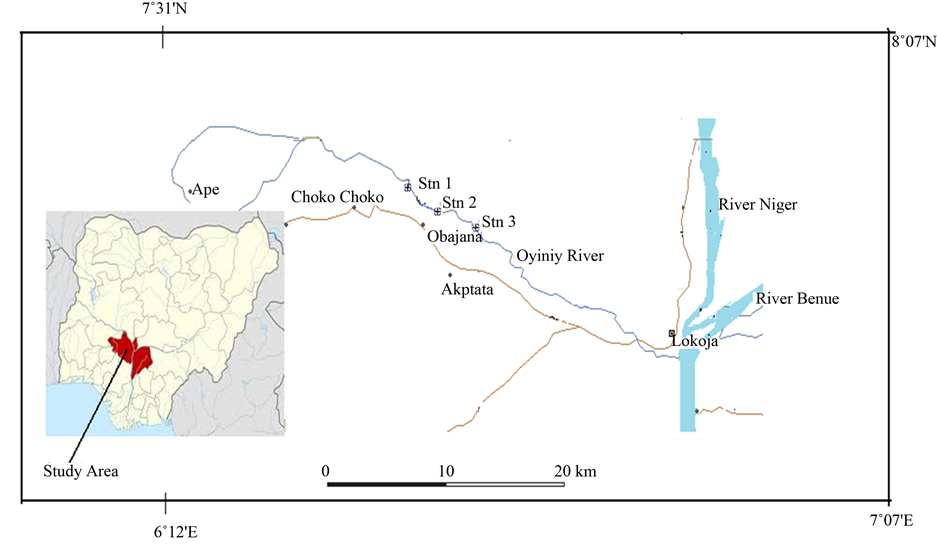
Figure 1. Study area, showing sampling stations in Oinyi River, north central, Nigeria.
Station 3 is located downstream of point of discharge of industrial effluent. It is characterized by a swift flow current, fine grain sediment bottom and surrounded by trees, shrubs and many aquatic emergent macrophytes are also present. Human and other agricultural activities are usually on the average in this station.
3.1. Water Sampling
The study was carried out bi-monthly between October 2010 and September 2011. The period corresponded to low water levels and peak flooding in the Oinyi River. Samples of water were collected from the experimental stations of the river. Collections were carried out using 4 litre plastic kegs and 250 ml reagent bottles. The kegs and bottles were immersed below the water surface and filled to capacity, brought out of the water and properly sealed. The samples were immediately stored on ice in a dark cooler box after collected and then transported to the laboratory for analyzing within twenty-four hours of collection. All the analyses were based on standard methods as appropriate to each water quality parameter, as prescribed in the [7] [8] .
3.2. Analyses of Physicochemical Parameters
The air and water temperatures were measured at the sampling sites with mercury-in-glass thermometer. For air temperature, the thermometer was held up right in the air with the fingers and with the lower part exposed to the air for about four to five minutes. For water temperature, the thermometer was immersed in water 6 cm below the water surface and left to stabilize for about five minutes. The average values for air and water temperatures were recorded in degrees centigrade (˚C). Jenway 3320 digital pH meter was used for pH test. Dissolved oxygen was determined by the use of the modified Winkler’s Azide method [8] .
Turbidity levels were measured in Nephelometric units (NTUs) in the laboratory using a multi-meter water checker (Horiba U-10). In order to determine the biological oxygen demand of water samples of this study, the water sample was put in an incubator at a temperature of 20˚C for five days after which the dissolved oxygen level was determined again. The difference in the dissolved oxygen values before and after incubation described the Biological oxygen demand (BOD5). Chemical oxygen demand (COD) determination was carried out by refluxing using potassium dichromate K2Cr2O7 as the oxidant in the presence of HgSO4 and H2SO4 reagent and then titrating excess K2Cr2O7 against Fe(NH4)2·(SO4)2·6H2O using ferroin indicator. For the total suspended solid test; the settleable solids were removed first and the Total Suspended Solid test conducted.
In this study, 50 ml of the filtrate from the TSS test was measured and poured into an initially pre-weighted evaporating dish in order to carry out the TDS test. The sample was evaporated to dryness and the mass of the dish measured and recorded. The TDS (in mg/l) was then calculated. DREL 5 Hach conductivity meter was used in this study for the conductivity measurement. Nitrate levels in the water samples were determined using a nitrate nitrite test kit model NI-12 (cat. No. 14081-00) using a pillow of NitraVer V nitrate reagent for 5 ml sample. Phosphates were determined using a spectrophotometric method. A HACH Spectrophotometer DREL-3 was used. While sulphate concentrations was determined using gravimetric titration. Sulphate determination was done using 2 M HCl and 10% BaCl2 measuring the precipitate as BaSO4. Water velocity was measured in situ. This was measured three times by timing a float (average of three trials) as it moved over a distance of 10 metres in the middle of the channel [9] . Depth was measured in the sample area using a calibrated stick. Color in this study was measured using light with a wavelength of 455 nm.
3.3. Data Analysis
Calculation of range, mean and standard deviation for each parameter and stations were made. The data obtained were subjected to statistical analysis. Fixed effect ANOVAS were performed using data as replicates. Also, significant ANOVAS (p < 0.05) were followed by post hoc (Tukey Honest (HSD)) tests to identify differences between station means, while comparison of means were done using Tukey Honest Test [5] [10] .
4. Results
A summary of the physical and chemical parameters from the three stations of Oinyi River, Kogi State, Nigeria are given in Table 1, including the mean ± standard errors, minimum and maximum values. Results obtained from the study showed that pH (6.8 to 7.26), conductivity (106.0 to 211.7 µS/cm), colour (3.87 ± 0.159 Pt-Co), turbidity (14 - 22.7 NTU), total suspended solids (45 - 54 mg/l), biological oxygen demand (2.05 - 2.89 mg/l), chemical oxygen demand (17.19 ± 0.15 mg/l), temperature (24˚C to 27˚C) and depth (0.23 to 0.35 m) were significantly different across the different stations and between the months. However, total dissolved solids (52.7 to 108.8 mg/l), dissolved oxygen (6.02 to 7.01 mg/l), ammonium (0 to 0.02 mg∙l−1), nitrite (0.01 - 0.09 mg∙l−1), nitrate (0.045 ± 0.006 mg∙l−1), phosphate (0.2 to 2.05 mg∙l−1) and flow velocity (0.1 to 0.35 ms−1) did not differ significantly within the sampling stations. Maximum conductivity (211.7 µS/cm), colour (5.83 Pt-Co), turbidity (22.7 NTU), total suspended solids (54 mg/l), total dissolved solids (108.8 mg/l), nitrite (0.09 mg∙l−1) and nitrate (0.006 mg∙l−1) values were recorded at station 2 and all except total dissolved solids (rainy season) had their peak values in the dry season.
Furthermore, peak values of pH (7.26), dissolved oxygen (7.01 mg/l), biological oxygen demand (2.89 mg/l), chemical oxygen demand (24.87 mg/l), ammonia (0.02 mg∙l−1), temperature (27˚C) and flow (0.35 m∙s−1) were recorded at station 1. pH, biological oxygen demand, chemical oxygen demand, ammonia, and temperature were highest at the dry season whereas dissolved oxygen and flow velocity was at their peak during the rainy season.
5. Discussion
Environmental data (physical and chemical parameters) provides a clear distinction between the effluent discharge site (station 2) and those of the upstream and downstream sites (station 1 and station 3).
The temperature for the present study fluctuated between 24˚C to 27˚C in the study area, with an overall mean ± standard error temperature of 25.57˚C ± 0.32˚C. There were variations (p < 0.05) in temperature between the months and across the sampling stations. The highest temperature recorded for the study was at station 1 (27˚C). The variation in temperature observed was as a result of low solar heat radiation across the stations. Temperature values for this present study showed marked seasonal variation. Higher temperature values recorded in the dry season months in the present study are expected since heat from sunlight increases temperature of surface water. Similarly, the drop in water temperature in the wet season months is attributable to heavy rainfall experienced during the study period. This corroborates the works of [11] for Nkoro River, Niger Delta Nigeria and not in conformity with the reports of [10] who reported low temperature in the wet season months for Kontagora Reservoir, Niger State, Nigeria.
pH values fluctuated between 6.8 to 7.24 which were within the FEPA recommended standard for aquatic life (6 - 9) and not in conformity with the previous range of 5.51 - 5.65 documented by [12] for Oinyi River. Thus

Table 1. Environmental factors measured at the sampling stations of Oinyi River (October 2010 to September 2011) showing habitat quality, including physico-chemical parameters for water samples.
Note: the maximum and minimum values are given in parenthesis. Means with * are significantly different across stations while those with ** are significantly different across the stations and between the months.
an indication that water pH from Oinyi River has increased drastically from slight acidity toward alkalinity. This sudden rise in pH could be attributed to the effects of release of untreated cement industry’s waste at station 2, which is composed mainly of calcium carbonate [13] . Hydroxide carbonates, and bicarbonates are the dominant sources of natural alkalinity. Also, the similar increase recorded at stations 1 and 3 may be attributed to the unprecedented increase in the anthropogenic activities along the water body. Approximately closer pH values (7.04 - 7.14) were recorded by [10] for Kontagora Reservoir, Niger State, North Central Nigeria and a more similar pH range of 6.65 - 7.45 was reported by [14] for some rivers and streams at Ile-Ife. The water pH values for all stations were identical. Similar pH for all stations of study including the Industrial zones, have been reported by [15] for two rivers in Ibadan, Nigeria; however, [16] recorded that the pH of the upstream water sample did not vary from the pH of the downstream but both varied from the pH of the discharge point of paper mill effluent on Owerrinta River, in Eastern Nigeria. The pH values recorded for the study may be attributed to the similarity in effluent composition at station 2 (calcium carbonates) and the soil content of station 1 and station 3 plus the degree of similarity in human activities in all stations. River water did not show any signs of recovery since the same factors work to trigger the increase in pH value for all station. These values showed significant variation (p < 0.05) across the stations and between the months of study.
In the present study, dissolved oxygen was significantly different (p < 0.05) across the sampling stations and between the study months with the mean ± standard error value 6.63 ± 0.09 mg/l (6.4 - 7.01 mg/l), 6.11 ± 0.02 mg/l (6.02 - 6.17 mg/l) and 6.39 ± 0.05 mg/l (6.3 - 6.6 mg/l) for stations 1, 2 and 3 respectively while the overall mean ± standard error value was 6.38 ± 0.05 mg/l. Station 2 had the lowest concentration levels for dissolved Oxygen while stations 1 and 3 had higher concentrations. The reduction in concentration of dissolved oxygen observed at station 2 (discharge point) could be attributed to the depletion of the dissolved oxygen owing to the enormous amount of organic materials discharged into this station requiring high levels of oxygen for chemical oxidation, decomposition or break down by microbial organisms. This corroborated reports by [17] that worked on Awba Stream and Reservoir, and [5] who carried out the research on Adofi River. However, the plausible reason for high dissolved oxygen in stations 1 and 3 could be attributed to the large surface area of the sampling stations and the less impact of organic waste in the stations as compared to that of station 2. [18] also recorded similar trends for Awba Reservoir.
Results also showed that the turbidity values of water sample varied significantly (p < 0.05) across the sampling station and between the months with a mean ± standard error turbidity value of 15.38 ± 0.13, 22.44 ± 0.11 and 14.44 ± 0.16 NTU recorded for stations 1, 2 and 3 respectively. As shown in Table 1, the turbidity value was highest at station 2 which is the effluent discharge point, lowest at the upstream and downstream stations (stations 1 and 3 respectively). This rise in turbidity may be attributed to the presence of material related to municipal, industrial or other discharges which produce turbidity and present in the untreated cement effluent. This corroborated the report of [5] on Adofi River.
The biochemical oxygen demand (BOD5) recorded in the study was significantly different (p < 0.05) across the sampling stations and between the months. BOD5 values ranged from 2.05 - 2.89 mg/l throughout the study with a mean ± standard error value of 2.80 ± 0.03 (2.7 - 2.89) mg/l, 2.70 ± 0.03 (2.6 - 2.78) mg/l and 2.14 ± 0.03 (2.05 - 2.23) mg/l for station 1, 2 and 3 respectively. Results recorded for the present study indicates that the BOD5 values of the different stations took the following trend: station 1 > station 2 > station 3. Based on BOD5 classification: unpolluted (BOD < 1.0 mg∙L−1), moderately polluted (BOD between 2 - 9 mg∙L−1) and heavily polluted (BOD > 10 mg∙L−1) [19] -[21] , Oinyi River was regarded as a moderately polluted river throughout the study period. The trend above implied possible rise in BOD5 is probably due to discharges from drainages that empty into the river and other human activities.
There was significant variation (p < 0.05) in COD across the different stations and between the study months. Chemical oxygen demand values varied from 12.8 to 24.87 mg/l in Oinyi River. The highest value (24.87 mg/l) was recorded at station 1 and the lowest at station 3. The overall mean ± standard error COD for the study was 17.19 ± 0.15 mg/l. The fluctuation pattern in COD values is in the following other with regards to sampling stations: station 1 > station 2 > station 3. This implied that COD may not be as a result of the contributory effects of chemicals but as a result of the high presence of inorganic substances in water and also the activities of micro-organisms which decomposes the massive inflow of organic waste brought about by wind and run off.
The total suspended solid values obtained at station 2 (54 mg/l) (discharge point) was higher than that of station 1 (48 mg/l) and station 3 (51.6 mg/l). TSS value was significantly different (p < 0.05) across the sampling stations and between the months throughout the study. The slight varying value for all stations and thus, closer mean values of stations 1 and 3 indicate turbulence, and the higher values of total suspended solid for station 2 were indicative of industrial pollution at its onset. Similar trends were reported for Ona and Alaro Rivers in Ibadan by [15] . In addition, the unprecedented increase in TSS for station 2 could also be due to the fact that cement effluent discharged into river are usually untreated and contain organic and inorganic compounds, and/ or micro-organisms.
The total dissolved solid fluctuated between 52.7 to 108.8 mg/l for this study. Results showed a significant variation (p < 0.05) across the sampling sites and no differences (p > 0.05) for the sampling months. Stations 1 and 3 had similar TDS values when compared with the results for station 2. This similarity in the upstream and downstream areas, from the discharge point, indicates possible pollutional effects posed by the cement industry’s waste water to the receiving water body. This rise in total dissolved solid value at station 2 may be due to inorganic materials such as rocks which forms the basement of the river and the presence of calcium bicarbonate as a byproduct of cement industry’s waste.
The electrical conductivity of water sample varied significantly (p < 0.05) across the sampling stations and between the months, and ranged from 106.6 μs/cm to 211.7 μs/cm throughout the period of study. Higher conductivity value was recorded at station 2 (211.77 μs/cm) which is the effluent discharge point. This increase of conductivity value in point of discharge of industrial effluent is similar to that recorded by [5] for point of discharge of rubber industry’s effluent. The varied differences in conductivity between the site of discharge and the upstream and downstream stations, and the similarity between the upstream and downstream stations (stations 1 and 3 respectively), indicates that there is a source of dissolved ions in the untreated cement effluent. Thus an indication of potential water quality problems.
The mean ± standard error value recorded for ammonium in this present study are 0.014 ± 0.002 (0.01 - 0.02) mg·l−1, not detected (0) and 0.008 ± 0.0026 (0 - 0.015) mg·l−1 for station 1, station 2 and station 3 respectively. Ammonium was not detected in station 2, but however, had the highest value of 0.02 mg·l−1 at station 1 in the months of October and December (dry season). Ammonium (NH4) is the ionized form of ammonia and will equilibrate with ammonia in solution. An increased ammonium-nitrogen value in water bodies is probably due to the decomposition of proteinous and nitrogen rich compounds present in the organic waste discharge. The ammonium value was however significant (p < 0.05) across the stations and not between the sampling months (p > 0.05).
The mean ± standard error nitrite value (range) was 0.013 ± 0.002 (0.01 - 0.02) mg∙l−1, 0.05 ± 0.011 (0.02 - 0.09) mg·l−1 and 0.013 ± 0.0015 (0.01 - 0.02) mg∙l−1 for station 1, station 2 and station 3 respectively. The high value recorded in station 2 may be attributed to the influence of cement waste water discharged into the water body. Also, nitrite value showed significant differences (p < 0.05) across the various stations and not between (p > 0.05) the sampling months.
There was significant variation (p < 0.05) in Nitrate across the sampling stations
and not (p > 0.05) between the months. Nitrate ion (![]() ) is the common form of nitrogen in natural
waters and it is the most highly oxidized form of nitrogen compounds is commonly
present in surface and groundwater because it is the end product of aerobic decomposition
of organic nitrogenous matter. However, the nitrate levels recorded in this study
may be due to nature occurrence and the presence of igneous rock, plant decay and
animal debris. With regards to the different sampling stations, nitrate values were
in the following trend: station 2 > station 3 > station 1. The maximum value recorded
at station 2 may be attributable to the contributory effects of cement industry’s
waste water. The river system however showed some element of recovery downstream
the point of industrial effluent discharge. This corroborated with reports of [5] [22]
.
) is the common form of nitrogen in natural
waters and it is the most highly oxidized form of nitrogen compounds is commonly
present in surface and groundwater because it is the end product of aerobic decomposition
of organic nitrogenous matter. However, the nitrate levels recorded in this study
may be due to nature occurrence and the presence of igneous rock, plant decay and
animal debris. With regards to the different sampling stations, nitrate values were
in the following trend: station 2 > station 3 > station 1. The maximum value recorded
at station 2 may be attributable to the contributory effects of cement industry’s
waste water. The river system however showed some element of recovery downstream
the point of industrial effluent discharge. This corroborated with reports of [5] [22]
.
There was significant difference (p < 0.05) across the sampling stations and no significant variation (p > 0.05) between the months for phosphate. The mean ± standard error phosphate were 0.64 ± 0.025 (0.57 - 0.73) mg∙l−1, 0.24 ± 0.02 (0.19 - 0.3) mg∙l−1, and 1.67 ± 0.14 (1.32 - 2.05) mg∙l−1 for station 1, station 2 and station 3 respectively. Station 3 recorded the highest value for phosphate during the present study (2.05 mg∙l−1). The occurrence of phosphate ions in the various sampling sites of Oinyi River is likely due to from the weathering of phosphorous baring rocks which form the basement of water body and minerals. However, the highest value recorded in which was recorded in station 3 may be attributed to agricultural runoff of fertilizers since the station is characterized by increased farming activity. This corroborated with the findings of [23] for Galma River in Zaria, Nigeria.
For flow velocity, there were no significant difference (p > 0.05) across the months but there was (p < 0.05) between the stations. It ranged from 0.16 to 0.35 m∙s−1 with an overall mean ± standard error value of 0.18 ± 0.043 m∙s−1. Station 1 had the maximum flow (0.35 m∙s−1) while station 2 had the lowest value (0.16 m∙s−1). This may be due to the fact that at station 1, there is a mini-dam and water falls vertical with near-maximum momentum.
The mean value and range recorded for water depth at each stations were 0.28 ± 0.02 (0.24 - 0.35) m, 0.27 ± 0.02 (0.23 - 0.34) m and 0.30 ± 0.03 (0.25 - 0.4) m for station 1, station 2 and station 3 respectively. There were significant differences (p < 0.05) for the depth of the sampling stations and across the months of the study. Furthermore, the depth value revealed that station 3 had the maximum value of 0.4 m and the minimum value of 0.034 at station 2. This may be attributable to the nature of the river floor at that station (station 3) and for station 2, the decrease depth may be due to the effects of sedimentation which is a product of cement factory’s waste water. Also, there was a significant difference in water depth at different stations and this can be ascribed to the nature of the riverbed, which is uneven. This corroborated with the findings of [22] .
In the present study, colour of water sample varied significantly (p < 0.05) at the different sampling stations and across the sampling months with a maximum value of 5.83 Pt-Co recorded at station 2 (point of discharge) and a minimum value of 2 Pt-Co. Similar report of high colour values at discharge point of industrial effluent was also reported by [5] for Adofi River. The increase in colour of station 2 could be attributed to the presence of high dissolved compounds in the untreated effluent discharged from the cement factory. The river water however showed drastic recovery pattern, as there was a drop in colour value at station three. This pattern of river recovering from colour impact was similar to that recorded by [5] for Adofi River. However, the system’s ability to recover could be due to the dissolution of dissolved compound into much reduced or smaller molecules.
6. Conclusion
The inference from the present study on Oinyi River, based on critical analyses of the different findings, suggests that the cement effluent discharged into the river lessened water quality with significant or corresponding effect on the biota of the studied area, thus paving way for clear assertion that the water quality deterioration was as a result of the impacts of the waste water from cement industry.
7. Recommendation
Detailed study with more stations upstream and downstream of the impacted sites is necessary to fully document changes in water quality and community structure of macroinvertebrates, and the extent and duration of such changes so as to better understand pollution processes in the river that might call for improved regulation and policy development.
References
- Lawson, E.O. (2011) Physico-Chemical Parameters and Heavy Metal Contents of Water from the Mangrove Swamps of Lagos Lagoon, Lagos, Nigeria. Advances in Biological Research, 5, 8-21.
- Ogbogu, S.S. and Olaide, S.A. (2002) Effects of Sewage Oxidation Pond Effluent on Macroinvertebrate Communities of a Tropical Forest Stream, Nigeria. Journal of Aquatic Science, 17, 22-27.http://dx.doi.org/10.4314/jas.v17i1.19906
- Akpan, A.W. (2004) The Water Quality of Some Tropical Freshwater Bodies in Uyo (Nigeria) Receiving Municipal Effluent, Slaughter-House Washings and Agricultural Land Drainage. Environmentalist, 24, 49-55.http://dx.doi.org/10.1023/B:ENVR.0000046346.93401.5c
- Arimoro, F.O. and Ikomi, R.B. (2008) Response of Macroinvertebrate Communities to Abattoir Wastes and Other Anthropogenic Activities in a Municipal Stream in the Niger Delta, Nigeria. Environmentalist, 28, 85-98.http://dx.doi.org/10.1007/s10669-007-9033-8
- Arimoro, F.O. (2009) Impact of Rubber Effluent Discharges on the Water Quality and Macroinvertebrate Community Assemblages in a Forest Stream in Niger Delta. Chemosphere, 77, 440-449.http://dx.doi.org/10.1016/j.chemosphere.2009.06.031
- Osibanjo, O. and Adie, G.U. (2007) Impact of Effluents from Bodija Abattoir on Physicochemical Parameters of Osunkaye Stream Ibadan City, Nigeria. African Journal of Biotechnology, 6, 1806-1811.
- American Public Health Association (APHA) (1992) Standard Methods for the Examination of Water and Waste Water. 19th Edition, 472.
- American Public Health Association, American Water Works Association and Water Environment Federation (APHA, AWWA and WEF) (1998) Standard Methods for the Examination of Water and Wastewater. 20th Edition, APHA, AWWA and WEF, Washington DC, 112-113.
- Gordon, N.D., Mc Mahon, T.A. and Finlayson, B.L. (1994) Stream Hydrology, an Introduction for Ecologists. John Wiley and Sons, New York, 79.
- Ibrahim, B.U., Auta, J. and Balogun, J.K. (2009) An Assessment of the Physico-Chemical Parameters of Kontagora Reservoir, Niger State, Nigeria. Bayero Journal of Pure and Applied Sciences, 2, 64-69.
- Abowei, J.F.N. (2010) Salinity, Dissolved Oxygen, pH and Surface Water Temperature Conditions in Nkoro River, Niger Delta, Nigeria. Advance Journal of Food Science and Technology, 2, 36-40.
- Obajana Cement PLC (2005) Social and Environmental Impact Assessment: Obajana Cement Project, Obajana, Kogi State, Nigeria. Executive Summary, 22.
- Egyptian Environmental Affairs Agency (EEAA) (2005) Environmental Impact Assessment Guidelines for Cement Manufacturing Plants. Ministry of State for Environmental Affairs, Environmental Management Sector, Arab Republic of Egypt, 54.
- Muhibbu-din, O.I., Aduwo, A.O. and Adedeji, A.A. (2011) Study of Physiochemical Parameter of Effluent Impacted Stream in Obafemi Awolowo University, Ile-Ife, Nigeria. A Dissertation Submitted to the Department of Zoology, Obafemi Awolowo University, Ile-Ife.
- Osibanjo, O., Daso, A.P. and Gbadebo, A.M. (2011) The Impact of Industries on Surface Water Quality of River Ona and River Alaro in Oluyole Industrial Estate, Ibadan, Nigeria. African Journal of Biotechnology, 10, 696-702.
- Emeka, I.C., Ihediohamma, E.E., Linus, N., Ndubuisi, U.C. and Ebele, A.G. (2011) Physicochemical Dynamics of the Impact of Paper Mill Effluents on Owerrinta River, Eastern Nigeria. Journal of Environmental Chemistry and Ecotoxicology, 3, 298-303.
- Adeogun, A.O. and Fafioye, O.O. (2011) Impact of Effluents on Water Quality and Benthic Macroinvertebrate Fauna of Awba Stream and Reservoir. Journal of Applied Sciences and Environmental Management, 15, 105-113.http://dx.doi.org/10.4314/jasem.v15i1.65683
- Popoola, K.O.K. and Otalekor, A. (2011) Analysis of Aquatic Insects’ Communities of Awba Reservoir and Its Physico-Chemical Properties. Research Journal of Environmental and Earth Sciences, 3, 422-428.
- Vowels, P.D. and Connel, D.W. (1980) Experiments in Environmental Chemistry. Pergamen Press, New York, 78.
- Adakole, J.A., Abulode, D.S. and Balarabe, M.L. (2008) Assessment of Water Quality of a Man-Made Lake in Zaria Nigeria. Sengupta, M. and Dalwani, R., Eds., Proceedings of Taal 2007: The 12th World Lake Conference, 1373-1382.
- Emere, M.C. and Nasiru, C.E. (2008) Macroinvertebrates as Indicators of the Water Quality of an Urbanized Stream, Kaduna Nigeria. Nature and Science, 6, 1-7.
- Arimoro, F.O., Iwegbue, C.M.A. and Enemudo, B.O. (2008) Effects of Cassava Effluent on Benthic Macroinvertebrate Assemblages in a Tropical Stream in Southern Nigeria. Acta Zoologica Lituanica, 18, 147-156.http://dx.doi.org/10.2478/v10043-008-0021-0
- Nnaji, J.C., Uzairu, A., Harrison, G.F.S. and Balarabe, M.L. (2011) Effect of Pollution on the Physico-Chemical Parameters of Water and Sediments of River Galma, Zaria, Nigeria. Research Journal of Environmental and Earth Sciences, 3, 314-320.