Journal of Environmental Protection
Vol.5 No.5(2014), Article ID:44974,8 pages DOI:10.4236/jep.2014.55043
Annoyance and Health-Related Quality of Life: A Cross-Sectional Study Involving Two Noise Sources
Daniel Shepherd1*, David McBride2, Kim N. Dirks3, David Welch3
1School of Public Health, AUT University, Auckland, New Zealand
2Department of Preventive and Social Medicine, University of Otago, Dunedin, New Zealand
3School of Population Health, The University of Auckland, Auckland, New Zealand
Email: *daniel.shepherd@aut.ac.nz, david.mcbride@otago.ac.nz, k.dirks@auckland.ac.nz, d.welch@auckland.ac.nz
Copyright © 2014 by authors and Scientific Research Publishing Inc.
This work is licensed under the Creative Commons Attribution International License (CC BY).
http://creativecommons.org/licenses/by/4.0/


Received 17 January 2014; revised 15 February 2014; accepted 13 March 2014
ABSTRACT
Noise remains a potent degrader of health in many global contexts, capable of inducing severe annoyance and sleep disturbance. An epidemiological study was undertaken to compare noise annoyance and health-related quality of life of individuals residing close to a major international airport or wind turbine complex with those located in demographically matched areas. Results indicate that domains of health-related quality of life may be degraded in those living in areas more likely to induce noise annoyance. Furthermore, the addition of aviation noise to environments already encroached by road noise may induce further annoyance and degradations in health-related quality of life, indicating that one noise sources may not mask the impact of another.
Keywords
Aviation Noise, Wind Turbine Noise, Noise Annoyance, Health

1. Introduction
Noise is an environmental nuisance that has the potential to degrade health and negatively impact the relationship between humans and their environment (i.e., amenity). At high intensities, noise can induce hearing loss. However, even at low levels, it can significantly impact health by interfering with sleep or inducing maladaptive emotional responses. Though it is desirable to protect individuals from excessive exposure to noise, modern living environments pose substantial challenges. Firstly, the most commonly-identified sources of community noise, including transportation (e.g., road, rail, aviation) and industrial noise (e.g., wind turbines), are vital components of human endeavor and viability, but are not easily silenced. Secondly, the way in which individuals respond to noise can vary within exposed populations. For example, the social context in which the noise occurs [1] , the sensitivity of an individual to noise [2] (or a combination of both), can determine whether a noise will impact an individual’s health and wellbeing. Both factors make noise control a challenge for legislators charged with nurturing public health.
The adverse impacts of noise on health other than hearing loss are sometimes referred to as non-auditory effects of noise (see [3] for a review). Such effects are deemed a sufficiently serious threat for the WHO to commission the compilation of a number of substantial documents over the past 15 years dedicated specifically to community noise [4] -[6] . In Europe, where the focus of attention has been the most direct, it is conservatively estimated that 587,000 DALYs (disability-adjusted life years) are lost each year due to community noise within urban limits [6] . Furthermore, the European Union [7] estimates that up to 30% of the European population may be exposed to unsafe levels of community noise, with an estimated economic cost of 40 billion Euros per annum. While sleep disturbance and annoyance are the dominant health consequences of community noise exposure, cardiovascular disease and cognitive impairment in children also contribute [6] .
Aircraft and wind turbine noise have long been identified as sources of annoyance-inducing noise [8] . Both contain substantial low-frequency components [8] [9] , and both pose acoustic measurement challenges that undermine current approaches to noise control and public health research e.g., [10] [11] . Consistent with the mode of transport effect [12] , aviation noise is judged as more annoying than road traffic or rail noise [13] , while wind turbine noise is consistently judged more annoying than transport noise [14] [15] . Recent population-level studies have demonstrated significant associations between aviation noise and risk of hospitalization for cardiovascular disease [16] [17] . An older study involving a meta-analysis of multiple European airport studies predicted a prevalence of severe annoyance of between 17% and 25% for aircraft noise at levels between 60 and 65 LDN [13] , while a New Zealand study reported a prevalence of 17% [18] . According to the WHO Guidelines for Community Noise [4] , outdoor noise of 55 LDN is 'seriously annoying'. As with aviation noise, wind turbine noise is judged as annoying by a large proportion of exposed individuals [15] [19] , and, as with road traffic noise [20] , this can impact health and wellbeing [21] [22] .
The quantification of the impact of noise on health and wellbeing involves methods that are neither standardized nor always agreed upon, as suggested in numerous commentaries e.g., [23] -[25] One issue centers on the conceptualization of health, and whether the WHO’s guidelines suggesting that noise impact is best measured using health-related quality of life indices is in fact valid [5] . The WHO recommendation is largely based on the fact that, unlike diseases, terminal illnesses or explicit physical insults, health impacts from noise are more insidious and covert, and difficult to disentangle from other processes impacting function. As such, and for other reasons besides, health related quality of life domains are well suited to estimating the impact of noise at the population level [25] . Furthermore, the simple relationship between noise level and human response is no longer considered a valid measurement approach to noise control [26] -[28] . Others [20] [25] suggest that noise annoyance measures may be superior “dose” metrics compared with noise level when mitigating the harmful impacts of noise.
In the current study, good health is defined as the ability of an organism to remain viable and successfully engage goal-directed behaviors within a host environment, a definition consistent with others [29] . Implicit in this definition is a dichotomization of health, embodying objectively quantifiable biomedical indices, and the more subjective measures of Health Related Quality of Life (HRQOL). Biomedical indices consist of those medical assessments that are typically mechanical, such as blood pressure or heart rate, or biochemical, such as cortisol levels. These can be considered absolute measures, and either in a linear or nonlinear fashion, be thought to represent the quantity of health (e.g., life expectancy or domain capacity) [30] . The HRQOL measures might be considered relative measures, as they are referenced to “the context of the culture and value systems in which he/she lives, and in relation to his/her goals, expectations, standards and concerns.” [31] , and as such can represented as a broader and more idealistic approach to health (i.e., wellbeing, or the quality of health). Note that dichotomizing health in this way is entirely consistent with that formulated by the WHO on its inception: “Health is a state of complete physical, mental and social well-being and not merely the absence of disease or infirmity”.
When examining the impact of aviation noise on health, the biomedical paradigm predominates e.g., [16] [17] , while few studies have utilized HRQOL measures [but see Shepherd / Black]. As a relatively new sound source, the HRQOL approach dominates the wind turbine noise and health literature [21] -[33] . The current study adds to the existent literature by reporting much needed HRQOL data in the aviation noise context, and providing additional data in the wind turbine noise context. Pertinently, to further elucidate the relationship between noise exposure and health, the study relates noise-induced annoyance to HRQOL in both urban (aviation noise) and rural (wind turbine noise) samples. We hypothesize that those residing in areas predisposed to inducing noise-annoyance will have lower HRQOL scores than matched samples in areas expected to induce lower levels of noise annoyance.
2. Methods
2.1. Participants
Participants resided in Wellington, the capital city of New Zealand, either centrally (the “Airport” and “City” samples) or on the extreme periphery (the “Turbine” and “Greenbelt” samples). The Airport sample (n = 87) resided within 250 meters of Wellington’s International Airport’s runway, whilst the City sample (n = 91) consisted of residents living on the city’s urban border, and displaced from the airport’s main flight path. The Airport and City samples were socioeconomically matched using the New Zealand Deprivation Index [34] , as were the Turbine and Green belt samples. The Turbine sample (n = 29) lived in the Makara Valley, a small semi-rural settlement 10 km west of Wellington central, while the Greenbelt sample (n = 41) resided in a semi-rural area at least 10 km from a turbine installation. The Makara area hosts sixty-six 125-metre-high wind turbines, and residences selected for inclusion were within two kilometers of a wind turbine. Table 1 presents the demographic profiles associated with each of the four samples.
2.2. Instruments
Two copies of a survey entitled “Wellbeing and Neighborhood Survey” were hand delivered to targeted residences, along with a pre-paid, pre-addressed mail envelope. The survey contained several questions probing the participant’s personal characteristics (see Table 1), the WHO’s brief quality of life survey (WHOQOL-BREF), two items on neighborhood amenity, and seven items probing environmental nuisances. The WHOQOL-BREF yields four HRQOL domains: Physical Health (7 items), Psychological Well-being (6 items), Social Relationships (3 items), and Environmental Amenity (8 items). Higher scores indicate higher HRQOL. Participants are presented with Likert-type scale items and asked to respond on a five-point scale as to how satisfied or dissatisfied they are with aspects of their health. The two amenity questions were also presented on five-point Likert-type scales; one was positively worded and the other negatively, and after the latter’s reverse-coding, summed to give a total score. Environmental nuisances included questions probing annoyance due to air pollution (“air pollution from traffic”, “air pollution from household chimneys”, “other, specify”) and noise (“noise from traffic”, “noise from other neighbors”, “other noise, specify”). These were presented on a five-point scale ranging from “not annoyed at all” to “extremely annoyed”.
2.3. Statistical Analyses
Analysis was conducted separately for the two matched pairs of data: Airport-City, and Turbine-Greenbelt. For the Airport-City data, the main focus was on the additive effects of transport-related noise annoyance to HRQOL. It was expected that, as purposely selected, the two areas would not differ in mean annoyance to road transport noise or pollution, but would differ considerably in response to annoyance to “Other (please specify:)” noise or pollution sources. Independent samples t-tests were carried out to indicate if the two matched areas differed in their mean WHOQOL-BREF and Amenity scores. Preliminary tests assessing the degree of matching between the two areas were undertaken, and where significant differences were found, covariates included. For the Turbine-Greenbelt comparisons, nonparametric alternatives (e.g., Mann Whitney U) were employed due to the expected violations of parametric testing assumptions.
2.4. Ethical Approval
Institutional review and ethical approval was obtained from the AUT University Ethics Committee.

Table 1. Demographic profiles of the four areas. Chi-square (χ2) tests indicate the quality of matching across the airport and city areas, or the turbine and greenbelt areas.
* p < 0.05. +NS Noise Sensitivity; **Note that totals may differ due to missing data.
3. Results
3.1. Airport versus City Samples
As anticipated, there were no significant differences found in annoyance in relation to traffic-related air pollution (F(174, 1) = 1.21, p = 0.228) or noise (F(174, 1) = 1.575, p = 0.117) between the two samples. However, for annoyance to “Other”, sources of air pollution (F(114, 1) = 2.981, p = 0.004) and noise (F(105, 1) = 2.388, p = 0.019), significant differences were noted. The open-ended responses required from participants selecting the “Other” category revealed that, for the air quality item, all but one respondent in the Airport sample indicated aircraft-related fumes, as opposed to no such response from those in the City sample. For the noise case, only one respondent indicated aircraft-related noise in the city sample, while all but two from the Airport sample failed to make such a reference.
The top panel in Figure 1 presents mean WHOQOL-BREF domain scores and the total amenity score, transformed to z-scores, for both the Airport and City sample. Significant differences were noted between the Physical Health (F(166, 1) = 5.109, p = 0.025) and Environmental (F(166, 1) = 7.806, p = 0.006) WHOQOL domains, and Amenity (F(173, 1) = −2.082, p = 0.039), but not the Psychological (F(170, 1) = 3.173, p = 0.077) or Social (F(169, 1) = 0.98, p = 0.755) WHOQOL domains.
3.2. Turbine versus Greenbelt Samples
In terms of differences in the mean self-report annoyance to environmental nuisances, non-significant results were obtained for annoyance to traffic-related air pollution, other sources of air pollution, and traffic-related noise (all p > 0.2). Only for mean annoyance to “Other” noise sources was there a statistically significant difference between the Turbine and Greenbelt sample (U(n1 = 20, n2 = 29) = 144.500, p < 0.001), even when controlling for age (F(48, 1) = 15.438, p < 0.001). Of those specifying annoyance to “Other” noise sources, all from the Turbine sample indicated the annoying noise came from wind turbines, while those in the Greenbelt sample in-
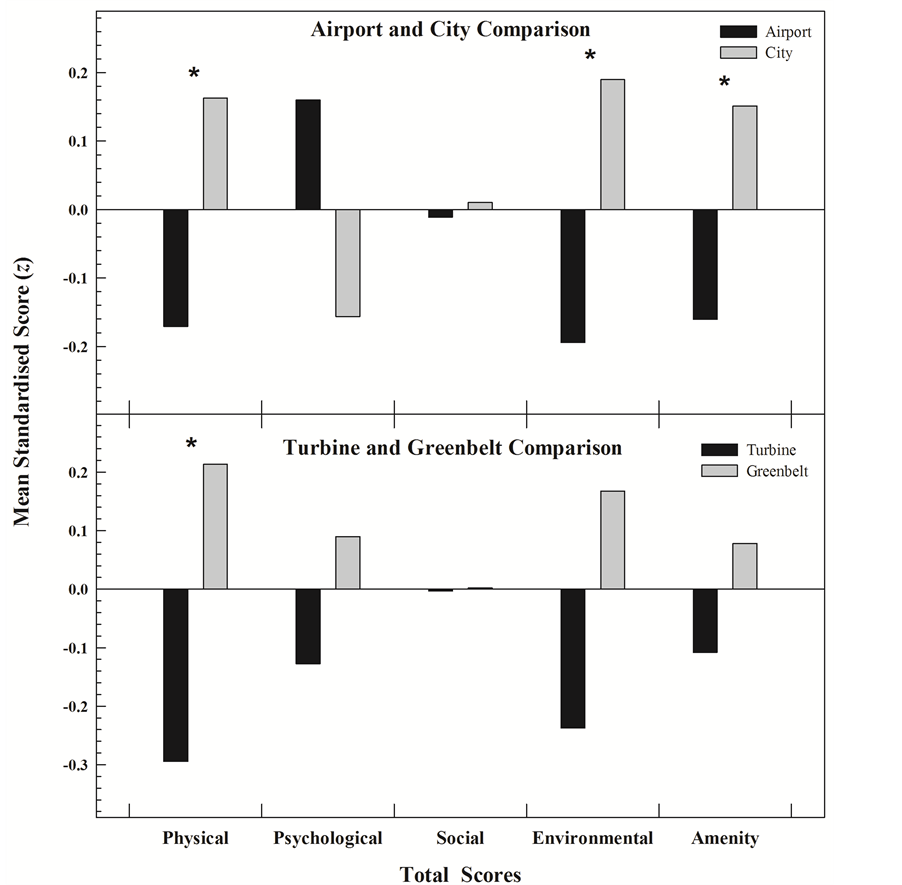
Figure 1. Plot displaying the mean standardized WHOQOL domain scores and amenity total scores for the Airport and City areas (upper panel) and the Turbine and Greenbelt areas (lower panel). Greater mean scores indicate better health-related quality of life or amenity relative to lower scores..
dicated gunshots, chainsaws, and barking dogs.
The mean standardised WHOQOL-BREF domain scores and total amenity scores are displayed in Figure 1 (bottom panel) for both the Turbine and Greenbelt samples. For these comparisons, only the WHOQOL’s Physical domain reached statistical significance (U(n1 = 29, n2 = 40) = 414.000, p = 0.043), with all other WHOQOL domains and the total amenity score failing to reach significance (p > 0.05). Repeating the analysis using parametric testing, with the inclusion of age as a covariate, does not change the pattern of results (e.g., for the physical domain: F(1,68) = 4.489, p = 0.038)).
4. Discussion
The current study examines the relationship between noise-induced annoyance and HRQOL, specifically examining areas with similar mean annoyance ratings to traffic noise, but statistically different ratings to either aviation (Airport vs. City samples) or wind turbine (Turbine vs. Greenbelt samples) noise. In keeping with previous studies undertaken as a part of a series [21] [33] [35] , the results indicate that demographically-matched areas, either through sampling strategy or statistical corrections, differing in soundscapes are associated with statistically significant differences in mean HRQOL domain scores. These findings are not unexpected given the WHO (4,5,6) declarations that noise-induced annoyance and sleep disturbance can, when chronic, compromise positive wellbeing and quality of life.
Our findings of significant differences in HRQOL between those residing in the proximity of a major airport versus those in a matched area support previous research undertaken in Australia [32] . Accounting for important confounding variables and using the short-form health survey (SF-36) as a measure of HRQOL, Black et al., [32] reported that mean physical functioning, general health, vitality, and mental health scores in a group exposed to aviation noise were significantly lower than a matched control group. Such a finding would be expected if aviation noise interfered with human biological processes such as sleep or cardiac function, and such impacts are now generally accepted [5] [6] .
While our data concur with that of Black et al., [32] in terms of differences in physical health between exposure and control areas, they additionally report differences in the SF-36 mental health domain, a finding not replicated in our analysis. This divergence could potentially be explained by differences in HRQOL instruments, population characteristics, or respective sample sizes and thus statistical power. On the latter point it is noted that Black’s study contained 750 participants per group, and though the sample sizes in our study were much smaller, the p-value for the WHOQOL’s psychological domain was still close to significance (p = 0.077). Alternatively, the lack of significance in the psychological wellbeing domain echoes seminal research [36] using the WHO’s General Health Questionnaire, a screening instrument for psychiatric disorders, particularly for anxiety and depression. Another study focusing on aircraft noise exposure found no evidence of a link between baseline noise level and mental health disorders [37] .
The analysis also uncovered differences between the Airport and City groups for the two composite variables estimating how the immediate living environment directly contributes to creating a stress-free and healthy existence (the WHOQOL environmental domain) and to what degree it is considered restorative (the total amenity score). Studies on aviation noise and its impacts on amenity have yet to reported, but explanations as to why a negative correlation should exist can be found in relation to other noise sources [33] . Humans relate to environments on an emotional level by interpreting the sensory information afforded by their landscapes and soundscapes (bottom-up), and by the memories triggered by these stimuli (top-down). In particular, landscape and soundscape characteristics mark an environment as a desirable or undesirable place to occupy, as uniquely judged by the individual. Localities hosting stressors tend to induce negative emotions, and motivate an avoidance response (the so called defensive motivation system), while localities free from stressors may induce positive emotions and motivate an approach response (the appetitive motivation system). Generally, people are motivated to seek places that minimize stress and maximize restoration. Thus, when a living environment hosts a stressor such as noise, then the utility afforded by that environment is likely to be rated low by its occupants.
Significant differences in the WHOQOL physical domain between the Turbine group and the Greenbelt group concur with a previous study undertaken in these two areas in 2011 [21] , and the longitudinal aspects of these two data sets have been considered elsewhere [38] . Epidemiological evidence has convincingly demonstrated that wind turbine noise is a stressor with the potential to induce severe annoyance, and a source of noise readily able to disrupt sleep [15] [19] [21] [22] . Thus the same mechanisms that impair health for other common sources of noise, including transportation and industrial noise, are likely to account for the impacts of wind turbine noise on health and wellbeing. The lack of significance in the psychological and social domains of the WHOQOL were also noted and commented on in the 2011 study [21] , though the lack of significance in the environmental domain and the amenity score in the present study was not anticipated. Reference to Figure 1 indicates that the trend was in the expected direction (i.e., Greenbelt area with higher scores), but the criterion for statistical significance was not satisfied, possibly due to less sensitive nonparametric tests deployed due to sample-size considerations.
Several limitations of the study impact interpretability of results. The design is cross-sectional and so causality, or lack of, cannot be inferred. Further, the sample sizes were modest and thus the research can best be described as exploratory in nature, though it does echo the results of previous studies using much larger sample sizes [32] [33] . The use of a single item to estimate noise sensitivity may be considered problematic, but this variable was not needed in the analysis and studies suggest that problems arise only when conducting telephone interviews [39] . Lastly, the study focused on the relationship between noise annoyance and HRQOL, and not noise level and HRQOL. The use aggregated noise metrics is a matter of ongoing debate [28] , and while other objective metrics have been proposed e.g., [10] , practice, standards, and legislation have yet to adopt them. Indeed, as it is people, and not noise level meters, that exhibit the response to noise, then arguably strategies that reduce annoyance as opposed to noise may yet provide the most effective approaches to public health guardianship.
Acknowledgements
We would like to thank Ms. Jay Kumar for data collation and preliminary analyses.
References
- Job, R.F.S. (1988) Community Response to Noise: A Review of Factors Influencing the Relationship between Noise Exposure and Reaction. Journal of the Acoustical Society of America, 83, 991-1001. http://dx.doi.org/10.1121/1.396524
- Stansfeld, S.A., Clark, C.R, Jenkins, L.M. and Tarnopolsky, A. (1985) Sensitivity to Noise in a Community Sample: I. The Measurement of Psychiatric Disorder and Personality. Psychological Medicine, 15, 243-254. http://dx.doi.org/10.1017/S0033291700023527
- Basner, M., Babisch, W., Davis, A., Brink, M., Clark, C., Janssen, S. and Stansfeld, S. (2013) Auditory and Non-Auditory Effects of Noise on Health. Lancet. http://dx.doi.org/10.1016/S0140-6736(13)61613-X
- Berglund, B., Lindvall, T. and Schwela, D.H. (1999) World Health Organisation Guidelines for Community Noise. WHO, Geneva.
- World Health Organisation (2009) Night Noise Guidelines for Europe. World Health Organisation, Copenhagen.
- World Health Organization (2011) Burden of Disease from Environmental Noise. World Health Organization, Bonn, Geneva.
- European Union (2000) Unsafe Levels of Noise in Europe. https://osha.europa.eu/en/publications/reports/6905723
- Berglund, B., Hassmen, P. and Job, R.F.S. (1996) Sources and Effects of Low-Frequency Noise. Journal of the Acoustical Society of America, 99, 2985-3002. http://dx.doi.org/10.1121/1.414863
- Sheppard, K.P. and Hubbard, H.H. (1990) Physical Characteristics and Perception of Low Frequency Noise from Wind Turbines. Noise Control Engineering, 36, 5-15.
- Fidel, S., Tabachnick, B., Mestre, V. and Fidel, L. (2013) Aircraft Noise-Induced Awakenings Are More Reasonably Predicted from Relative than from Absolute Sound Exposure Levels. Journal of the Acoustical Society of America, 134, 3645-3653. http://dx.doi.org/10.1121/1.4823838
- Møller, H. and Pedersen, C.S. (2011) Low-Frequency Noise from Large Wind Turbines. Journal of the Acoustical Society of America, 129, 3727-3744. http://dx.doi.org/10.1121/1.3543957
- Lambert, J., Champelovier, P. and Vernet I. (1998) Assessing the Railway Bonus: The Need to Examine the “New Infrastructure” Effect. Proceedings of the Inter-Noise 98—The International Congress on Noise Control Engineering: Sound and Silence: Setting the Balance, Christchurch, 4-8.
- Miedema, H.M.E. and Oudshoorn, C.G.M. (2001) Annoyance from Transportation Noise: Relationships with Exposure Metrics DNL and DENL and Their Confidence Intervals. Environmental Health Perspectives, 109, 409-416. http://dx.doi.org/10.1289/ehp.01109409
- Bakker, R.H., Pedersen, E., van den Berg, G.P., Stewart, R.E., Lok, W. and Bouma, J. (2012) Impact of Wind Turbine Sound on Annoyance, Self-Reported Sleep Disturbance and Psychological Distress. Science of the Total Environment, 425, 42-51. http://dx.doi.org/10.1016/j.scitotenv.2012.03.005
- Pedersen, E. and Persson Waye, K. (2004) Perception and Annoyance Due to Wind Turbine Noise: A Dose-Response Relationship. Journal of the Acoustical Society of America, 116, 3460-3470. http://dx.doi.org/10.1121/1.1815091
- Correia, A.W., Peters, J.L., Levy, J.I., Melly, S. and Dominici, F. (2013) Residential Exposure to Aircraft Noise and Hospital Admissions for Cardiovascular Diseases: Multi-Airport Retrospective Study. British Medical Journal, 347, Article ID: f5561. http://dx.doi.org/10.1136/bmj.f5561
- Hansell, A.L. (2013) Aircraft Noise and Cardiovascular Disease Near Heathrow Airport in London: Small Area Study. British Medical Journal, 347, Article ID: f5432. http://dx.doi.org/10.1136/bmj.f5432
- Shepherd, D., Welch, D., Dirks, K.N. and Mathews, R. (2010) Exploring the Relationship between Noise Sensitivity, Annoyance and Health-Related Quality of Life in a Sample of Adults Exposed to Environmental Noise. International Journal of Environmental Research and Public Health, 7, 3579-3594. http://dx.doi.org/10.3390/ijerph7103580
- Van den Berg, G.P., Pedersen, E., Bouma, J. and Bakker, R. (2008) Project WINDFARMperception Visual and Acoustic Impact of Wind Turbine Farms on Residents. FP6-2005-Science-and-Society-20, Specific Support Action Project No. 044628, Final Report, University of Groningen, Groningen.
- Dratva, J., Zemp, E., Dietrich, D.F., Bridevaux, P.O., Rochat, T., Schindler, C. and Gerbase, M.W. (2010) Impact of Road Traffic Noise Annoyance on Health-Related Quality of Life: Results from a Population-Based Study. Quality of Life Research, 19, 37-46. http://dx.doi.org/10.1007/s11136-009-9571-2
- Shepherd, D., McBride, D., Welch, D., Dirks, K.N. and Hill, E. (2011) Evaluating the Impact of Wind Turbine Noise on Health-Related Quality of Life. Noise and Health, 13, 333-339. http://dx.doi.org/10.4103/1463-1741.85502
- Nissenbaum, M.A., Aramini1, J.J. and Hanning, C.D. (2012) Effects of Industrial Wind Turbine Noise on Sleep and Health. Noise and Health, 14, 237243. http://dx.doi.org/10.4103/1463-1741.102961
- Lercher, P. (1996) Environmental Noise and Health: An Integrated Research Perspective. Environment International, 22, 117-129. http://dx.doi.org/10.1016/0160-4120(95)00109-3
- Lercher, P. (2003) Which Health Outcomes Should Be Measured in Health Related Environmental Quality of Life Studies? Landscape and Urban Planning, 65, 63-67. http://dx.doi.org/10.1016/S0169-2046(02)00238-4
- Shepherd, D. (2013) Sound Mind in a Sound Body: Health in the Noise Context. Proceedings of the 42nd International Congress and Exposition on Noise Control Engineering, Innsbruck, 15-18 September 2013,
- Brown, A.L. (2012) A Review of Progress in Soundscapes and an Approach to Soundscape Planning. International Journal of Acoustics and Vibration, 17, 73-81.
- Fidell, S. (2003) The Schultz Curve 25 Years Later: A Research Perspective. Journal of the Acoustical Society of America, 114, 3007-3015. http://dx.doi.org/10.1121/1.1628246
- Zwicker, E. and Fastl, H. (1999) Psychoacoustics: Facts and Models. 3rd Edition, Springer, Heidelberg.
- Huber, M., Knottnerus, J.A., Green, L., Van der Horst, H., Jadad, A.R. and Kromhout, D. (2011) How should We Define Health? British Journal of Medicine, 343, Article ID: d4163, http://dx.doi.org/10.1136/bmj.d4163
- Salomon, J.A., Mathers, C.D., Chatterji, S., Sadana, R., Ustun, T.B. and Murray, C.J.L. (2003) Quantifying Individual Levels of Health: Definitions, Concepts, and Measurement Issues. In: Murray, C.J.L. and Evans, D.B., Eds., Health Systems Performance Assessment: Debates, Methods and Empiricism, World Health Organization, Geneva, 900.
- Skevington, S.M., Lotfy, M. and O’Connell, K.A. (2004) The World Health Organization’s WHOQOL-BREF Quality of Life Assessment: Psychometric Properties and Results of the International Field Trial—A Report from the WHOQOL Group. Quality of Life Research, 13, 299-310. http://dx.doi.org/10.1023/B:QURE.0000018486.91360.00
- Black, D.A., Black, J.A., Issarayangyun, T. and Samuels, S.E. (2007) Aircraft Noise Exposure and Resident’s Stress and Hypertension: A Public Health Perspective for Airport Environmental Management. Journal of Air Transport Management, 13, 264-276. http://dx.doi.org/10.1016/j.jairtraman.2007.04.003
- Shepherd, D., Welch, D., Dirks, K.N. and McBride, D. (2013) Do Quiet Areas Afford Greater Health-Related Quality of Life than Noisy Areas? International Journal of Environmental Research and Public Health, 10, 1284-1303. http://dx.doi.org/10.3390/ijerph10041284
- Ministry of Health (2006) New Zealand Deprivation Scores. http://www.moh.govt.nz/moh.nsf/indexmh/dhb-maps-and-background-information-atlas-of-socioeconomic-deprivation-innz-nzdep2006
- Welch, D., Shepherd, D., Dirks, K.N., McBride, D. and Marsh, S. (2013) Road Traffic Noise and Health-Related Quality of Life: A Cross Sectional Study. Noise and Health, 15, 224-230. http://dx.doi.org/10.4103/1463-1741.113513
- Tarnopolsky, A., Barker, S.M., Wiggins, R.D. and McLean, E.K. (1978) The Effect of Aircraft Noise on the Mental Health of a Community Sample: A Pilot Study. Psychological Medicine, 8, 219-233. http://dx.doi.org/10.1017/S0033291700014276
- Stansfeld, S., Gallacher, J., Babisch, W. and Shipley, M. (1996) Road Traffic Noise and Psychiatric Disorder: Prospective Findings from the Caerphilly Study. British Medical Journal, 313, 266-267.
- McBride, D., Shepherd, D., Welch, D. and Dirks, K.N. (2013) A Longitudinal Study of the Impact of Wind Turbine Proximity on Health Related Quality of Life. Proceedings of the 42nd International Congress and Exposition on Noise Control Engineering, Innsbruck, 15-18 September 2013.
NOTES

*Corresponding author.