Journal of Environmental Protection
Vol. 3 No. 8A (2012) , Article ID: 21777 , 9 pages DOI:10.4236/jep.2012.328098
Growth Kinetics of Wildlife E. coli Isolates in Soil and Water
![]()
Biological and Agricultural Engineering Department Texas A&M University, College Station, USA.
Email: *karthi@tamu.edu
Received June 2nd, 2012; revised July 3rd, 2012; accepted August 1st, 2012
Keywords: bacteria; fecal contamination; TMDL; water quality
ABSTRACT
Bacteria are the major cause of surface water contamination in the United States. US Environmental Protection Agency (USEPA) uses the Total Maximum Daily Load (TMDL) process to regulate the E. coli loads from fecal sources in a watershed. Different point and non-point sources can contribute to the fecal contamination of a waterbody including municipal and on-site wastewater treatment plants, livestock, birds, and wildlife. Unfortunately, wildlife sources in many rural watersheds are poorly characterized. E. coli is also known to persist in waterbodies when no known fecal sources are present. In this study, E. coli from wildlife fecal material was enumerated and the fate of E. coli under different environmental factors was studied. No growth was observed in soil at 4% moisture content and in water at 10˚C. The highest E. coli growth was recorded in water at 30˚C. It can be seen from these results that there was variation in the fate of E. coli under different environmental conditions. The fate of E. coli in the environment is a complex process and is influenced by many factors and their interactions, making it difficult to predict. The findings from this study along with additional studies can be used to improve the accuracy of model predictions to estimate the E. coli loads in watersheds.
1. Introduction
The leading cause of impairment for waterbodies in the United States is from bacteria [1]. Bacterial impairment of rivers and streams originates from fecal contamination. Wastewater effluents and fecal material from both livestock and wildlife are potential sources of fecal contamination in a watershed. Warm-blooded mammals shed pathogenic bacteria in their feces. Pathogenic bacteria such as Salmonella typhi, Shigella, Campylobacter jejuni, and Escherichia coli (E. coli) O157:H7 are responsible for waterborne diseases that include typhoid fever, dysentery, campylobacteriosis, and E. coli O157:H7 infection, respectively. These illnesses can include symptoms of diarrhea, fever, nausea, vomiting, and abdominal cramps. Few of these symptoms can last for days and even lead to death in immune-compromised individuals [2]. E. coli is the current indicator organism for fecal contamination and used by the Environmental Protection Agency (EPA) to assess bacterial impairment in waterbodies. In 2008, 405 streams in Texas were bacterially impaired according to the 303(d) list of impaired waterbodies in the United States [3].
Under sub-tropical and temperate environments E. coli has been observed to persist [4-8]. Sources of E. coli in a waterbody are not only external sources but also in situ. Specifically, sediments have been found to be reservoirs of enteric bacteria, including E. coli, and a potential source in waterbodies [4-13]. Environmental controls have been shown to have a role in sustaining E. coli populations in the environment [14-16].
The trends of E. coli survival in variety of waterbodies including lake, river, sea, and creek have been studied [17-24]. Temperature is suggested to be the most important factor that affects bacterial survival in water [18]. The survival and growth rate of E. coli in river water can be affected by temperature differently. Hendricks (1972) observed a higher growth rate of E. coli in river water at 30˚C than at lower temperatures. However, Flint (1987) observed the survival of E. coli in river water was less at 30˚C than at 4˚C and 25˚C. Filip et al. (1988) also observed longer survival of E. coli at lower temperatures. They reported E. coli survived for 100 days in groundwater at 10˚C [19]. Additionally, Padia (2010) found that E. coli survival in creek water was the highest at 20˚C compared to E. coli survival at 0˚C, 10˚C, and 50˚C over a period of one-week.
Growth and survival of E. coli in soil is affected by moisture content [6,8,14-16,25,26]. Change in soil moisture content from dry to saturated conditions was found to promote the growth of E. coli in soil [6,8]. At dry soil conditions, the E. coli die-off was observed to be faster than saturated soil moisture conditions [25]. Sjogren (1994) set-up laboratory soil microcosms and observed that the survival of E. coli was the longest when soil was under saturated moisture conditions, lasting up to 23.3 months.
Water quality and watershed modeling tools such as Spatially Explicit Load Enrichment Calculation Tool (SELECT), Hydrological Simulation Program-Fortran (HSPF), and Soil and Water Assessment Tool (SWAT) are used in the bacterial Total Maximum Daily Load (TMDL) process to characterize E. coli sources in a watershed and estimate the required reductions in E. coli loads [27-30]. In rural watersheds, wildlife can contribute a majority of the fecal pollution and should be considered [31]. Unfortunately, E. coli concentrations present in wildlife fecal material are not well documented. Watershed modeling tools incorporate environmental factors to estimate E. coli loads in a watershed but more data are needed [32].
The main objective of this research was to study the fate of E. coli isolates from wildlife fecal material in water at different temperatures and in soil at different moisture conditions. The specific objectives were to 1) enumerate and obtain isolates from wildlife species’ fecal material; 2) determine kinetic characteristics of E. coli isolates enumerated from feral hog and deer fecal material in water at different temperatures; and 3) determine kinetic characteristics of E. coli isolates enumerated from feral hog and deer fecal material in soil at different soil moisture conditions.
2. Study Area
Cedar Creek watershed is located in East Central Texas, USA, within both Brazos and Robertson County (Figure 1).
Cedar Creek is one of the 405 impaired water bodies in Texas that does not meet the bacteria criteria for the state [3]. It also is categorized as 5c which requires additional data and information for a TMDL to be scheduled by the Texas Commission on Environmental Quality (TCEQ). There is very little urban influence in Cedar Creek. The land use is mainly rangelands and forested areas (Table 1). Direct fecal deposition from cattle, wildlife, and birds along with other nonpoint sources contribute to the fecal contamination of the creek.
3. Methodology
3.1. Sampling Protocol
Two sub-watersheds within Cedar Creek watershed were
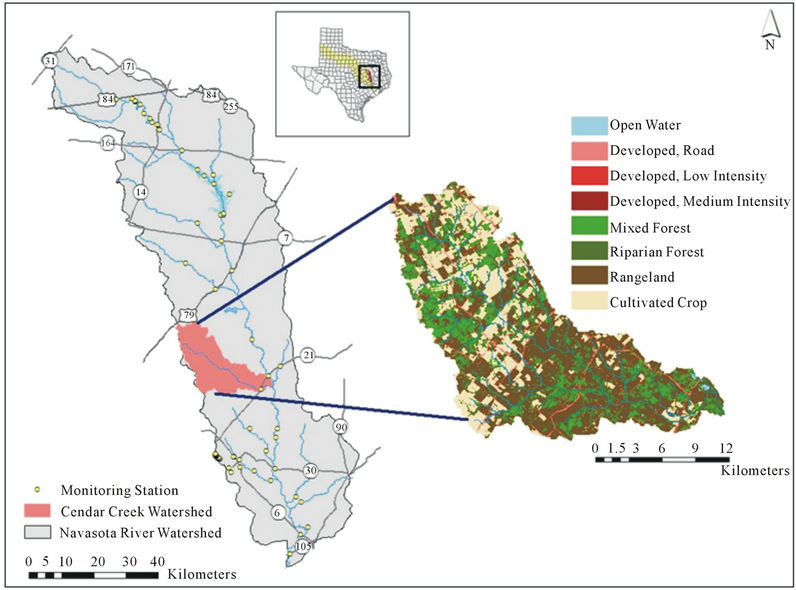
Figure 1. Location of Cedar Creek Watershed in central Texas.
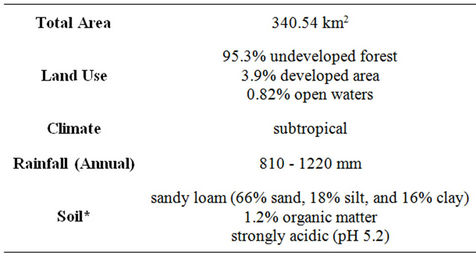
Table 1. Cedar creek watershed characteristics.
used for sampling with landowner co-operation. The land use of the sub-watersheds is mainly rangeland. The sampling protocol for obtaining the fecal material included a grid-design for trapping the wildlife. A wildlife expert designed the protocol for trapping and collecting the fecal material. The wildlife species trapped included raccoon, opossum, feral hog, deer, skunk, and armadillo. A more detailed description of sampling protocol is discussed in [24]. Briefly, once the wildlife species were trapped the fecal material was collected using sterile Whirl-Pak® bags while wearing latex gloves. The sex, age, date of trapping, and location were recorded. The samples were transported in an insulated cooler on ice at 5˚C to the Water Quality Engineering Laboratory at Texas A & M University.
3.2. Isolating E. coli from Wildlife Fecal Samples
The fecal samples were brought to the lab and kept frozen at −20˚C until processed. When processed, the fecal material was defrosted and one gram was measured out with sterile scoop. The samples were serially diluted in de-ionized (DI) water. The diluted samples were run through a membrane filtration system, following the EPA method 1603 [33]. The membrane of 0.45 µm pore size was removed from the filtration system with sterile forceps and placed on modified Thermo-tolerant E. coli, mTEC, (Difco®) agar plates. The plates were inverted and placed in an incubator at 35.5˚C ± 0.5˚C for two hours to revive the cells. Then the plates were sealed in Whirl-Pak® bags and placed in a water bath at 44.5˚C ± 0.5˚C for 22 hrs to select for thermo-tolerant E. coli. The plates were counted and values of 30 to 300 CFUs (colony forming units) were recorded.
Randomly selected isolates from each plate were streaked on Nutrient agar with, 4-methylumbelliferyl-β- D-glucuronide (MUG), (Difco®) and placed inverted in an incubator at 35.5˚C for 24 hrs. MUG is a colorless substrate that is hydrolyzed by an enzyme present in E. coli, to a fluorescent product, 4-methylumberlliferone. E. coliwas confirmed if the MUG plates fluoresced. Confirmed isolates were stored in labeled centrifuge tubes with 1 mL of Luria-Bertani (LB) broth (Difco®) and 10% glycerol in −20˚C freezer.
3.3. Growth Kinetics of E. coli in Water under Different Temperatures
Three E. coli isolates from each feral hog (H1-3, H4-1, and H7-1) and deer (D1-c, D2-c, and D2-d) fecal sample were enriched in 100 mL of LB broth at 35.5˚C for 24 hrs. The enriched LB broth was diluted to 10-4 by adding 1 mL of LB broth into 100 mL sterile DI water, stirred, and then 1 mL of the diluted LB broth was added to 100 mL of sterile DI water. Finally, creek water microcosms were made with 1 mL of the 10−4 dilution of LB broth is added to 100 mL of sterile Cedar Creek water (autoclaved three times at 121˚C for 15 min). The creek water microcosms were triplicated and kept in an incubator set according to the experimental temperatures (10˚C, 25˚C, and 30˚C). Over 30 hrs, 0.1 mL of each water microcosm were spread plated onto MacConkey agar (Difco®) plate at different sampling times. The E. coli concentrations (CFU/mL) were recorded at each sampling time.
The kinetic characteristics of E. coli strains in water at different temperatures were determined using first order kinetics. The natural log of the bacterial counts was plotted against time to obtain the rate constant, k. A trend line was fitted to the data to determine the k-value from the slope of the line. If the k-value was positive, then the doubling time (td) was calculated. If the k-value was negative, then the half-life (t1/2) was calculated.
3.4. Growth Kinetics of E. coli in Soil under Different Moisture Conditions
One E. coli isolate from each feral hog (H1-3) and deer (D2-c) fecal sample was enriched in 100 mL of LB broth. Cedar Creek soil (Table 1; autoclaved three times at 121˚C for 15 min and dried in oven for 10 hrs) was used in soil microcosms with 1 mL of enriched LB broth. An estimated amount of sterile DI water (0, 6, and 15 mL) was added to 30 g of soil to obtain experimental moisture contents (4%, 25%, and 57%). Three replicated soil microcosms were placed on a rotary shaker at 200 rpm at room temperature (22˚C). Over one week, E. coli was enumerated by serially diluting one gram soil from each microcosm in DI water and 0.1 mL of the last three dilutions was spread-plated onto MacConkey agar plates. The E. coli bacterial counts (CFU/g) were recorded at five to seven different sampling times for the duration of a week. One isolate from each MacConkey plate with growth was randomly selected and streaked onto nutrient agar with MUG and grown at 35.5˚C for 24 hrs to confirm the isolate was still E. coli and not contamination.
The kinetic characteristics of E. coli strains in soil at different soil moisture conditions were determined in the same manner as described in Section C.
4. Results and Discussion
4.1. Growth of E. coli in Water at Different Temperatures
The change in concentration of E. coli isolates from feral hog and deer fecal material in sterilized Cedar Creek water was observed at different temperatures. Preliminary eight hour studies were conducted and it was found that water temperature affected the E. coli concentration over time. Concentration of E. coli increased in water at 25˚C and at 30˚C over time. At 10˚C, decrease in E. coli concentration was observed (data not shown).
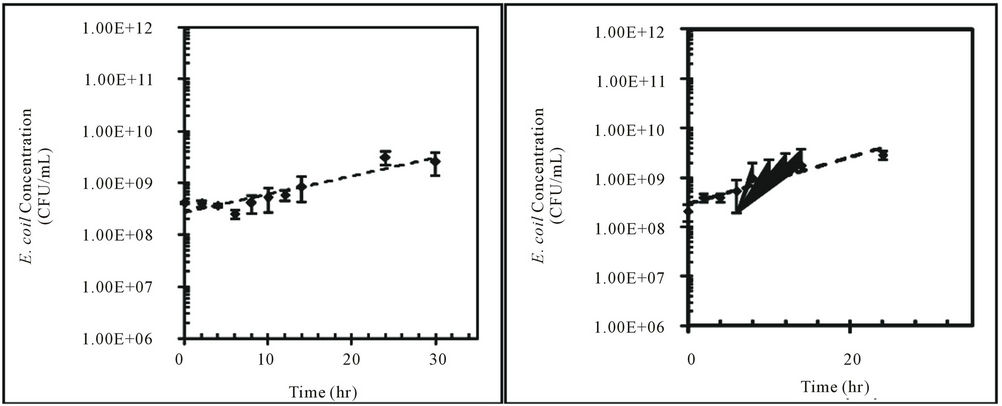
These findings were further tested with one isolate from feral hog fecal material (H1-3) and one isolate from deer fecal material (D2-c) over 30 hours. E. coli concentrations for H1-3 decreased in water at 10˚C and increased in water at 25˚C and 30˚C (Figure 2). The change in E. coli concentrations for D2-c was the same for all three temperatures (Figure 2). Padia (2010) and Hendricks et al. (1972) observed increase in E. coli concentration in water at 30˚C over time. However, [34] and [35] reported E. coli concentrations in water decreased at higher temperatures, such as 30˚C.
These contradicting observations in the fate of E. coli in water at 30˚C might be due to the difference in E. coli isolates used in these studies. In this study and the study by [24], thermo-tolerant E. coli was enumerated directly from the fecal material of potential sources, whereas laboratory E. coli strains that did not originate from fecal material were used in other studies [34,35]. The high temperature of the intestinal tract of mammals (~30˚C) promotes growth of thermo-tolerant enteric bacteria, such as E. coli. For this reason, the EPA method to enumerate E. coli in water uses a temperature of 44.5˚C to select for thermo-tolerant E. coli [33]. The results from this study using thermo-tolerant E. coli give a more accurate depiction of the fate of E. coli from fecal deposition compared to studies using laboratory E. coli strains.
The kinetic constant (k), doubling time (td), and halflife (t1/2) were determined assuming first order kinetics.
The kinetic characteristics for E. coli isolates, H1-3 and D2-c, at each water temperature are shown in Table 2. The kinetic constants for both H1-3 and D2-c were the lowest at 10˚C and the highest at 30˚C in water (Table 2). The kinetic constants for H1-3 and D2-c were negative, indicating the k-value was a decay rate (Table 2). The growth rate of E. coli varies with temperature and is crucial in determining total maximum daily loads (TMDLs) for E. coli. The duration of this study was 30 hours in the laboratory but considered a day, 24 hours, in the aquatic environment. The doubling time/half-life, td/t1/2, along with the k-value, can be used to quantify the amount of E. coli present after a period of time.
4.2. Growth of E. coli in Soil under Different Moisture Conditions
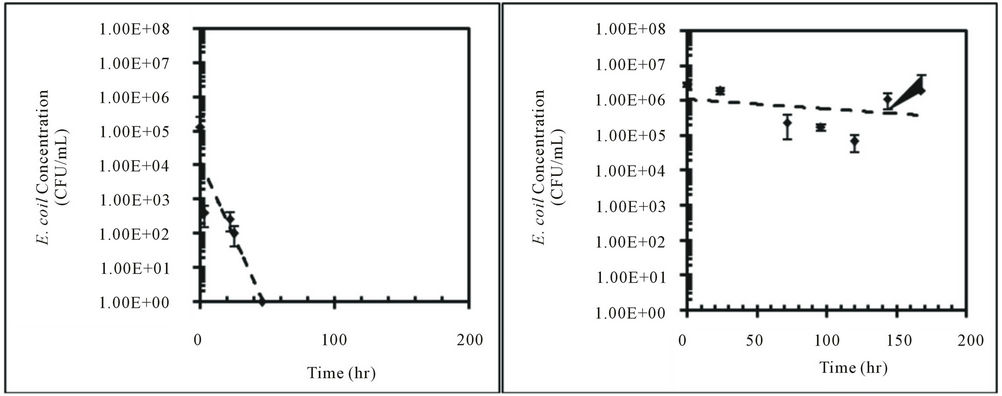
Concentrations of E. coli isolates from feral hog and deer fecal material in sterilized Cedar Creek soil (Table 1) at different moisture conditions were measured over time (Figure 3). Both E. coli isolates from feral hog (H1-3) and deer (D2-c) decreased in concentrations over 168 hours for 4%, 25%, and 57% moisture content, with the exception of H1-3 at 57% with a slight increase in concentration. At 4% moisture content, the E. coli concentrations for both isolates (H1-3 and D2-c) decreased to zero after only 50 hours. These observations were explained by first order kinetic constant (k), doubling time (td), and half-life (t1/2). Kinetic study results for E. coli isolates, H1-3 and D2-c, in soil at different moisture contents are presented in Table 3.
In this study, a greater rate of decay was observed for E. coli in soil at 4% moisture content compared to soil at 25% or 57% moisture content (Table 3). Previous studies reported higher die-off rate for E. coli in dry soil than in saturated soil [14,15,25,36]. Based on the results from this study, E. coli concentration in dry soil with 4% moisture content will decrease to half the initial concentration after approximately three to four hours (Table 3). This rapid decay of E. coli concentration in dry soil would continue to occur until the E. coli concentrations becomes zero.

Table 2. Kinetic characteristics of E. coli isolates from feral hog and deer feces in sterilized Cedar Creek water at different temperatures.
 (a)
(a)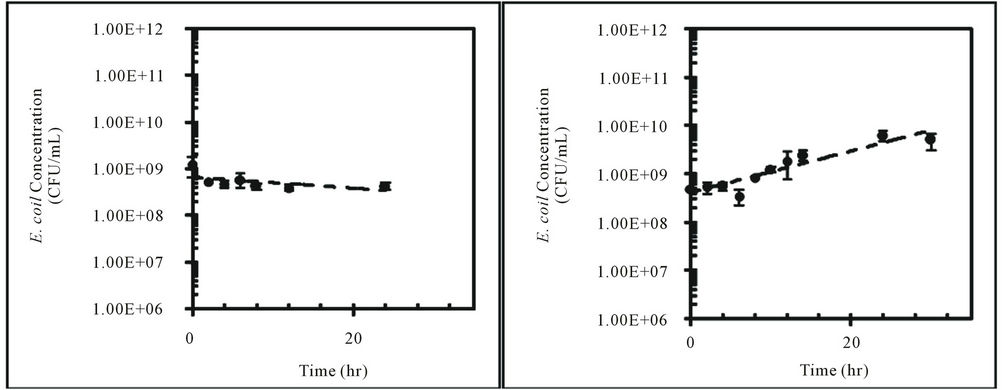 (b)
(b)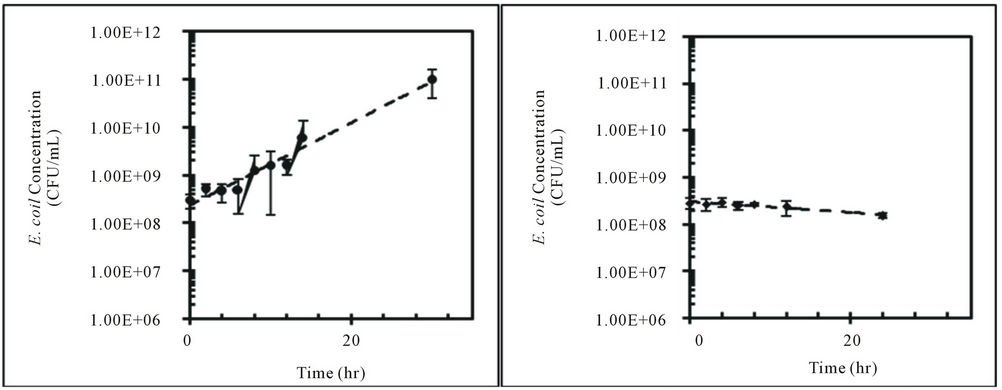 (c)
(c)
Figure 2. Concentrations (CFU/mL) of E. coli isolates, H1-3 and D2-c, in sterilized Cedar Creek water at different temperatures over time, (a) H1-3 at 10˚C; (b) H1-3 at 25˚C; (c) H1-3 at 30˚C; (d) D2-c at 10˚C; (e) D2-c at 25˚C; (f) D2-c at 30˚C.
 (a)
(a)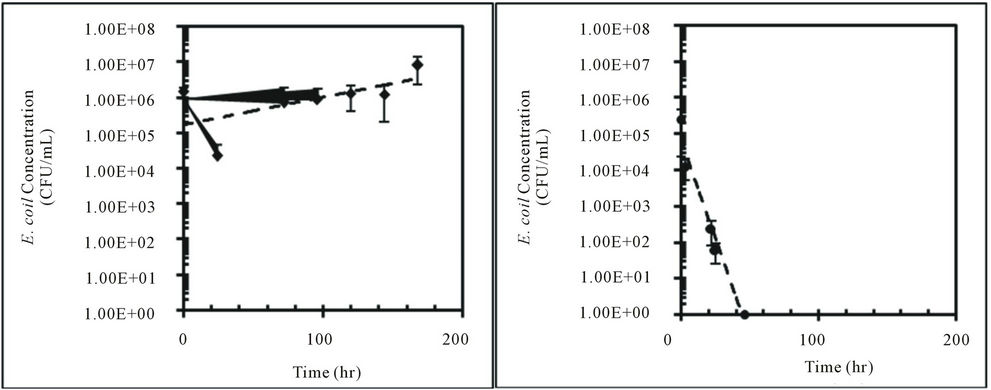 (b)
(b)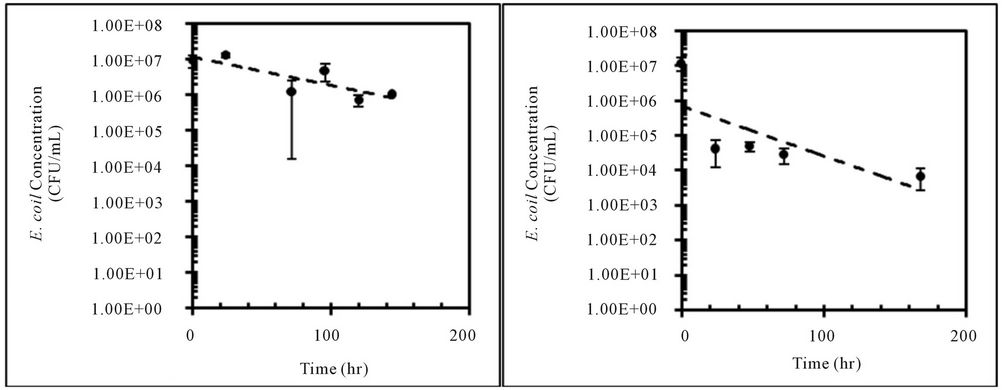 (c)
(c)
Figure 3. Concentrations (CFU/mL) of E. coli isolates, H1-3 and D2-c, in sterilized Cedar Creek soil at different moisture content over time, (a) H1-3 at 4%; (b) H1-3 at 25%; (c) H1-3 at 57%; (d) D2-c at 4%; (e) D2-c at 25% (f) D2-c at 57%.
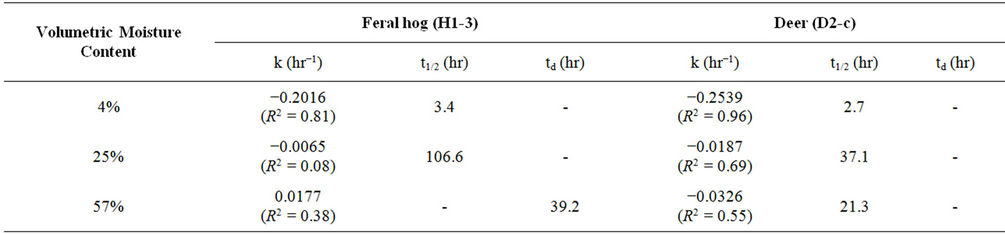
Table 3. Kinetic characteristics of E. coli isolates from feral hog and deer feces in sterilized Cedar Creek soil at different moisture contents.
Several previous studies showed E. coli growth in saturated soils [14,15,25]. At 57% soil moisture content, growth was observed in E. coli isolated from feral hog feces (H1-3) while decay was observed in E. coli isolated from deer feces (D2-c). This difference may be due to the difference in moisture content of feral hog and deer fecal material. While processing the samples, it was observed that feral hog feces had more moisture than deer feces. Previous study showed the die-off of E. coli varied with the moisture condition of the fecal material [37].
It should be noted that in this study the effect of soil moisture content on the growth of E. coli was conducted in sterile soil microcosms, keeping all other environmental variables constant. Non-sterile soil might have resulted in lower E. coli concentrations due to competition for nutrients by the other microorganisms present in the soil [11,38]. The level of competition from other microorganisms is variable from soil to soil and would be difficult to predict. This study was designed to gain understanding of the fate of E. coli under different moisture contents with little to no competition within the soil.
5. Conclusions
Six different wildlife sources that could potentially contribute to E. coli contamination in Cedar Creek watershed, Texas were identified. The wildlife sources included feces from raccoon, opossum, feral hog, deer, skunk, and armadillo. The fecal material of each wildlife species was enumerated for E. coli and reported as CFU per g wet basis. The large range and variability in E. coli concentrations among few of the wildlife feces could be because of diverse dietary habits. There was a statistically significant difference in E. coli concentration in fecal samples collected in the summer and winter.
The growth of E. coli in sterilized Cedar Creek water at different temperatures varied depending on water temperature. Both deer and feral hog fecal E. coli isolates had the highest growth rate in water at 30˚C and both isolates died off in water at 10˚C. At 4% soil moisture content, both isolates died off rapidly. This suggests that under dry soil conditions E. coli will not survive for a longer duration and will not pose a threat to nearby waterbodies. The E. coli isolate from feral hog fecal sample persisted in soil at 25% moisture content and slightly grew at 57% moisture content. However it should be noted that the correlation between E. coli concentration and these moisture contents was very low. Results from this study show the high variability in E. coli persistence, survival, and decay in terrestrial environment. It is evident that fate of E. coli in the environment is a complex process and governed by various factors. The interacting effects of these environmental factors add varying degrees of complexity to model and predict fecal contamination in watersheds.
6. Acknowledgements
The research was funded through a USEPA CWA §319 (h) NPS grant from the Texas State Soil and Water Conservation Board (TSSWCB). The authors would like to thank Dr. Israel Parker for the collection of the fecal samples and Ms. Reema Padia for assisting in processing the fecal samples.
REFERENCES
- USEPA, “Causes of Impairment for 303(d) Listed Waters,” US Environmental Protection Agency, Washington DC, 2008, Retrieved 19 March 2012, from US Environmental Protection Agency: http://iaspub.epa.gov/waters10/attains_impaired_waters.impaired_waters_list?p_state=TX&p_cycle=2008
- USEPA, “EPA’s 2008 Report on the Environment,” US Environmental Protection Agency, Washington DC, 2008, Retrieved 6 January 2012, from US Environmental Protection Agency: http://www.epa.gov/ncea/roe/docs/roe_final/roe_final_health_chap5_disease.pdf
- TCEQ, “Texas 303(d) List (March 2008),” 2008, Retrieved 6 January 2012, from Texas Commission on Environmental Quality: http://www.tceq.texas.gov/assets/public/compliance/monops/water/08twqi/2008_303d.pdf
- K. Anderson, J. E. Whitlock and V. J. Harwood, “Persistence and Differential Survival of Fecal Indicator Bacteria in Subtropical Waters and Sediments,” Applied and Environmental Microbiology, Vol. 71, No. 6, 2005, pp. 3041-3048. doi:10.1128/AEM.71.6.3041-3048.2005
- M. Byappanahalli, M. Fowler, D. Shively and R. Whitman, “Ubiquity and Persistence of Escherichia coli in a Midwestern Coastal Stream,” Applied and Environmental Microbiology, Vol. 69, No. 8, 2003, pp. 4549-4555. doi:10.1128/AEM.69.8.4549-4555.2003
- T. R. Desmarais, H. M. Solo-Gabriele and C. J. Palmer, “Influence of Soil on Fecal Indicator Organisms in a Tidally Influenced Subtropical Environment,” Applied and Environmental Microbiology, Vol. 68, No. 3, 2002, pp. 1165-1172. doi:10.1128/AEM.68.3.1165-1172.2002
- S. Ishii, W. B. Ksoll, R. E. Hicks and M. J. Sadowsky, “Presence and Growth of Naturalized Escherichia coli in Temperate Soils from Lake Superior Watersheds,” Applied and Environmental Microbiology, Vol. 72, No. 1, 2006, pp. 612-621. doi:10.1128/AEM.72.1.612-621.2006
- H. M. Solo-Gabriele, M. A. Wolfert, T. R. Desmarais and C. J. Palmer, “Sources of Escherichia coli in a Coastal Subtropical Environment,” Applied and Environmental Microbiology, Vol. 66, No. 1, 2000, pp. 230-237. doi:10.1128/AEM.66.1.230-237.2000
- Y. J. An, D. H. Kampbell and G. P. Breidenbach, “Escherichia coli and Total Coliforms in Water and Sediments at Lake Marinas,” Environmental Pollution, Vol. 120, No. 3, 2002, pp. 771-778.
- E. Franz, A. D. van Diepeningen, O. J. de Vos and A. H. C. van Bruggen, “Effects of Cattle Feeding Regimen and Soil Management Type on the Fate of Escherichia coli O157:H7 and Salmonella enterica Serovartyphimurium in Manure, Manure-Amended Soil, and Lettuce,” Applied and Environmental Microbiology, Vol. 71, No. 10, 2005, pp. 6165-6174. doi:10.1128/AEM.71.10.6165-6174.2005
- P. Laliberte and D. J. Grimes, “Survival of Escherichia coli in Lake Bottom Sediment,” Applied and Environmental Microbiology, Vol. 43, No. 3, 1982, pp. 623-628.
- B. M. Sherer, J. R. Miner, J. A. Moore and J. C. Buckhouse, “Indicator Bacteria Survival in Stream Sediments,” Journal of Environmental Quality, Vol. 21, No. 4, 1992, pp. 591-595. doi:10.2134/jeq1992.00472425002100040011x
- G. R. Stephenson and R. C. Rychert, “Bottom Sediment: A Reservoir of Escherichia coli in Rangeland Streams,” Journal of Range Manage, Vol. 35, No. 1, 1982, pp. 119- 123. doi:10.2307/3898537
- D. S. Chandler and J. A. Craven, “Relationship of Soil Moisture to Survival of Escherichia coli and Salmonella typhimurium in Soils,” Australian Journal of Agricultural & Resource, Vol. 31, No. 3, 1980, pp. 547-555. doi:10.1071/AR9800547
- S. Crane and J. A. Moore, “Bacterial Pollution of Groundwater: A Review,” Water, Air, & Soil Pollution, Vol. 22, No. 1, 1984, pp. 67-83. doi:10.1007/BF00587465
- M. Habteselassie, M. Bischoff, E. Blume, B. Applegate, B. Reuhs, S. Brouder and R.F. Turco, “Environmental Controls on the Fate of Escherichia coli in Soil,” Water, Air, & Soil Pollution, Vol. 190, No. 1-4, 2008, pp. 143- 155. doi:10.1007/s11270-007-9587-6
- A. F. Carlucci, P. V. Scarpino and D. Pramer, “Evaluation of Factors Affecting Survival of Escherichia coli in Sea Water,” Applied Microbiology, Vol. 9, No. 5, 1961, pp. 400-404.
- M. A. Faust, A. E. Aotaky and M. T. Hargadon, “Effect of Parameters on the in Situ Survival of Escherichia coli MC-6 in an Estuarine Environment,” Applied Microbiology, Vol. 30, No. 5, 1975, pp. 800-806.
- Z. Filip, D. Kaddu-Mulindwa and G. Milde, “Survival of Some Pathogenic and Facultative Pathogenic Bacteria in Groundwater,” Water Science and Technology, Vol. 20, No. 3, 1988, pp. 227-231.
- K. P. Flint, “The Long-Term Survival of Escherichia coli in River Water,” Journal of Applied Bacteriology, Vol. 63, No. 3, 1987, pp. 261-270. doi:10.1111/j.1365-2672.1987.tb04945.x
- C. W. Hendricks, “Enteric Bacterial Growth Rates in River Water,” Applied Microbiology, Vol. 24, No. 2, 1972, pp. 168-174.
- R. C. Jamieson, D. M. Joy, H. Lee, R. Kostaschuk and R. J. Gordon, “Resuspension of Sediment-Associated Escherichia coli in a Natural Stream,” Journal of Environmental Quality, Vol. 34, No. 2, 2005, pp. 581-589. doi:10.2134/jeq2005.0581
- G. A. McFeters, G. K. Bissonnette, J. J. Jezeski, C. A. Thomson and D. G. Stuart, “Comparative Survival of Indicator Bacteria and Enteric Pathogens in Well Water,” Applied Microbiology, Vol. 27, No. 5, 1974, pp. 823-829.
- R. Padia, “Occurrence and Fate of Escherichia coli from Nonpoint Sources in Cedar Creek Watershed, Texas,” Unpublished MS Thesis, Texas A&M University, Department of Biological and Agricultural Engineering, College Station, Tex, 2010.
- I. D. Ogden, D. R. Fenlon, A. Vinten and D. Lewis, “The Fate of Escherichia coli O157 in Soil and Its Potential to Contaminate Drinking Water,” International Journal of Food Microbiology, Vol. 66, No. 1-2, 2001, pp. 111-117. doi:10.1016/S0168-1605(00)00508-0
- R. Sjogren, “Prolonged Survival of an Environmental Escherichia coli in Laboratory Soil Microcosms,” Water, Air, & Soil Pollution, Vol. 75, No. 3-4, 1994, pp. 389-403. doi:10.1007/BF00482948
- B. Bicknell, J. Imhoff, J. Kittle Jr., A. Donigan and R. Johanson, “Hydrological Simulation Program FORTRAN. User’s Manual for Version 11,” EPA/600/R-97/080, USEPA National Exposure Research Laboratory, Research Triangle Park, 1997.
- Y. A. Pachepsky, A. M. Sadeghi, S. A. Bradford, D. R. Shelton, A. K. Guber and T. Dao, “Transport and Fate of Manure-Borne Pathogens: Modeling Perspective,” Agricultural Water Management, Vol. 86, No. 1-2, 2006, pp. 81-92. doi:10.1016/j.agwat.2006.06.010
- A. M. Sadeghi and J. G. Arnold, “A SWAT/Microbial Submodel for Predicting Pathogen Loadings in Surface and Groundwater at Watershed and Basin Scales,” TMDL Environ. Reg, 2002.
- A. Teague, R. Karthikeyan, M. Babbar-Sebens, R, Srinivasan and R. A. Persyn, “Spatially Explicit Load Enrichment Calculation Tool to Identify Potential E. coli Sources in Watersheds,” Transactions of ASABE, Vol. 52, No. 4, 2009, pp. 1109-1120.
- R. D. Harmel, R. Karthikeyan, T. Gentry and R. Srinivasan, “Effects of Agricultural Management, Land Use, and Watershed Scale on E. coli Concentrations in Runoff and Streamflow,” Transactions of ASABE, Vol. 53, No. 6, 2010, pp. 1833-1841.
- B. L. Benham, C. Baffaut, R. W. Zeckoski, K. R. Mankin, Y. A. Pachepsky, A. M. Sadeghi, K. M. Brannan, M. L. Soupir and M. J. Habersack, “Modeling Bacteria Fate and Transport in Watersheds to Support TMDLs,” Transactions of ASABE, Vol. 49, No. 4, 2006, pp. 987-1002.
- USEPA, “Method 1603: Escherichia coli (E. coli) in Water by Membrane Filtration Using Modified MembraneThermotolerant Escherichia coli agar (Modified m TEC),” Publication EPA-821-R-02-023, USEPA Office of Water, Office of Science and Technology, Washington DC, 2002.
- S. Crane and J. A. Moore, “Modeling Enteric Bacterial Die-Off: A REVIEW,” Water, Air, & Soil Pollution, Vol. 27, No. 3-4, 1986, pp. 411-439. doi:10.1007/BF00649422
- K. R. Reddy, R. Khaleel and M. R. Overcash, “Behavior and Transport of Microbial Pathogens and Indicator Organisms in Soils Treated with Organic Wastes,” Journal of Environmental Quality, Vol. 10, No. 3, 1981, pp. 255- 266. doi:10.2134/jeq1981.00472425001000030001x
- E. D. Berry and D. N. Miller, “Cattle Feedlot Soil Moisture and Manure Content: II. Impact on Escherichia coli O157,” Journal of Environmental Quality, Vol. 34, No. 2, 2005, pp. 656-663. doi:10.2134/jeq2005.0656
- D. M. Oliver, P. M. Haygarth, C. D. Clegg and A. L. Heathwaite, “Differential E. coli Die-Off Patterns Associated with Agricultural Matrices,” Environmental Science and Technology, Vol. 40, No. 18, 2006, pp. 5710- 5716. doi:10.1021/es0603249
- R. L. Tate, “Cultural and Environmental Factors Affecting the Longevity of Escherichia coli in Histols,” Applied and Environmental Microbiology, Vol. 35, No. 5, 1978, pp. 925-929.
NOTES
*Corresponding author.