Journal of Environmental Protection
Vol. 3 No. 1 (2012) , Article ID: 16873 , 8 pages DOI:10.4236/jep.2012.31005
3D Field-Scale Environmental Multimedia System Validation of the Dispersion of Benzene for Trail Road Landfill Site and Its Risk Assessment
![]()
1CanmetENERGY Devon Research Centre, Natural Resources Canada, Devon, Canada; 2The Department of Building, Civil, and Environmental Engineering, Concordia University, Montreal, Canada.
Email: Jing.Yuan@NRCan-RNCan.gc.ca
Received October 19th, 2011; revised November 22nd, 2011; accepted December 25th, 2011
Keywords: environmental multimedia system (EMS); Monte Carlo method (MCM); risk assessment; multimedia environments
ABSTRACT
In this paper, a new modeling approach incorporating both a new environmental multimedia system (EMS) and the Monte Carlo method (MCM) is developed as a tool for the risk assessment of contaminants. An EMS has been developed and validated by the use of field data and investigation to create a 3D simulation of current conditions of the Trail Road Landfill area. In addition, given the high level of uncertainty associated with EMS practices, the MCM approach is embedded into the developed EMS to deal with vague or imprecise model and site conditions related to uncertainties in the system. In this study, two emission rates were examined for risk assessment of Trail Road Landfill site in the years 2016 and 2026; the data are predicted on the basis of the known production trend from 2001 to 2006. The risk quotient (RQ) factors, combined with present and future rates of chemical pollution, provide spatial and temporal assessment of risk from the leachate in Trail Road Landfill site. Results of the risk assessment approach reveal that as the landfill or oil drilling site becomes depleted, adverse effects on the multimedia environment associated with benzene concentration occur, and the potential risk levels have been quantified for the Trail Road Landfill site. The present study indicates that the dispersion of a large volume of pollutants from the landfill or the oil drilling site poses possible risks to the regional multimedia environment. The new EMS will serve as a risk assessment tool to address the fate and transportation of pollutants in complex multimedia environments. This tool will also be useful in the management of the resulting environmental impacts.
1. Introduction
Early environmental decision making was based on qualitative descriptions of the effects of pollutant dispersion on organisms and the environment, with some reliance on the assumption that the protection of human health would also ensure adequate protection of the environment. Current information and environmental regulations suggest the need for a more quantitative, risk-based approach to decision making for environmental protection. A consultative risk assessment approach is necessary to evaluate the scale of potential hazardous environmental impacts on ecology and human health, such as the Hazardous Waste Identification Rule frameworks [1], the Total Risk Integrated Methodology system [2], the Multimedia Integrated Modeling System [3], the finitesource multimedia, multipathway, and multi-receptor risk assessment [4], and Chemical Hazard Assessment and Risk Management [5]. It has been found that these risk assessments have not taken all factors into consideration. This inadequacy may lead to an incorrect assessment of the risk level. In recent years, much more research, integrated with multimedia models, has been concentrated on human and risk assessments, such as the Monte Carlo method (MCM) [6-8]. This consists of characterizing the risk that a substance poses to human and nonhuman organisms by considering its inherent toxicity and the potential for exposure. In a Monte Carlo analysis, a sample from the distribution of an input parameter is placed in a simulation run to interact in a model with samples from other input parameters. A number of studies have been carried out on the risk assessment of environmental multimedia assessment using the MCM to conduct probabilistic analysis. Although MCM simulation has its limitations (for example, insufficient or imprecise data, naturally, cannot be analyzed by the MCM) [9], there is a small but growing number of multimedia environmental fate models that perform stochastic simulations by including both the uncertainty in chemical parameters and the spatial and temporal variability of the environment [10-12]. Most existing probability analyses in multimedia environmental fate models consider only the uncertainties in chemical properties [13,14]. However, partly because of improvements in computer processing power and the size of the database available, it is now possible to estimate uncertainties using the traditional MCM simulation. For instance, Liu (2007) [7] describes the application of the Multimedia Contaminant Fate, Transport, and Exposure (MMSOILS) model to predict health risk and distributions of those predictions generated using MCMs. With more powerful computers, probability distributions are now used in place of discrete values, and appropriate Monte Carlo analysis is currently the most important technique for quantifying uncertainty in environmental assessments [6-7,15]. However, MCM simulation based on environmental multimedia system (EMS) modeling has seldom been reported.
2. Methodology
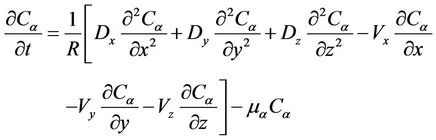
The governing equation for the EMS is given as follows [16]:
 (1)
(1)
where Ca is the contaminant concentration, equal to the mass of contaminant per unit of volume of contaminants ; Vx, Vy, and Vz are the components of the seepage velocity
 ; Dx, Dy, and Dz are the components of the dispersion coefficient
 ; R is the total retardation factor (dimensionless); and
  is the effective first-order decay rate constant
 .
.
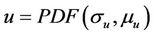
For the risk assessment, considering the uncertain parameters in the EMS model, hydraulic conductivity, K, bulk density, B or porosity, and θ are the key input variables in the simulations. It has been reported that the mixing coefficient resulted in generally normal distributions. Using the Monte Carlo approach, the values of those parameters are generated from a uniform distribution. The normal generators can be simply expressed as follows:
 (2)
(2)
where u = hydraulic conductivity, K, or bulk density, B or porosity, θ; 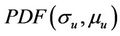 represents a normal distribution function of
  and
and ;
;  = standard deviation of u; and
  = the mean value of u. After certain sets of random samples for each parameter are generated, the distribution of predicted concentrations for each grid square can be calculated by the EMS model.
The distribution results can then be used to define 5th and 95th percentile concentrations and an uncertainty factor is calculated as the ratio of the 95th and 5th percentile concentrations. Then we should decide the level of risk. In the present thesis, there are two methods used to study the levels of risks or adverse effects associated with multimedia pollutant transportation, the risk quotient (RQ) and probabilistic risk assessment. Specifically, RQ is the ratio of a measured or estimated concentration (PEC) to a benchmark concentration (KEC). RQ is a primary tool to support the environmental evaluation of the use of production chemicals on the basis of available data about these chemicals and platform-related conditions [17,18]. The RQ evaluation is carried out on the basis of a comparison of the predicted environmental concentration with the known environmental criteria, which refer to local environmental guidelines for a species. The RQ factor is calculated as follows:
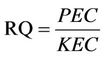 (3)
(3)
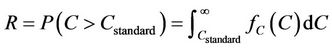
The RQ can be viewed as the severity measure of a risk. The higher the value of RQ above 1, the greater the possibility of environmental risk. When RQ > 1, adverse environmental effects may be expected. To evaluate the probability of RQ exceeding 1, the probabilistic distribution for each point of concern resulting from the MCM is taken into account for the quantification of the RQ. For example, the RQ distribution under 95th percentile concentrations, presented below in Section 4, will be performed to show the severity risk levels. Finally, the EMS and the MCM are combined through the probabilistic risk assessment method. Environmental risk associated with the transportation of multimedia pollutants can be expressed as the probability of a pollutant’s concentration (denoted as C) exceeding local environmental guidelines (denoted as Cstandard), i.e., R = P (C > Cstandard), where R denotes risk. Thus, the risk can be quantified as follows [19]:
 (4)
(4)
The risk simulation calculates numerous scenarios of a model by repeatedly picking values from a probability distribution for the uncertain variables and using those values for the model. These probabilities are propagated through the EMS model, and an output distribution describing the probability of various outcomes is generated (Figure 1).
3. Case Study
3.1. Trail Road Landfill Site
The study site, which includes the Nepean and Trail Road landfills, is located within the Ottawa-Carleton region, which has a population of 750,000. The site, approximately 200 ha, is surrounded by light industry and farmland. Highway 416, Moodie Drive, and Cambrian Road border the site, to the east, west, and north, respectively, and at some distance from the landfills, Barnsdale Road borders the site to the south (see Figure 2) [20-22].
3.2. Model Setting and Topography
The large-scale area is about 4 × 4 km, with the Trail Road Landfill site as the center, as shown in Figure 3. The northwest boundary is Cambrian Road, where there is a large dewatering pond used to catch the local groundwater discharge. The pond water eventually discharges into the Jock River, which is located approximately 1 km to the north. Approximately 500 m from the northern boundary of Trail Road Landfill on the north side of southwest of Trail Road is the Nepean Landfill. Figure 3 shows that surface water runoff flows in a south to southwesterly direction from Trail Road.
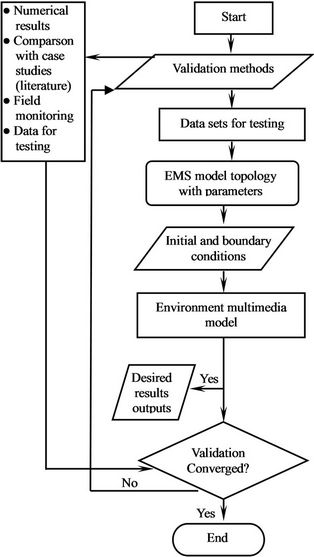
Figure 1. An output distribution describing the probability of various outcomes.
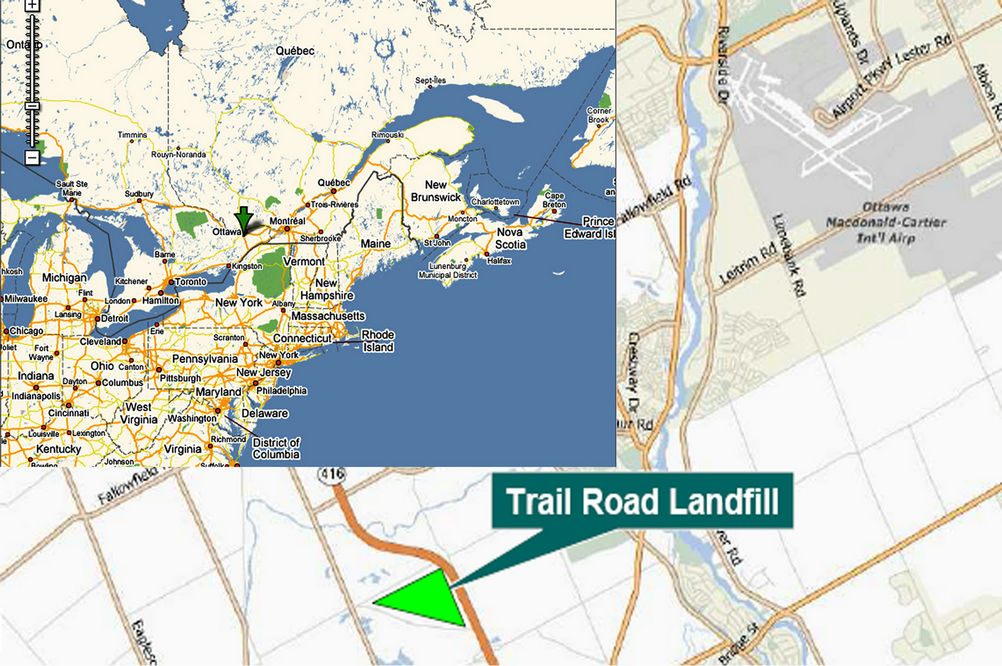
Figure 2. Location and map of Trail Road Landfill, Ottawa, Ontario.
3.3. Collection and Estimation of Model Data
Selecting or estimating important parameters has a relatively large potential influence on modeling outputs. These parameters may not be suitable for other sites, where environmental conditions are different. The input parameters related to environmental conditions and the physical properties of this site are given in Table 1 [20-22].
3.4. 3D Simulation Results of Benzene and Comparison with Observed Data at Trail Road Landfill Site
Table 2 shows a comparison of the average concentrations between the modeled and observed current data for different years. All sampled data are from Accutest Laboratories, Ltd., of Ottawa, Ontario. Accutest is certified by the Canadian Association for Environmental Analytical
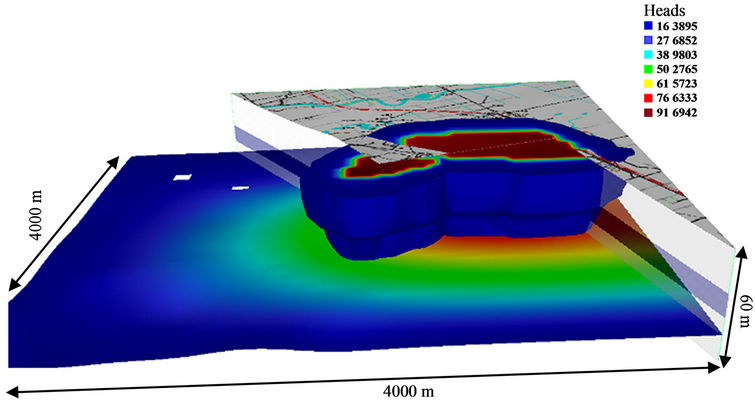
Figure 3. Topography of the study area.
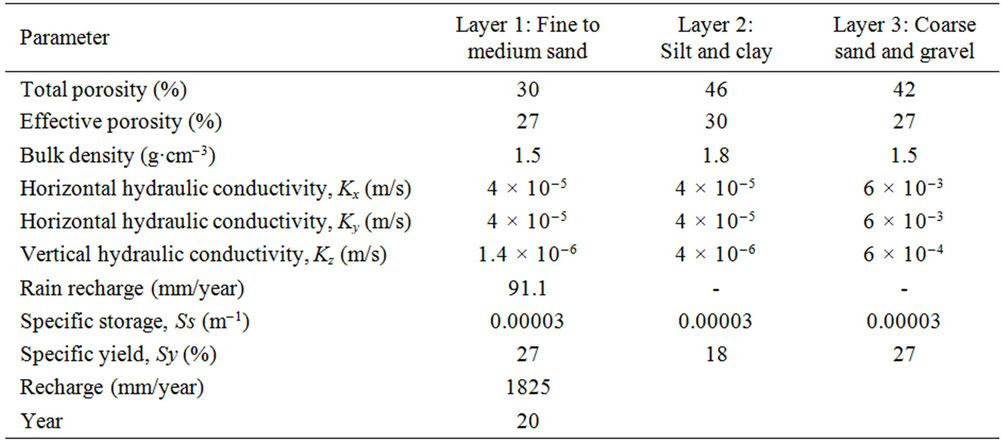
Table 1. Physical properties and environmental conditions of the Nepean Landfill.
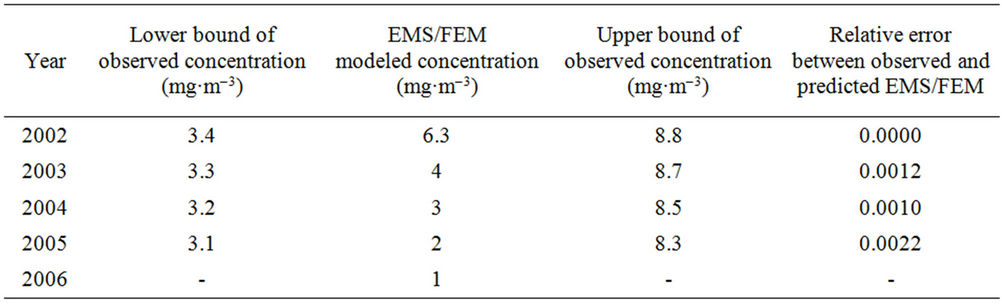
Table 2. Comparison of modeling results and observed benzene concentrations.
laboratories. All laboratory data for the 2002-2005 Trail Road and Nepean landfill sites annual monitoring and operating program was reported in a consistently thorough manner, ensuring that an appropriate level of QA/ QC was achieved. Furthermore, as shown in Table 2, all EMS/finite element method (FEM) model predictions were in the range (between the lower and upper boundaries) of the experimental results. The outputs from the EMS/FEM method are in the good agreement with the experimental results. The relative error between mean experimental and FEM model results was 0.000 - 0.0022, and the maximum difference between them was 0.22%. The minimum difference between the FEM model results and the observed data was 0 over 4 years. Using the 3D FEM solver compared with observed concentrations to confirm model accuracy, Figure 4 shows the EMS/FEM 3D concentration contour results for benzene (µg·L–1) over 10 years. The FEM results of the EMS developed here provide prediction of the complex and unsteady landfill benzene pollutants, compared with experimental results. The outputs from the FEM method interpret the effects of Trail Road Landfill leachate on groundwater quality beneath and in the vicinity of the landfill on the basis of monitoring data from 2002-2005. The source of the benzene leachate’s risk impact will be assessed in the following sections.
4. Risk assessment for the Trail Road Landfill Site
The MCM will be used for the risk assessment, which includes three main parts: parameter probability density function (Equation (2)), model outputs for probability density function, and the RQ evaluation (Equation (3)). In the Monte Carlo analysis mode, results are obtained in terms
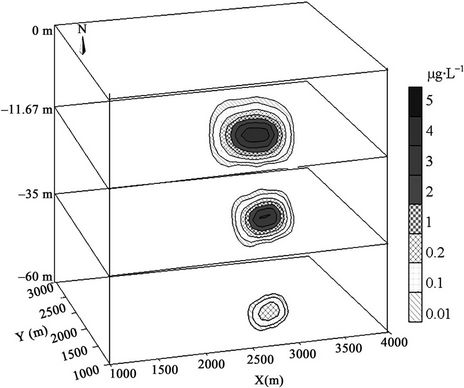
Figure 4. 3D concentration contours of benzene by EMS/ FEM over 10 years (µg·L–1).
of distributed value output that can be used to characterize uncertainty and variability for conducting probabilistic analyses. Table 3 shows the overall risk assessment results for Trail Road Landfill site. Based on the drinking water for benzene criterion issued by Health Canada, 0.001 mg·L–1 (1 µg·L–1), in 2016, the RQ of the 5th percentile is on the order of 0.0002 - 0.793; the probabilistic risk levels are zero, indicating that negligible risk is associated with the present benzene dispersion in the Trail Road Landfill site within 10 years for typical locations, indicated in Table 3. However, toward the end of this period, the benzene concentration will exceed the criterion. In 2016, the probabilistic risk level within 16 m of the source is from 9.91 × 10⁻¹⁰ to 7.55 × 10⁻⁶ kg·m–3; the RQ of the 95th percentile is on the order of 0.00099 - 7.55 for typical locations, indicated in Table 3.
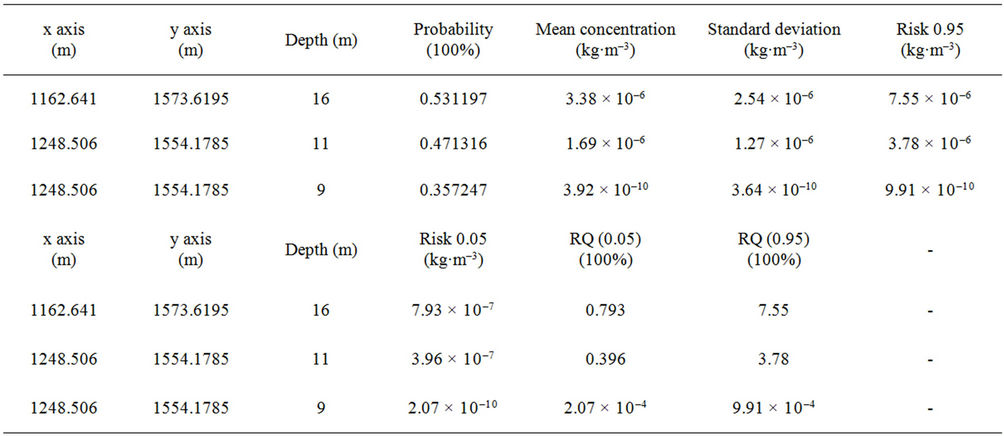
Table 3. Summary of risk assessment results.
Figures 5 and 6 show 95th and 5th percentile concentration contour maps in 2016. Note that the plots in Figure 5 (95th percentile concentration) necessarily represent an instantaneous concentration distribution that could occur because the 95th percentile concentration distribution may represent a worst case prediction. The 5th percentile concentrations are generally low. The predicted 95th percentile concentrations in 2016 are on the order of 12.5 - 6.2 µg·L–1, and the corresponding 5th percentile concentrations in 2016 are on the order of 1.2 - 0.4 µg·L–1.
Risk R is calculated using Equations (3) and (4). Figure 5 shows that the area corresponding to an RQ greater than 6.2 covers the highand medium-risk zones and a small part of the low-risk zone. In this study, a level of P(C > Cstandard) > 6.2 is considered high risk on the severity scale. Figure 6 shows the severity scale map associated with the probability of exceeding the standard (1 µg·L–1). As shown in the figure, the high-risk zone is located within an area of approximately 200,000 m2 around the Trail Road Landfill site. Figure 6 shows the 5th percentile RQ distribution map in 2016 associated with the criterion issued by Health Canada (1 µg·L–1). The inside shaded area indicates an RQ factor greater than 1, which indicates a medium (10% > P(C > Cstandard) > 20%) or low (P(C > Cstandard) < 10%) risk level. The medium-risk zone is between 90 and 100 m away from the source, which shows a very thin ring area, and the mean concentration is around 1.2 µg·L–1. The low-risk zone covers a 10,000 m2 area outside the medium-risk zone and has a concentration between 1 and 1.2 µg·L–1.

Figure 5. 95th percentile uncertainty predictions and RQ contour maps in 2016. Shaded area indicates RQ ≥ 6.2.
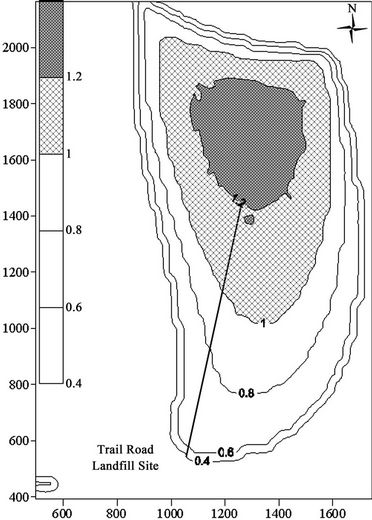
Figure 6. 5th percentile uncertainty predictions and RQ contour maps in 2016. Shaded area indicates RQ ≥ 1.
The rest of the area will have a zero probability of violating the benzene criteria. This area covers approximately 180,000 m2 (about 400 m in radius) in the center of the map. As mentioned before, an RQ larger than 1 generally corresponds to a greater than 5% probability of exceeding the chosen criterion.
This is a simple and effective method by which to visually rank the risk zones for benzene concentrations in groundwater. Its use could give decision makers a more comprehensive view of the risks involved in waste management at landfills or oil drilling sites.
5. Discussion
Case studies show that FEM numerical analysis not only gets good simulation results to improve EMS but also is effective in the environmental assessment of the complex spatial and temporal EMSs. A numerical model developed within the EMS framework 1) handles 3D risk assessment and 2) provides predictions of spatial and temporal concentration profiles.
Case studies also show that risk assessment analysis techniques, such as MCM analysis, with adequate supporting data and credible assumptions, can be viable statistical tools for analyzing variability and uncertainty in environmental risk assessments. Case studies show that groundwater in the shallow aquifer from beneath the Trail Road Landfill flows mainly in a southward direction, generally following the slope of the underlying clay layer surface (see Figures 4-6). A pumping well was set in the southwest of the Trail Road site, as the topography slopes downward, the shallow aquifer pinches out to the southwest of the site, and the clay becomes the surface unit. As shown in Figure 7, benzene leaving this area is in compliance with the appropriate regulatory criteria [23] after diluting for 5 years.
Dilute leachate effects of benzene were observed in the southwest portion of the Trail Road Landfill area in the lower deep aquifer at the multilevel monitor pumping well. Similarly, leachate effects were observed to the north of the landfill site in the upper/middle and lower parts of the deep aquifer. In conclusion, using these kinds of risk assessment methods, the adverse environmental effects of certain chemicals can easily be temporally and spatially modeled. It is anticipated that the most significant leachate impact generated by the sources may be at the point when the pollutants reach the regulatory criteria.
6. Conclusions
In this study, a risk assessment approach based on an EMS and the MCM was developed and validated by the use of field data and investigation to simulate 3D current conditions of the Trail Road Landfill area. The validation of the 3D concentration modeling indicates that EMS can, for this area, provide satisfactory simulations. The difference between the mean experimental concentrations and FEM modeled concentrations was less than 0.22%.
The pollutant dispersion of benzene and the risk assessment for the Trail Road Landfill site were also investigated by using Monte Carlo risk assessment methods. The risk assessment results have been used to evaluate the applicability and performance of various uncertainty analysis techniques to this new EMS model system. The benzene concentration results from the MCM for the Trail Road Landfill site revealed that there was a negligible risk associated with the concentration dispersion of
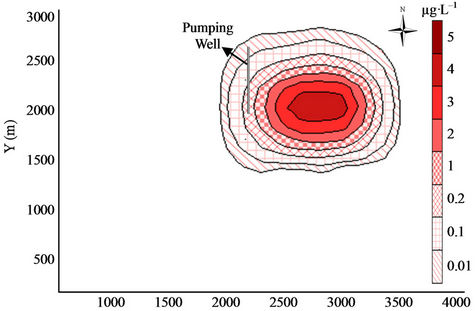
Figure 7. Concentration contour for standard C = 1 µg·L–1 in 2010.
benzene in the Trail Road Landfill site within 10 years. However, toward its depleted stage, adverse effects on the groundwater associated with benzene concentration were revealed, and the potential risk zone might cover an area of approximately 20,000 m2 with a RQ greater than 1. These results also imply a possibility that the dispersion of a large volume of pollutants from the landfill could have adverse effects on a relatively large area based on a well-defined end point, which may be selected depending on a specific problem under investigation.
The risk assessment results and risk discussion indicate that the improved multimedia model system can be used as a tool in a field experiment and in future treatment design. Integration of EMS and MCM is a first tool that permits quick and more precise assessment of longterm risks associated with the dispersion of contaminants into the regional multimedia environment. The approach developed here could contribute extensively to environmental risk assessments and to effective pollution control decisions in a field experiment and in future engineering works.
REFERENCES
- US EPA (U.S. Environmental Protection Agency), US EPA Documentation for the FRAMES-HWIR Technology Software System. Vol. 1: System Overview, Pacific Northwest National Laboratory, Washington DC, 1999.
- US EPA (U.S. Environmental Protection Agency), Three Multimedia Models Used at Hazardous and Radioactive Waste Sites. Environmental Protection Agency, Washington DC, 1996.
- J. M. Johnston, J. H. Novak and S. R. Kraemer, “Multimedia Integrated Modeling for Environmental Protection: Introduction to a Collaborative Framework,” Environmental Monitoring and Assessment, Vol. 63, No. 1, 2000, pp. 253-263. doi:10.1023/A:1006464407117
- US EPA (U.S. Environmental Protection Agency), A framework for Finite-Source Multimedia, Multipathway and Multireceptor Risk Assessment: 3MRA. U.S. Environmental Protection Agency, Office of Solid Waste, Washington DC, 2003.
- M. Thatcher, M. Robson, L. R. Henriquez and C. L. Karman, “An User Guide for the Evaluation of Chemicals Used and Discharged Offshore: Version 1.2,” CIN Revised CHARM III Report, Charm Implementation Network (CIN), Eurpean Oilfield Speciality Chemicals Association (EOSCA), Manchester, 2001.
- Y. Luo and X. Yang, “A Multimedia Environmental Model of Chemical Distribution: Fate, Transport, and Uncertainty Analysis,” Chemosphere, Vol. 66, No. 8, 2007, pp. 1396-1407. doi:10.1016/j.chemosphere.2006.09.026
- Z. Q. Liu, Y. H. Zhang, G. H. Li and X. Zhang, “Sensitivity of Key Factors and Uncertainties in Health Risk Assessment of Benzene Pollutant,” Journal of Environmental Sciences, Vol. 9, No. 10, 2007, pp. 1272-1280. doi:10.1016/S1001-0742(07)60208-3
- US EPA (U.S. Environmental Protection Agency), Summary Report for the Workshop on Monte Carlo Analysis Risk Assessment Forum. US EPA, Washington DC, 1996.
- H. M. Lee, “Applying Fuzzy Set Theory to Evaluate the Rate of Aggregative Risk in Software Development,” Fuzzy Sets and Systems, Vol. 79, No. 3, 1996, pp. 1182- 1191.
- D. H. Bennett, W. E. Kastenberg and T. E. McKone, “A Multimedia, Multiple Pathway Risk Assessment of Atrazine: The Impact of Age Differentiated Exposure Including Joint Uncertainty and Variability,” Reliability Engineering and System Safety, Vol. 63, No. 2, 1999, pp. 185- 198. doi:10.1016/S0951-8320(98)00046-5
- C. Liu, D. H. Bennett, W. E. Kastenberg, T. E. McKone and D. Browne, “A Multimedia, Multiple Pathway Exposure Assessment of Atrazine: Fate, Transport and Uncertainty Analysis,” Reliability Engineering and System Safety, Vol. 63, No. 2, 1999, pp. 169-184. doi:10.1016/S0951-8320(98)00045-3
- M. MacLeod, A. J. Fraser and D. Mackay, “Evaluating and Expressing the Propagation of Uncertainty in Chemical Fate and Bioaccumulation Models,” Environmental Toxicology and Chemistry, Vol. 21, No. 4, 2002, pp. 700- 709. doi:10.1002/etc.5620210403
- M. J. Citra, “Incorporating Monte Carlo Analysis into Multimedia Environmental Fate Models,” Environmental Toxicology and Chemistry, Vol. 23, No. 7, 2004, pp. 1629- 1633. doi:10.1897/03-516
- K. Fenner, M. Scheringer and K. Hungerbuhler, “Prediction of Overall Persistence and Long-Range Transport Potential with Multimedia Fate Models: Robustness and Sensitivity of Results,” Environmental Pollution, Vol. 128, No. 1-2, 2004, pp. 189-204. doi:10.1016/j.envpol.2003.08.028
- Y. C. Chen and H. W. Ma, “Model Comparison for Risk Assessment: A Case Study of Contaminated Groundwater,” Chemosphere, Vol. 63, No. 5, 2006, pp. 751-761. doi:10.1016/j.chemosphere.2005.08.011
- C. L. Carnahan and J. S. Remer, “Nonequilibrium and Equilibrium Sorption with a Linear Sorption Isotherm during Mass Transport through an Infinite Porous Medium: Some Analytical Solutions,” Journal of Hydrology, Vol. 73, No. 3-4, 1984, pp. 227-258. doi:10.1016/0022-1694(84)90002-7
- M. Thatcher, M. Robson and L.R. Henriquez, “A CIN Revised CHARM III Report. A User Guide for the Evaluation of Chemicals Used and Discharged Offshore, Version 1.0,” Netherlands Ministry of Transportation, Rotterdamseweg, 1999.
- M. Thatcher, M. Robson, L. R. Henriquez and C. L. Karman, “An User Guide for the Evaluation of Chemicals Used and Discharged Offshore: Version 1.2,” CIN Revised CHARM III Report, CHARM Implementation Network (CIN), European Oilfield Speciality Chemicals Association (EOSCA), Aberdeenshire, 2001.
- NRC (Nuclear Regulatory Commission), “Nuclear Regulatory Commission,” Federal Register, Vol. 72, No. 189, 2007.
- M. M. Dillon, “TRNL: Trail Road and Nepean Landfill Sites Final Report for the 2005 Monitoring and Operation Program,” Environment and Transportation Department, Solid Waste Division, Ottawa, 2005.
- Dillon, M. M. and L. Gartner, “TRNL: Trail Road and Nepean Landfill Sites Final Report for the 1995 Monitoring and Operation Program,” Environment and Transportation Department, Solid Waste Division, Ottawa, 1995.
- Dillon, M. M. and L. Gartner, “TRNL: Trail Road and Nepean Landfill Sites Final Report for the 2002 Monitoring and Operation Program,” Environment and Transportation Department, Solid Waste Division, Ottawa, 2002.
- Health Canada, Guidelines for Canadian Drinking Water Quality, Health Canada, Ottawa, 2007. www.hc-sc.gc.ca/ewh-semt/pubs/water-eau/doc_sup-appui/sum guideresres_recom/index_e.html