Smart Grid and Renewable Energy
Vol.4 No.4(2013), Article ID:34030,13 pages DOI:10.4236/sgre.2013.44042
The Effect of Variable Electricity Tariffs in the Household on Usage of Household Appliances
![]()
Household and Appliance Technology Section, Institute for Agricultural Engineering, University of Bonn, Bonn, Germany.
Email: haushaltstechnik@uni-bonn.de
Copyright © 2013 Rainer Stamminger, Verena Anstett. This is an open access article distributed under the Creative Commons Attribution License, which permits unrestricted use, distribution, and reproduction in any medium, provided the original work is properly cited.
Received May 10th, 2013; revised June 10th, 213; accepted June 17th, 2013
Keywords: smart appliances; consumer behaviour; flexible Energy tariffs; demand side management; demand response; cost saving; smart home
ABSTRACT
Demand side management (DSM) has been discussed and investigated widely as a strategy to also influence residential energy consumption. Flexible energy tariffs are often proposed as a possible tool of DSM. However, real-life experience with this tool is rare. It was therefore the objective of this study to investigate under more realistic conditions how consumers are able and willing to adjust their residential energy consumption under the conditions of flexible energy tariffs with and without the support of intelligent smart appliances. Sixty-seven households in Germany within an experimental design with fictive tariff model (August 11 to July 12) driven by RWE Effizienz GmbH, as the energy utility, and Miele & Cie.KG, as the appliance manufacturer, were equipped with intelligent smart meters and 41 of them also with smart appliances (washing-machine and tumble-dryer). As a first part of the experiment, the energy tariff changed per hour and day by day, depending on the forecast of the availability of renewable energy in Germany between 10 EUR-Cent and 40 EUR-Cent per kWh. Consumers could respond to this change by adjusting the operation of their energyconsuming appliances either by themselves or—with the smart appliances—by a programmed start at low tariffs. The behaviour of the 41 consumers with smart appliances and their motivation are intensively investigated and analysed during this running two year project including several questionnaires. The consumers had to fill out daily a diary about the usage of their washing-machine, tumble-dryer, dishwasher and ironing devices. These data were matched with the actual tariff. This did allow identifying if and to which extend the consumers adjust their household activities depending on availability of solar and wind energy. These data were also used to calculate the cost savings by using the flexible tariff. In comparison to the costs of the fixed tariff of 25 EUR-Cent per kWh savings of 25% were realised on average. The results of a first phase already show that flexible tariffs are able to influence the operation of household appliances towards a flexible demand.
1. Introduction
The energy market is changing. On the one hand, there are legislative changes enforcing a competition between the energy utilities triggered by the liberalisation of the common European energy market and, on the other hand, the increased environmental protection of the environment demands the use of electricity from renewable energies, which tend not to be constantly available. This changes the energy market from a demand-driven to a supply-driven market. An intelligent electricity supply network, a smart grid, is needed to counter these challenges. Smart grids are grids which allow all partners, e.g. energy utilities and distributors, to get all the important information which is needed to react to the demand and supply in real-time.
As household appliances in Europe take about 30% of the total electricity demand [1] and many tasks in a household can be shifted in time [2], the consumer can influence the electricity demand to some extent. This possibility can be used in different ways with more or less consumer involvement. This Demand Side Management (DSM) has been discussed and investigated widely as a strategy to also influence residential energy consumption.
There are several methods of introducing DSM by offering dynamic pricing to the customer: Time-of-use tariffs (ToU) induce people to use electricity during periods when consumption is lower. Prices are, therefore, set higher during high consumption periods and vice versa. Real-time-pricing tariffs (RTP) mean an instantaneous pricing of electricity based on the costs of the electricity available for use at the time the electricity is demanded by the customer. Critical-peak-pricing tariffs (CPP) combine a ToU tariff and a dynamic RTP tariff. In a CPP tariff, the energy price varies by a time-variable structure with the objective of reducing absolute load peaks at critical times. Some CPP-tariffs include event days with an additional energy price, e.g. days of extreme high temperatures or system constraints. An inverse form of the CPP tariff is a CPP with a rebate. Participants are paid for the amounts that they reduce consumption below their predicted consumption levels during critical peak hours [3,4].
Several studies have been conducted to investigate the effect of such dynamic pricing showing very different effects and savings ranging from almost 0 up to 45% [5, 6].
As customers have natural limits to react to price signals, e.g. being at work, several methods of appliance automation were developed. In most pilots, the automation is on air conditioners (AC) or electric heating thermostats which are set to turn down or off during peak periods of electricity demand. Automation systems can also include lightning, white goods and entertainment equipment. This automation, in principle, enables fast reactions to pricing signals, but may have severe conesquences for the consumer, as the intended service the appliance is supposed to provide is no longer available.
Various studies with diverse types of intelligent appliances, e.g. controlled thermostats for AC, generated energy savings respectively load reductions by 22% up to 51% (ideally combined with variable tariffs) [7,8].
Another possible tool of DSM is giving feedback about the energy consumption. The role of feedback is to make energy and the consumption of energy visible to the consumers. Darby found out that feedback on energy consumption can influence the energy behaviour of residential consumers and lead to a conserving behavioural effect [9].
In the past, many studies were carried out which looked for energy savings through giving feedback. According to which type of feedback was tested savings of 3.9% up to 9.5% were reported [10,11].
Energy savings of 5% - 12% (detached up to 20%) are the main results of 24 international studies about reductions of energy consumption by giving feedback to the consumers as reviewed by Fischer [12].
It is the aim of this study to find out if and to which extend our panel of 41 households is disposed to shift household activities (washing, drying, ironing the laundry and dishwashing) and energy consumption into times where a lot of solar and wind energy is available, by using a flexible fictive tariff and smart appliances. Another object of this study is to identify the motivations and obstacles for shifting these four operations. This points to the essential question if these households are more interested in reducing their energy consumption to decrease their costs or if it is more important for them to protect the environment in long term by using solar and wind energy? To learn about problems and critical success factors for such kind of flexible tariffs are other important aims of this study. As a further target, the effect of using smart appliances to support a flexible use of appliances will be also investigated.
2. Material and Methods
From April to July 2011 10,000 customers of the energy supplier RWE Effizienz GmbH in Essen and Wesel, Germany, with an electricity consumption higher than 3500 kWh in the previous year were contacted by a leaflet giving them a short outline of the experimental design with a fictive tariff model. In addition the customers were offered one washing-machine (model W 5967 WPS AutoDos or W 5965 WPS) and one tumble-dryer (model T 8967 WP EcoComfort) from the Miele & Cie.KG company in exchange for their present machines for the period of the pilot project. These smart appliances offer the possibility to receive information of the actual energy tariff via power-line connection from a Miele@home gateway installed in the consumer’s home. If the consumer starts those machines in a “smart-start” mode, the machine will wait until the cheapest energy tariff is available or the pre-selected end-time of the programme requires its start. For those consumers, it was guaranteed that the machine always used the cheapest available tariff within the pre-selected time frame. The appliances were provided free of cost for the duration of the study. After this period the households were offered to purchase the appliances half the price.
Sixty-seven households decided to take part in this experimental design with a fictive tariff. A smart meter (model EDL 21) was installed in those households were it did not exists. A smart meter is an electrical meter that records the consumption of electricity energy and transfers this information via powerline communication to the energy supplier for billing. Via a display the consumers are able to watch their energy consumption in real time or of the last 24 hours, 7, 30 or 365 days. Out of those 67 panel members, 41 decided to test the smart washingmachine and 26 of those 41 took a tumble-dryer together with a washing-machine. The focus of this study lies on those 41 households.
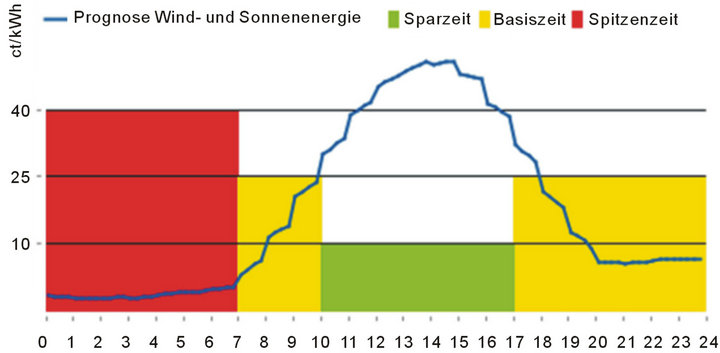
In the first three months of the project (August to October 2011) the tariff stayed fixed at 25 EUR-Cent per kWh, to study the usual behaviour of the panel. For the following nine months up to July 2012 a flexible tariff was offered to the participants. The price for each kWh could change between 10, 25 and 40 EUR-Cent. The tariff was oriented on the availability of renewable electricity as forecasted by the European Energy Exchange (EEX), the renewable energy market in Leipzig, for the coming day1. This forecast was transferred into full hour tariff steps where a high availability would trigger the cheap tariff and a low availability, the expensive tariffs. Set constraints ensured that each tariff step was offered for several hours every day. The information on the tariff offer for the coming day was released each day before via internet and text message (if a participant had decided to get a text message with this information) at 7 p.m. at the latest (Figure 1). The tariff changed day by day.
This tariff, deposited in the smart meter (type EDL 21), was also used for billing the consumer. A form of guarantee was given to the survey participants that the bill under these variable tariff conditions would not be higher than the electricity would cost using the traditional constant tariff. This limited the risk of the panel members having a much higher electricity bill. Savings caused by the variable tariff would be forwarded to the consumer for an amount up to 100 EUR per year by RWE. The panel members were informed about the possible savings or higher costs (avoided) caused by their specific behaviour by looking at their monthly bill.
The pilot test was intensively observed by independent research measures to learn more about the consumers’ behaviour and their motivation. On one hand, questionnaires were used. Before this experimental design starts the survey participants had to fill in the first questionnaire with the presence of an investigator (to respond comprehension questions). It included questions about the socio-demographic background, the motivation and expectations of the panel members. The second questionnaire was send postal in February 2012 containing questions about behaviour changes with energy use in the households or advantages/disadvantage of smart appliances and the fictive flexible tariff. The number of answers varied in part because the panellists didn’t reply to each question. On the other hand, the panel members were asked over the whole time of this experimental design with fictive tariff to fill in a daily diary with hourly information about the usage of their washing-machine, tumble-dryer, dishwasher and ironing device. Information was gathered for each panellist. They had to fill in the actual date and the length of the operation.
 (a)
(a) (b)
(b)
Figure 1. Examples of tariff information given for two days showing expensive (red), basic (yellow) and cheap (green) tariff times (source: RWE).
To transfer these data into cost information, it was assumed that each washing-machine and dishwasher operation used one kWh of electricity, the tumble-dryer used two kWh and one hour of ironing used 0.5 kWh of electricity. Taking this into consideration, the costs for running each appliance could be calculated by combining the usage with the actual tariff at this point in time and summarising this over each month. Dividing this value by the number of operations of this appliance, a cost per appliance operation could be calculated and compared to the costs of the same appliance if a fixed tariff were used (equal to the basic tariff).
A spread sheet and a statistical analyser were used to perform the calculations for the evaluation of the questionnaires. Descriptive statistic parameters like frequencies, averages and standard deviations were calculated. An analysis of correlation to find out the possible linear connection between two variables was also executed. To collect and analyse the diary data a database management system was used.
3. Results
In the frame of this study 41 persons between 30 and older than 70 years filled in the first questionnaire. The biggest part of the sample was built by people between 40 and 59 years (70%). 68% of the interviewed persons were women. Having regard to the living conditions 78% of the panellists are living in their own house or flat. Most of the households are couple households with (42%) respectively without children (34%). The average household size laid by 3.1 persons. 90% declare themselves as “open minded” about technical innovations.
Only about a third of the panel members declared in the first questionnaire to use the start-time delay function of their prior appliances and only three out of four would allow an appliance to operate even though no one was at home. Nevertheless, 98% of the participants would accept shifting the operating time of an appliance if costs thereby could be saved. When asked about the length of the shift, most participants would allow a shift to the night or even up to the next day (Figure 2). If the focus is laid on using more renewable energies, the acceptable shift of the operation in time would be weighted even more towards the next day.
When the panel was asked more deeply about the motivation and was forced to decide either on a cost or environmental motivation, it turns out that the panel was split equally. Nevertheless, cost savings are inherent motivations to take part in this pilot study. When asked about expected saving on the costs for laundry treatment, under the assumption that costs for washing (and drying) are at 50 EUR per year, 35% expected a saving between 0 and 10 EUR per year. 44% expected costs savings between 11 and 20 EUR and 22% of the respondent persons estimated to save more than 20 EUR per year by using the flexible tariff. Washing-machines (100%) and tumble-dryers (90%) are the two most named appliances which the panellists quote to shift in operation time in response to the flexible tariff. Beside those, only the dishwasher (85%) is seen as an additional appliance which may be used more at low tariffs or used less at high tariffs.
After four months of experience with the fictive tariff model in February, 2012, panellists were asked via a second questionnaire about their first experiences: 81% reported on a positive change in their attitude towards energy use in their home, but 46% complained about necessary changes to their usual habits, like using the dishwasher always after dinner, and less flexibility in their time budget. Overall, the positive changes of reducing the costs for electricity (named by 84%) and supporting the use of renewable energy (49%) outweighed the negative impressions, e.g. 19% of the panellists commented on doubts of possible savings (environmental and costs) by using smart appliances. Asked about the advantages of using flexible tariffs, the answers are similar to those about using smart appliances, but with a slightly changed distribution. The possibility of reducing the energy bill is designated by 89%. Other positive effects named were the improving competition of energy suppliers (11%) and the conscious handling of energy (78%). Consequently, 92% of the panellists now use the time-delay or smart-start functions of their appli-
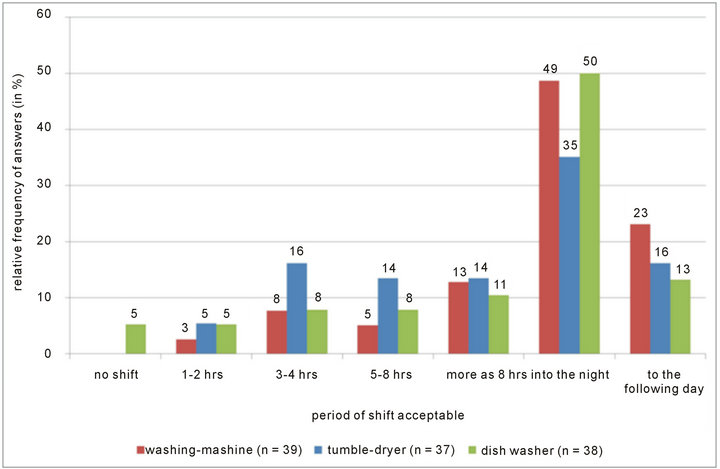
Figure 2. Period of shift of operation acceptable to the panellists if energy costs can be saved.
ances. Overall, as much as 95% of the panellists reported having shifted the operation of their washing-machine and 89%, the tumble-dryer, to adjust to the availability of a cheap tariff, respectively 94% of the panellists shifted the use of their washing-machine and 85% of them delayed the use of the tumble-dryer (Figure 3). However, the operation of other appliances, such as dishwashers and irons, was shifted by two-thirds, respectively 33% of the panellists.
The most important reasons given against a shift of washing-machine, tumble-dryer and dishwasher cycles were that the participants needed the laundry or dishes at the time (32% - 39%) or that the cheap tariff was not available (Figure 4). Nevertheless, in most cases it was not difficult to shift the operation.
The participants were also requested to evaluate how often they shifted the usage of the washing-machine, tumble-dryer, iron, and dishwasher per month. The average of shifted operations was 11 times for the washing-machine, 8 times for the tumble-dryer and dishwasher, and 4 times for the ironing.
Diary data (each appliance cycle noticed with date, time and length) can be used to analyse the consumer behaviour regarding the shifting of the operation of appliances in more detail. Keeping in mind that the time of cheap or expensive tariff can be at any time during a day, a shift of operation from the evening hours to midday can be observed for all appliances compared to the distribution of operations in the fixed tariff (Figures 5-8). This may be due to the culmination of renewable energy (solar and wind) availability during the middle of the day and consequently of cheap tariffs at that time.
More precise information on the real use of cheap or expensive tariffs needs the correlation of the actual consumer habit (from the diary data) to the availability of the different tariffs during each day. The relative usage of the three tariffs, for example, could be calculated for each panellist. This shows, in general, that the cheap tariff is used for operating all the appliances, especially washing and drying, much more frequently than the tariff is available (Figure 9).
The average costs per month of all panellists can be calculated by using the information in the diary and the actual flexible tariff (Figure 1), and can be compared to a hypothetical cost if only a fixed tariff were available. This shows (Figure 10) an average cost of about 4.91 EUR for the electricity for washing-machines if a fixed tariff is assumed, but savings of almost 1.35 EUR due to the shifting of the operation of the washing-machine to those times of the day where the cheap tariff is available. Overall, the saving is 27% of the costs.
The average costs for the electricity for tumble-dryers
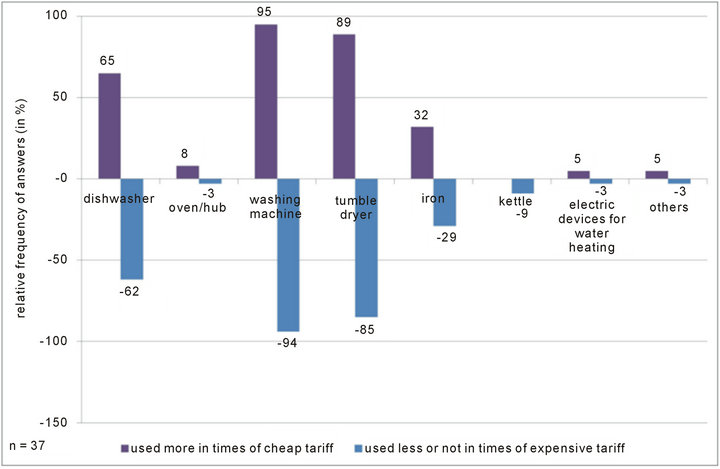
Figure 3. Participants self-evaluation of shifting appliance operation into times of the cheap tariff and out of times of the expensive tariff.
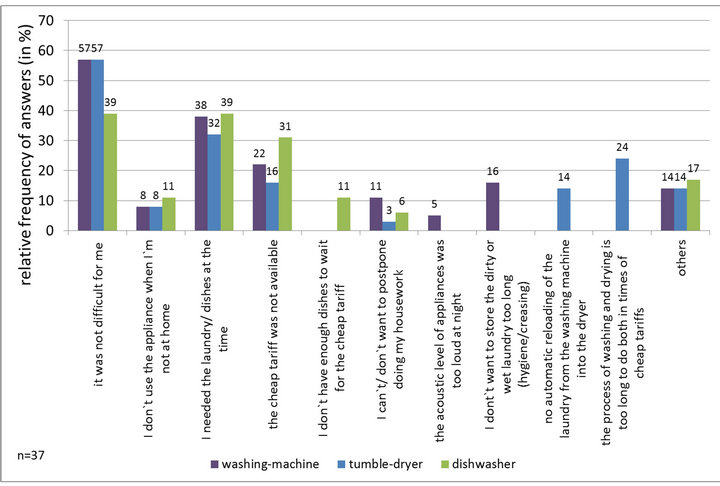
Figure 4. Reasons given against a shift of washing-machine, tumble-dryer and dishwasher cycles.
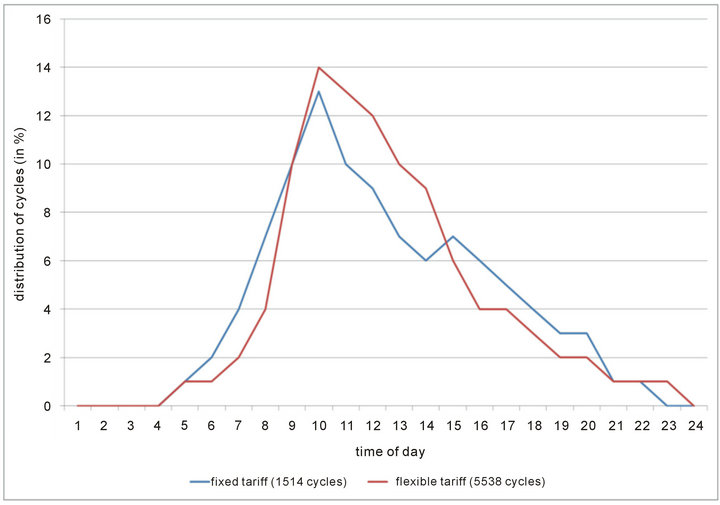
Figure 5. Daytime distribution of the operation of washing before (August to October 2011) and after the introduction of the fictive tariff model (November 2011 to July 2012).
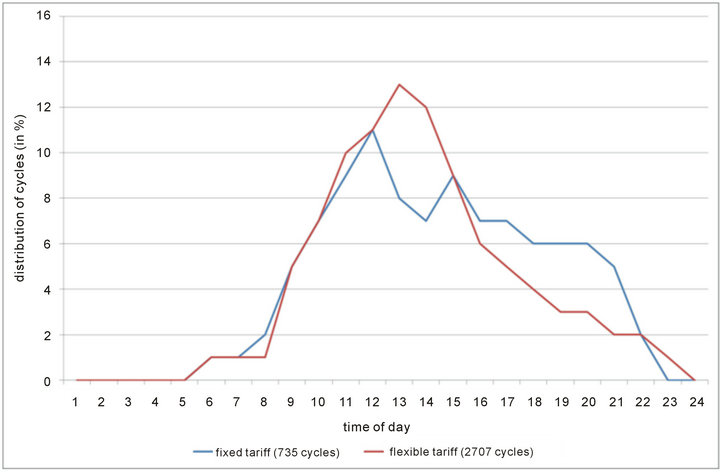
Figure 6. Daytime distribution of the operation of drying before (August to October 2011) and after the introduction of the fictive tariff model (November 2011 to July 2012).
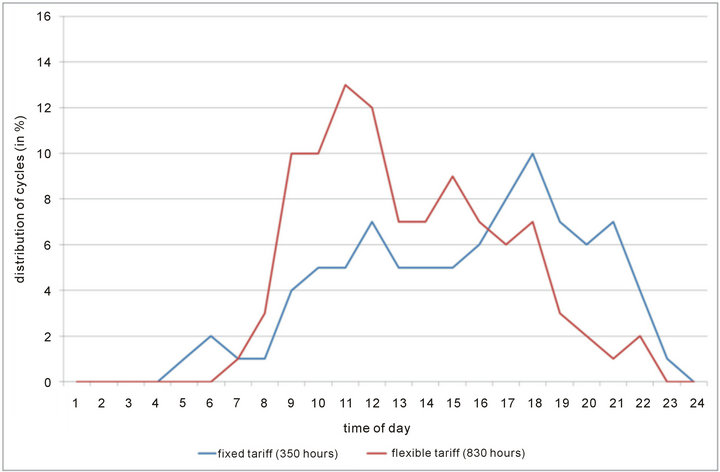
Figure 7. Daytime distribution of the operation of ironing before (August to October 2011) and after the introduction of the fictive tariff model (November 2011 to July 2012).
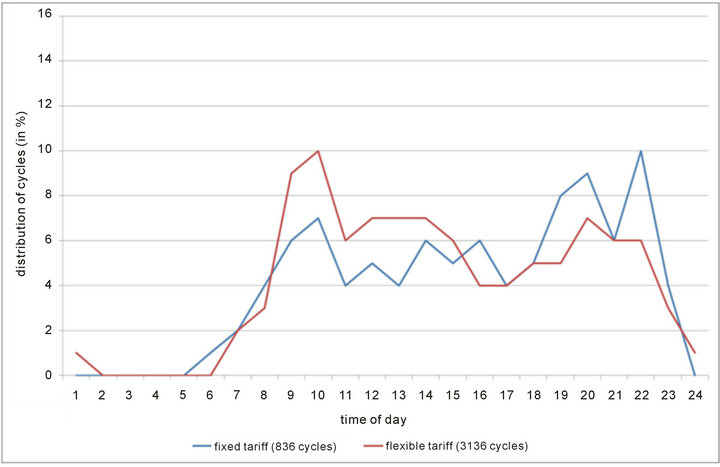
Figure 8. Daytime distribution of the operation of dishwashing before (August to October 2011) and after the introduction of the fictive tariff model (November 2011 to July 2012).
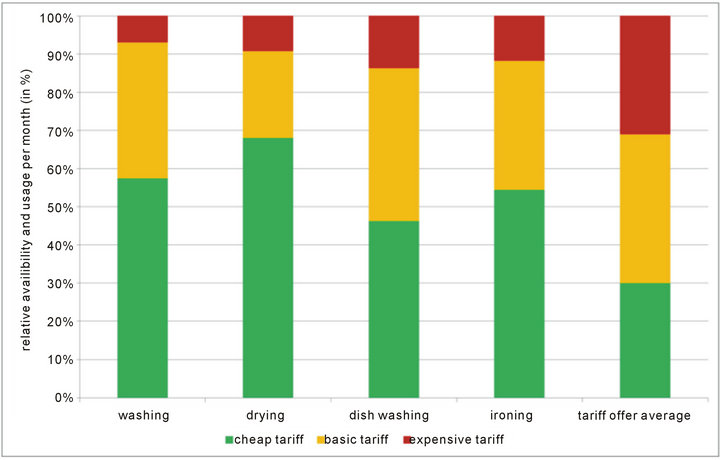
Figure 9. Average of availability of tariff and usage for washing, drying, dishwashing and ironing operations (November 2011 to July 2012).
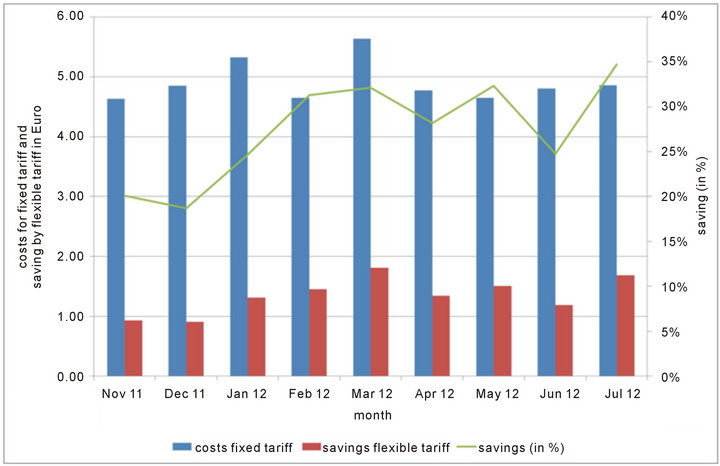
Figure 10. Average energy costs per month for washing and savings (in EUR and %) due to the use of flexible tariff (observed time November 2011 to July 2012).
at a fixed tariff were about 2.46 EUR. Savings of 0.83 EUR were realised by using the flexible tariff. A saving of 34% of the costs was realised on average (Figure 11).
The average electricity costs for dishwashing of about 3.08 EUR assuming the fixed tariff, and savings of about 0.50 EUR by using the flexible tariff were achieved. Due to the shifting of dishwashing into times of a cheap tariff, average savings of 16% had been generated (Figure 12).
Regarding ironing, an average cost of about 1.22 EUR for the electricity if a fixed tariff is assumed was shown, but the participants achieved savings of almost 0.30 EUR due to the shifting of the operation into those times of the day when the cheap tariff was available. Overall, the saving is 24% of the costs (Figure 13).
The actual saving of the individual household per month for washing can be quite different (Figure 14). There are households which utilise the maximum saving of 60% (=(25 ct/kWh – 10 ct/kWh)/25 ct/kWh), but others realise “negative” savings, as they have operated their washing-machines in times of the expensive tariff.
Using the coefficient of correlation by Bravais-Pearson the savings achieved with the panellists’ personal intention of being more driven by costs or environmental motivation, it turns out that the panellists driven by the savings of costs save 32%, while the environmentally driven panellists saved only 28% of the operation costs of their washing-machine. However, this difference is not found to be significant. Using the analysis of correlation for the variables expected savings and achieved savings there no significant difference found out (R2 = 0.0017). The results of correlating the achieved savings and the size of the households (R2 = 0.0014), and also the additional possible savings and the size of the households (R2 = 0.0622), showed no significant difference.
4. Discussion and Outlook
The behaviour of 41 consumers and their motivation to use and accept flexible tariffs and smart appliances are intensively investigated and analysed during this two-year pilot project. The results of the first 12 months show that the main motivation to be interested in such a kind of study is the possibility of reducing the individual costs for electricity. As the possible savings are not overwhelmingly large, this motivation needs to be supported by the motivation to do something good for the environment by using more renewable energy. If this motivation is maintained, the possibility to shift appliance operation to times when cheap (and renewable) energy is available is possible for many households. Considering washing-machines, tumble-dryers and dishwashers as the main appliances whose operation can be shifted, this would allow a maximum shift of 10% of the
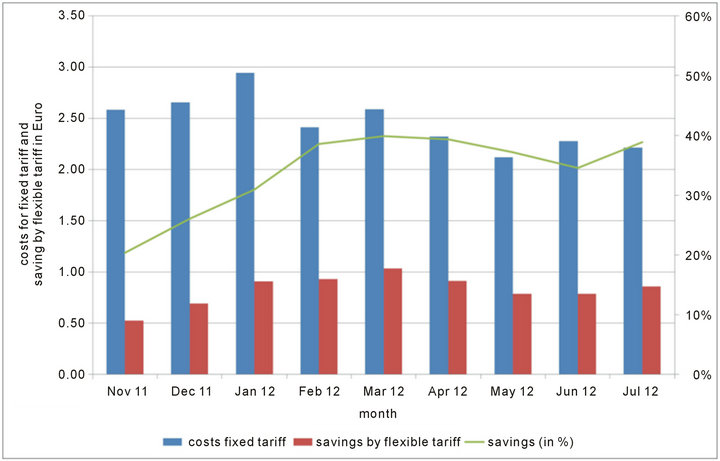
Figure 11. Average energy costs per month for drying and savings (in EUR and %) due to the use of flexible tariff (observed time November 2011 to July 2012).
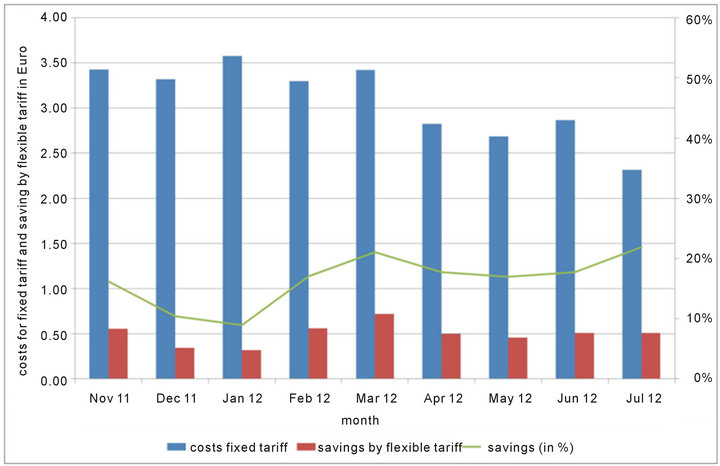
Figure 12. Average energy costs per month for dishwashing and savings (in EUR and %) due to the use of flexible tariff (observed time November 2011 to July 2012).
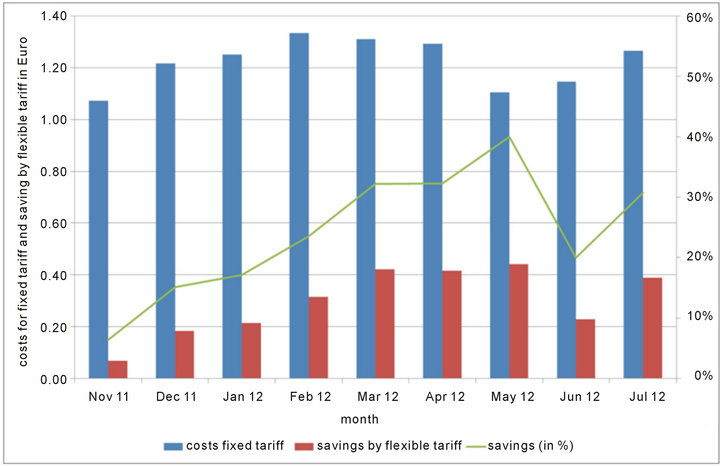
Figure 13. Average energy costs per month for ironing and savings (in EUR and %) due to the use of flexible tariff (observed time November 2011 to July 2012).
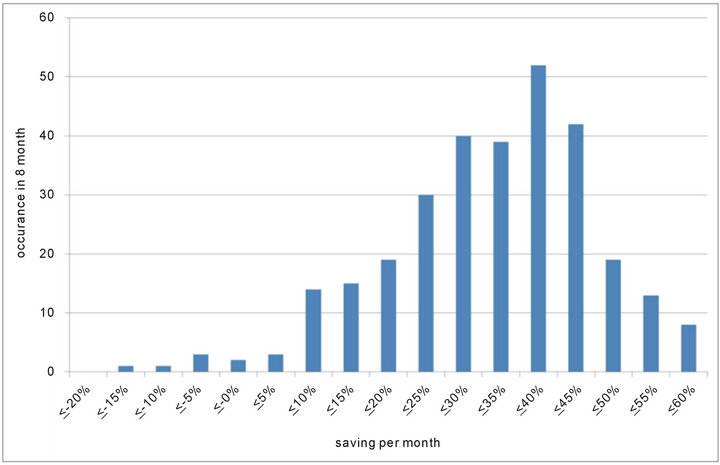
Figure 14. Distribution of the savings per month for washing in per cent of the costs for washing by flexible tariff usage from November 2011 to July 2012 for all panelists.
residential electricity consumption or a maximum shift of 3% of the total electricity consumption (Bertoldi et al., 2012). The experience of this first phase of the pilot project shows that a relevant part of this energy can be shifted by a flexible tariff offer and the use of smart appliances (Figures 5-8). It will be interesting to learn how much more can be achieved when tariffs with a higher spread in the costs of the electricity are offered, which will be studied in part two of this project.
The average savings for all processes recorded by the diaries (washing, drying, ironing, dishwashing) (Figure 15) are remarkable and are in the order of 30% for all laundry-related processes. This may be due to the general flexibility of the execution of these processes in the panellists’ homes. The situation is a bit different regarding the dishwashing, as here, the consumer habit survey has shown that the panellists tend to do it in the evening (Figure 1) when the availability of the cheap tariff is not as high as at other times of the day. Overall, there seems to be no decrease of the saving over time, meaning that the acceptance of the flexible tariff stays at a high level.
On the whole, the average costs of all participating households for the four processes of laundry treatment and dishwashing summed up from November 2011 to July 2012 amounts to 105 EUR when a fixed tariff is assumed. By using the flexible tariff, 28% (almost 27 EUR) of these costs could be saved by the consumers on average. If the panellists had used the cheap tariff exclusively, they could have saved approximately an additional 36 EUR.
Only 41 households take part in this survey. In consequence of the small sample size the transferability of the results to the general population might be restricted. Most of the participants declared themselves as persons with a high environmental awareness. This hypothesizes positive results for shifting the operations in times of the cheap tariff. To find out the changes of behaviour with energy in not environmental driven households might be interesting as well.
Additional studies will be needed to learn about the overall savings in the household, as for most residential electricity consumption it is not possible to shift the operation without a relevant loss of performance or a service, such as cooking, TV or PC usage. Those operations may need to use the expensive tariff which will then reduce part of the energy costs saved by shifting the operation of washing-machines, tumble-dryers and dishwashers. Will the total bill of electricity of each panellist be reduced enough to keep the engagement high, or is there
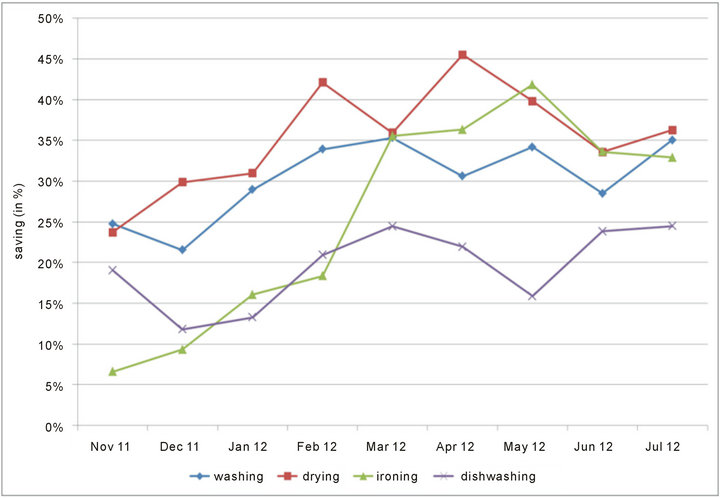
Figure 15. Average of savings per month per household for all process recorded by the diaries in % of costs at a fixed tariff.
a need to maintain the enthusiasm of the panellist by investing in the belief of doing the right thing for environmental protection?
REFERENCES
- P. Bertoldi, B. Hirl and N. Labanca, “Energy Efficiency Status Report 2012,” European Commission, JRC, Scientific and Policy Reports 136, 2012.
- R. Stamminger, “Synergy Potential of Smart Domestic Appliances in Renewable Energy Systems,” Shaker-Verlag, Aachen, 2009.
- C. Nabe, C. Beyer, N. Brodersen, H. Schäffler, D. Adam, C. Heinemann, J. Eder, C. de Wyl, J.-H. vom Wege and S. Mühe, “Einführung von Lastvariablen und Zeitvariablen Tarifen,” Gutachten im Auftrag der Bundesnetzagentur für Elektrizität, Gas, Telekommunikation, Post und Eisenbahnen, 2009
- J. Stromback, C. Dromacque and M. Yassin, “Vaasa ett Global Energy Think Tank,” The Potential of Smart Meter Enabled Programs to Increase Energy and Systems Efficiency: A Mass Pilot Comp 2011.
- EDF. Electricité de France, 2006. http://www.frenchentree.com/france-lot-quercy-services-contacts/DisplayArticle.asp?ID=10263
- Charles River Association, “Impact Evaluation of the California Statewide Pricing Pilot,” Final Report, Charles River Association, 2005. http://sites.energetics.com/madri/toolbox/pdfs/pricing/cra_2005_impact_eval_ca_pricing_ pilot.pdf
- Gulf Powerm “Gulf Power: A Southern Company,” http://www.gulfpower.com/energyselect/program_overview.asp
- Rocky Mountain Institute, “Automated Demand Response System Pilot,” Prepared by Rocky Mountains Institute, Boulder Colorado, 2006, http://sites.energetics.com/MADRI/toolbox/pdfs/pricing/ca_automated_dr_sys.pdf
- S. Darby, “The Effectiveness of Feedback on Energy Consumption,” Environmental Change Institute, Oxford University, 2006.
- M. Haakana, L. Sillanpää and M. Talsi, “The Effect of Feedback and Focused Advice on Household Energy Consumption,” Proceedings of the Summer Study of the European Council for an Energy Efficient Economy, 1997.
- J. Schleich, M. Klobasa, M. Brunner, S. Gölz, K. Götz and G. Sunderer, “Smart Metering in Germany and Austria: Results of Providing Feedback Information in a Field Trial,” Working Paper Sustainibility and Innovation No. S 6/2011, 2011.
- C. Fischer, “Feedback on Household Electricity Consumption: A Tool for Saving Energy?” Energy Efficiency, Vol. 1, No. 1, 2008, pp. 79-104. doi:10.1007/s12053-008-9009-7
NOTES
1http://www.transparency.eex.com/de/daten_uebertragungsnetzbetreiber/stromerzeugung/erwartete-produktion-solar http://www.transparency.eex.com/de/daten_uebertragungsnetzbetreiber/stromerzeugung/erwartete-produktion-win