Energy and Power Engineering
Vol.06 No.14(2014), Article ID:52878,6 pages
10.4236/epe.2014.614048
1D/3D Coupling Calculation Analysis on Bus Cooling System
Kai Shen, Feihong Li, Jimin Ni
School of Automotive, Tongji University, Shanghai, China
Email: generalsk@163.com
Copyright © 2014 by authors and Scientific Research Publishing Inc.
This work is licensed under the Creative Commons Attribution International License (CC BY).
http://creativecommons.org/licenses/by/4.0/


Received 26 September 2014; revised 20 October 2014; accepted 18 November 2014
ABSTRACT
Compared with front engine vehicle, the windward side’s flow field in cooling model of rear engine bus is complicated and it can’t be calculated by means of 1D model. For this problem, this paper has used Star-CCM to build a 3D simulation model of cooling system, engine compartment and complete vehicle. Then, it had a 1D/3D coupling calculation on cooling system with Kuli software. It could be helpful in the optimization design of the flow field of rear engine compartment and optimization match of cooling system.
Keywords:
1D/3D, Coupling Calculation, Bus Cooling System, Rear Engine Compartment

1. Introduction
The engine cabin is a hemi-closure space and there are cooling system, engine and inlet and exhaust system, transmission, air conditioning, hydraulic equipment and other system in it. The layout structure is very compact. There are many components such as intake grid, condenser, intercooler, radiator, wind guide cover, fan and exhaust path on the cooling path of engine cabin. The study on the airflow in vehicle mainly includes the study on the flow resistance of engine cabin, heat dissipation and aerodynamics of the outside of vehicle. The “air-side” in the thermal management system is the airflow of the engine cabin and the study on the airflow is to research the air flow and heat transfer among the components including engine in the cabin. It aims to reduce the hot air recirculation, decrease the airflow resistance of engine cabin and provide enough air for cooling system and other components which need to be cooled [1] .
The Moffat in Ford used the “union simulation” technique, with the Flowmaster and UH3D software, to study on the transient characteristics of the vehicle thermal management system. By comparison with the results of tests, the simulation precision of this method is checked. It could be over 95% [2] . The Takeuchi in Mitsubishi simulated the performance of air-condition system which are under various working conditions, with the help of CFD and mathematical model of 1D thermal balance model [3] . In 2004, the Jonson and others in Volvo did the numerical simulation with the fluent software to improve the performance of thermal management system in the development process of new car. They adopted the special prepared radiator program and had coupling calculation, which considered the flow and heat transfer of radiator. The temperature deviation of cooling water between the simulation and the actual temperature was less than 4˚C and would be increased in the condition of low-speed [4] . Williams in Ford did research on gas punch effect and the effect of gird, condenser, radiator, wind guilder cover, fan, engine cabin and bottom of vehicle on the flow resistance. Their results showed that vehicle inlet projected area and the airflow distribution were the key parameters which influenced the aerodynamic characteristics of cooling model. The airflow had no relevance with the installation of fan or fan hub and the exhaust resistance of the cooling system is just a smaller proportion of the whole resistance [5] . Knaus and others in Behr did some numerical simulations one engine cabin by means of combination of one-dimensional software BISS, which was independently developed, and three-dimensional software UH3D, Star-CD [6]. The results showed that both three-dimensional softwares could simulate relatively close to the actual result and Star-CD had a higher precision. In 2006, Alajbegovic used the Boltzmann equation to solve the entire vehicle flow and heat transfer. They simulated the flow and heat transfer of external liquidity of the bus engine cabin. The results showed that the simulation value is very close to the true value [7] .
Thus, more and more car companies and research institutions are using CAE technology to study the airflow and heat transfer of engine cabin or inside and outside of vehicle, with accurately and effectively using CAE technology. It can save a lot of time and costs.
One-dimensional and three-dimensional coupling calculation is to calculate the inside and outside flow field of vehicle with three-dimensional software at first. And then, it calculated the one-dimensional system performance with boundary conditions, which was obtained in three-dimensional calculation that made the results more refined more accurate than original single boundary conditions.
For rear engine buses, the cooling air enters the engine cabin from the side grille, with the cooling fan’s suction effect. The radiator surface has a more complex flow field, which the velocity distribution in it is very uneven. Using one-dimensional model to calculate makes the results have a large deviation. So we need to use the 1D/3D coupling simulation method to make the calculation results more accurate.
2. Three-Dimensional Computational Model and Results
There are lots of complicated components in engine cabin of bus, not only includes the engine body, the parts cooling system, but also air-conditioning compressor, air cleaner, the gear pulley system and a variety of different materials, pipes, lines and so on. If all the components in the engine compartment need simulation calculation, not only the size of the actual geometry of the model will be not available, but also will increases the difficulty of meshing, and the computer hardware and software requirements will be very high. Thus only the geometries of large parts in the cabin are retained in the calculation, and the pipes and lines have been simplified.
The assembly of the various components was finished in CATIA, and final assembly model shown in Figure 1.


Figure 1. Bus assembly model.
A closed computational domain was established to calculate the bus model shown in Figure 2. Taking into account the distortion of the actual bus tires, the computational domain ground elevation was raised 20 mm.
Meanwhile, ensure the accuracy of computing, using the local mesh refinement approach, which solute the difficult of coarse mesh could not identify the smaller size barrier. The total number of the final mesh is about 5 million shown in Figure 3.
Figure 4 showed the body surface pressure distribution at the speed 90 km/h. Due to the blocking effect of bus front, a significantly higher pressure region was formed in the lower part of the front wall.
The pressure on bus body side and top surface was smaller and more evenly distributed. But the pressure on bus rounded edge was significantly reduced. That pointed out resistance was reduced at right angles to the bus edge.
Figure 5 showed the horizontal flow field distribution at 1 m height in engine compartment.
In the cooling fan suction, the air through grille on the left is much more than grille on the right. It means that, even at high speed, the suction fan is still the main source of cooling air to rear engine bus.

Figure 2. Closed computational domain of bus.

Figure 3. Local mesh refinement.

Figure 4. Bus body surface pressure distribution.

Figure 5. Horizontal flow field of engine compartment.
3. One-Dimensional and Three-Dimensional Coupling Calculation Model
One-dimensional vehicle thermal management simulation model was established based on the air side and the coolant side of real vehicle. The specific model was shown in Figure 6.
Because this study model is a rear engine compartment bus, its air side model could not simply be calculated according to the one-dimensional simulation of the front of the engine compartment vehicle. For the inhomogeneity of wind speed on the cooling module surface, the only calculation method was three-dimensional and one- dimensional co-simulation method.
The contours chart of wind speed distribution on the cooling module surface with Star-CCM at speed 90 km/h of the bus was shown in Figure 7. In order to reduce computation time, the wind speed contours chart was translated to a 44 × 40 matrix without lowering the calculation accuracy. Figure 8 showed the matrix of wind speed distribution on the cooling module surface, which would import Kuli.
4. Results and Discussions
Importing the wind speed distribution matrix shown in Figure 8 into the one-dimensional model in Kuli could calculate the parameters of the cooling system.
Figure 9 is the measured and calculated values of the import and export of water temperature in radiator. And the calculation error of the import and export of water temperatures were 3.4% and 2.4%, respectively.

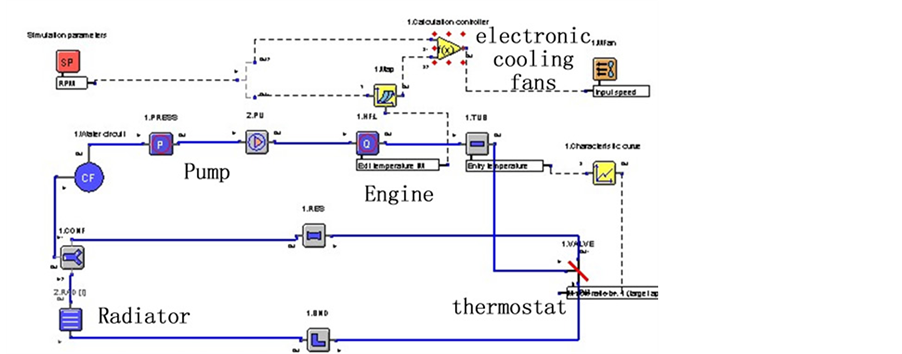
Figure 6. One-dimensional vehicle thermal management simulation model.

Figure 7. Contours chart of wind speed distribution on the cooling module surface.
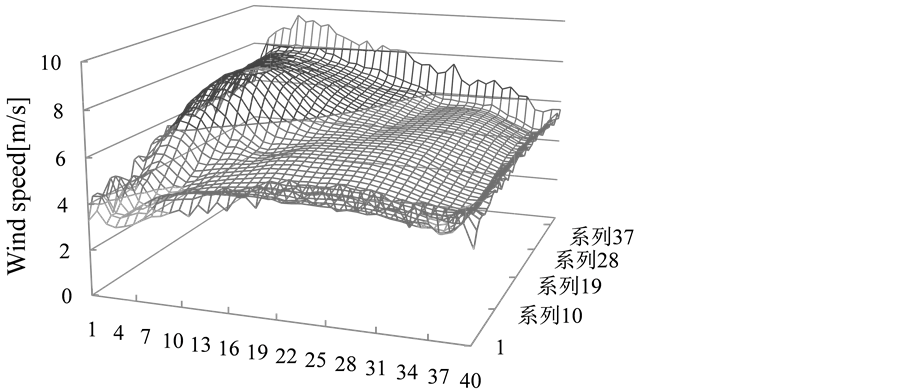
Figure 8. Matrix of wind speed distribution.

Figure 9. Measured and Calculated Temperatures.
The calculated and measured value of water temperature have a certain error, because the calculation model ignores some secondary factors like the effect of heat transfer of the surface of the cooling water pipes, but the results are in an acceptable error range. The error of the one-dimensional model in Kuli, radiator calculation program and experimental is small, and they all have the same trend, thus we can ensure the accuracy of the calculation model.
5. Conclusion
Because the flow field of the rear engine cabin of the passenger car is much more complicated than the front’s, the error is very lager if using the 1D model directly like we did in front engine cabin to simulate the cooling system. The Studies show that only the one-dimensional and three-dimensional coupling calculation method could make the results of the calculation of rear engine bus cooling system more accurate and it is much more suitable for engineering development and application.
References
- Subhashini, R., Balaji, B., Murthy, B.B., et al. (2009) Minimization of Hot Air Re-Circulation in Engine Cooling System. SAE Technical Paper, 2009-01-115.
- Moffat, J. (2002) Coupling of 1-D and 3-D CFD Models to Predict Transient Hydraulics in an Engine Cooling Circuit. SAE Technical Paper, 2002-01-1285.
- Takeuchi, T., Kakishita, N. and Kohri, I. (2002) The Prediction of Refrigeration Cycle Performance with Front End Air Flow CFD Analysis of an Automotive Air Conditioner. SAE Technical Paper, 2002-01-0512.
- Jerhamre, A. and Jonson, A. (2004) Development and Validation of Coolant Temperature and Cooling Air Flow CFD Simulations at Volvo Cars. SAE Technical Paper, 2004-01-0051.
- Williams, J., Karanth, D. and Oler, W. (2002) Cooling Inlet Aerodynamic Performance and System Resistance. SAE Technical Paper, 2002-01-0256.
- Knaus, H., Ottosson, C., Brotz, F., et al. (2005) Cooling Module Performance Investigation by Means of Underhood Simulation. SAE Technical Paper, 2005-01-2013.
- Alajbegovic, A., Sengupta, R. and Jansen, W. (2006) Cooling Airflow Simulation for Passenger Cars Using Detailed Underhood Geometry. SAE Technical Paper, 2006-01-3478.