Energy and Power Engineering
Vol. 5 No. 4 (2013) , Article ID: 33278 , 10 pages DOI:10.4236/epe.2013.54033
Knowledge and Perceptions of Energy Alternatives, Carbon and Spatial Footprints, and Future Energy Preferences within a University Community in Northeastern US
1Division of Life Sciences, Consortium for Risk Evaluation with Stakeholder Participation, Environmental and Occupational Health Sciences Institute, Rutgers University, Piscataway, USA
2Consortium for Risk Evaluation with Stakeholder Participation, Environmental and Occupational Health Sciences Institute, Environmental and Occupational Medicine, Rutgers Medical School, Rutgers University, Piscataway, USA
Email: *burger@biology.rutgers.edu
Copyright © 2013 Joanna Burger, Michael Gochfeld. This is an open access article distributed under the Creative Commons Attribution License, which permits unrestricted use, distribution, and reproduction in any medium, provided the original work is properly cited.
Received February 2, 2013; revised March 4, 2013; accepted March 11, 2013
Keywords: Energy Sources; Preferences; Survey; Ecological Footprint; Carbon Footprint; Spatial Footprint
ABSTRACT
Our overall research aim was to examine whether people distinguished between the spatial footprint and carbon footprint of different energy sources, and whether their overall “worry” about energy types was related to future developed of these types. We surveyed 451 people within a university community regarding knowledge about different energy sources with regard to renewability and spatial and carbon footprints and attitudes about which energy type(s) should be developed further. Findings were: 1) Gas, oil and coal were rated as the least renewable, and wind, solar and hydro as the most renewable; 2) Oil and coal were rated as having the largest carbon footprint, while wind, solar and tidal were rated the lowest; 3) There were smaller differences in ratings for spatial footprints, probably reflecting unfamiliarity with the concept, although oil and gas were rated the highest; 4) Energy sources viewed as renewable were favored for future development compared with non-renewable energy sources, and coal and oil were rated the lowest; 5) Worry-free sources such as solar were favored; and 6) There were some age-related differences, but they were small, and there were no gender-related differences. Overall, subjects knew more about carbon footprints than spatial footprints, generally correctly identified renewable and non-renewable sources, and wanted future energy development for energy sources which were less worried about (e.g. solar, wind). These perceptions require in-depth examination in a large sample from different areas of the country.
TABLE I. 1. Introduction
TABLE II.
Public knowledge about environmental issues can affect attitudes and beliefs about pollution, development, and environmental protection [1,2]. Recently, many environmental concerns have focused on energy, renewable energy options, and the environmental costs of different energy options [3-5]. Carbon footprints have received great attention, but ecological footprints have received less. The calculation of ecological footprint of fuel types is complicated and consists of three main components: area needed for energy production (including mining and processing), area needed to sequester emissions of greenhouse gases, and the area needed for safe deposition of nitrogen, sulphur and other waste products [6,7]. These usually translate into carbon equivalent emissions, using global warming potential recommended by the International Panel on Climate Change [8]. Calculations of carbon equivalent emissions quickly lead to discussions of sustainability, production capabilities, and alternative fuels [7,9-11].
These discussions have involved the public, and there are assessments of how the public views energy sources and renewable energy [2,12-15]. Many papers examine one type of energy or another, or report support for renewable energy in general [2,13]. Nuclear power has received much attention because of controversy surrounding safety, environmental risk and public opposition [16,17]. With nuclear, siting issues, population density, accidents and emergency routes are concerns [18- 22], as large as concerns about proximity to nuclear facilities [16,23-24]. While the carbon footprint of different energy sources has figured prominently in these discussions [3,5,8], spatial footprint has not. That is, perceptions of the actual size required for different energy sources have not been examined.
Our overall aim was to explore whether people understood the relative size of the spatial footprint (and carbon footprint) of different energy sources, how much they worried about different energy sources, and whether their worry was related to which energy sources they thought should be further developed. We define spatial footprint as the actual physical space needed to support a given energy type—how much land is required for a wind or solar farm, or how much land is required for a nuclear power plant or a hydroelectric plant? This paper also examines the hypothesis that there is a relationship between perceptions of possible harm (personal worry) and the energy sources favored for development. Six questions are addressed: 1) What are perceptions of the relative size of the spatial footprint of different energy sources; 2) What are perceptions of the carbon footprint of different energy sources; 3) Which energy sources are renewable; 4) What is their overall worry rating for each energy source; 5) Which energy sources would they like to see developed; and 6) Are there any age-related differences in these perceptions?
We surveyed 451 students and non-students in a university community in central New Jersey in 2011. The energy sources listed in the survey were natural gas, nuclear, coal, solar, wind, tidal, hydro, oil, and geothermal, although worry was not addressed for the last two. We test the null hypotheses that: 1) there are no significant differences in perceptions about spatial and carbon footprints among energy sources; 2) there are no significant differences in ratings for energy sources to be further developed; 3) there are no age-related differences in these perceptions; and 4) there is no relationship between overall worry and energy sources to be further developed. Any findings apply to the study population, sampled at one time, and are meant to serve as a basis for further study in other communities and countries. Our data thus reflect local, rather than global perceptions, and thus can be related to local development or lack thereof. Even when people support particular technologies, they often do not accept them within their own community [e.g. 23,25], although Greenberg [2] reported that people living near nuclear facilities favored more development of nuclear than the general population. Greenberg also found age-related differences in that older respondents were more likely to support increasing reliance on coal, gas, oil and nuclear power than younger respondents. For this reason, we examined age in our study.
Information on the public’s views deal with perceptions or worries about renewable and non-renewable energy, rather than on their knowledge base [2,16]. Dalton et al. [26] surveyed tourist attitudes about renewable energy use in a hotel, and found that about 50% favored renewable energy, such as wind, but wanted to see onshore rather than offshore development. There is often a gap between perceptions of preferred energy types, and siting acceptance [23,27]. Others have focused on economic valuation of land for sustainable development [28].
Social trust is critical in risk/benefit decisions about environmental safety and health [20,29], but so is knowledge. Based on 239 published studies, Beierle [30] found that involving stakeholders in decisions resulted in higherquality decisions, but only if the public had a sufficient information base about alternatives. Reversing public opposition requires both understanding of public views and knowledge about the issues, as well as appropriate steps to obtain public approval [24,30], although knowledge does not always change attitudes [15,23,25]. Understanding public perceptions and knowledge about energy sources is a first step in involving the public and other stakeholders in decision-making, leading to better environmental decisions [30,31]. While positive perceptions of energy types may not lead to acceptance of facilities at a local level [25,32], information on future energy type preferences and perceptions of worry can inform decision-makers. Other concerns, such as housing values, noise, and unsightliness, also influence personal decisions [13, 33,34].
The concept of ecological footprints is older than that of carbon footprints, and deals with a resource accounting tool that measures how much productive land and sea is appropriated for a given human use (e.g. the footprint) [35]. In this paper spatial footprint is used to denote the physical space needed to operate a given energy source.
2. Methods
The overall protocol was to interview students (aged 18 - 22; N = 196) and others (over age 22; N = 255) living and working in a university and surrounding community (restaurants, bus stops) in central New Jersey, to examine knowledge and views of different energy options. Interviews took place from 1 April to 15 May 2011. Subjects were selected by approaching the first person encountered, and then approaching the third or fourth person encountered thereafter. Although this approach is not completely random, there is no reason to assume biases. Interviewers identified themselves as from Rutgers University, gave a brief description of the study, and answered all questions following the interview. Refusal rate was less than 5%, and people refused because they were late for class or other appointments, had small children, or were rushing to board a bus. The interviews required about 20 minutes; many were longer due to subject’s questions or comments about energy and politics which were allowed after the survey was completed. The protocol was approved as exempt by the Rutgers Institutional Review Board.
The questionnaire contained 4 parts concerning: 1) the relative size of the carbon footprint and the spatial footprint [on a scale of 1-5]; 2) whether each energy source was renewable or not; 3) how much they worried about different energy sources and favored further development of each energy source for the United States; and 4) demographics. Carbon footprint was defined as the relative amount of carbon emissions per kilowatt hour (kwh) of electric output, and spatial footprint was defined as how much land was required per kwh. Demographics included gender and age. A pilot survey of 10 students indicated that their ratings were not significantly different on two different days. There were no clear gender differences using Kruskal-Wallis non-parametric Analysis of Variance (P > 0.10 for comparisons), so gender is not discussed further.
We focused on nine energy sources: coal, oil, natural gas, solar, wind, tidal, nuclear, geothermal and hydroelectric. On a scale of 1 to 5, respondents were asked in a forced choice manner to rate from “low” to “high” the size of the carbon footprint and spatial footprint separately for each energy source. Respondents were also asked separately whether each energy source should be developed more in the US from “not at all” to “a lot” , and were asked “How worried are you about….,” emphasizing individual rather than societal concern.
The “worry” question covered six of the energy types (oil, geothermal, and tidal were not on the worry question). Geothermal and tidal are not used in New Jersey and surrounding states, and oil accounts for only 1% of US electricity production [27]. The “worry” questions explored direct individual concerns including impacts on food, water, exposure of workers in the source facility, and exposure of wildlife from the facility. Exposure referred to radiation or radionuclides from nuclear facilities, mercury from coal-fired plants, carbon dioxide and sulphur emissions, and noise. Ratings were on a Likert Scale of 1 (no concern) to 5 (great concern). A composite worry index (mean score of the different worries) was computed from each energy source. On the pilot study, there was not a significant difference (Kruskal-Wallis tests, P > 0.05) on ratings for two different days.
Kruskal-Wallis non-parametric Analysis of Variance was used to compare estimates of renewability, spatial footprint, carbon footprint, worry and desirability across energy types, and also to analyze by age (up to age 22 versus 23 or older). A P < 0.05 was considered statisticcally significant, but readers should keep in mind the multiple comparisons inherent in this design.
3. Results
3.1. Carbon and Spatial Footprint
Across the nine energy types there were significant differences in the estimates of the carbon and spatial footprint ratings (Figure 1, statistics given on figure). The differences were dramatic for carbon footprint, and subtle for spatial footprint. For carbon footprint, coal and oil were rated highest and hydro, wind, tidal and solar were rated the lowest, and results generally matched our own understanding. There were no age-related differences in the ratings. We concluded that most respondents had a basic understanding of carbon footprint.
For spatial footprint, there was little variation in the scores, hovering around 3 - 3.5, probably reflecting a
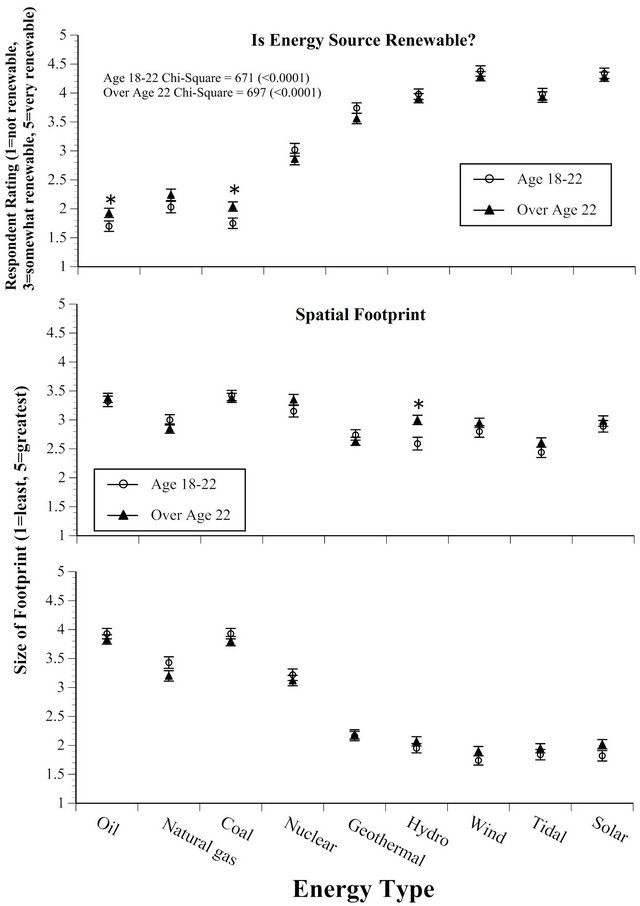
Figure 1. Ratings of people in a university community in central New Jersey about the relative size of the spatial and carbon footprints of different energy types. Shown also (bottom panel) are the ratings for whether an energy source is renewable or not. For the footprints, 1 = smallest, and 2 = largest. Shown are means ± standard error. Star equals significant age-related difference.
lack of knowledge about spatial footprint—a concept generally ignored in media coverage. Indeed only 32% of responses gave a 1 or 5 compared with 54% for carbon footprint (χ2 = 7.12; P < 0.01). In general, subjects thought coal, nuclear, and oil had the largest spatial footprint, and geothermal, hydroelectric, and tidal had the smallest. The only age-related difference was for hydro, where older people thought hydro had a larger footprint than did younger people (Figure 1).
3.2. Renewability of Resources
There were significant differences in whether subjects rated energy sources as renewable or not (Figure 1, top panel). Generally, oil, gas and coal were rated as nonrenewable, with nuclear and geothermal in the middle. However, there was not a clear dichotomy; some respondents provided intermediate ratings. There were only two significant age-related differences. Older subjects rated oil and coal as more renewable than did students.
3.3. Energy Sources for Future Development
Subjects were asked to rate their views about which sources should be developed more in the United States. On Figure 2, we illustrate the percentage of subjects that rated each energy type a 1 (“do not develop” bottom panel) or a 5 (develop further, top panel). The energy source that had the lowest mean rating for future development was coal, followed by oil and nuclear, then by natural gas. The energy source with the highest rating was solar, followed by wind. Thus, people felt most strongly about developing solar, and not developing coal, than for the other energy sources. There were few age related differences. More young people were negative about oil and natural gas than were older people (Figure 2).
3.4. Overall Worry Rating
There were significant differences among energy type in the overall rating of worry (Figure 3, top panel). Nuclear had the highest worry index, followed by natural gas, and coal. People were less worried about wind, and solar (Figure 3). Generally, older people were more worried about more forms of energy (5 out of 6 categories, binomial 2-tailed p = 0.125) than were younger people, although the differences were significant only for nuclear. Although older subjects were more worried about nuclear, this was not reflected in the future development question.
The factors in the worry index included transportation risks, exposures from the plant or facility, exposure from food or water, exposure of workers, and exposure of wildlife. We also computed the mean worry score for each type of worry for all energy types combined. There
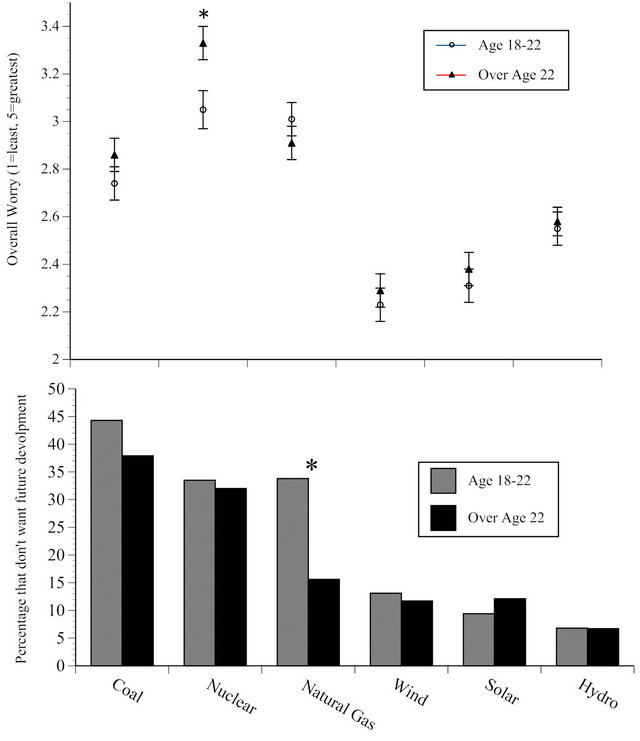
Figure 2. Percent of people wanting to see a particular energy type developed more in the future (rating of 5 of 5) and percent not wanting to see any future development (rating of 1 of 5). Star indicates significant age-related difference.
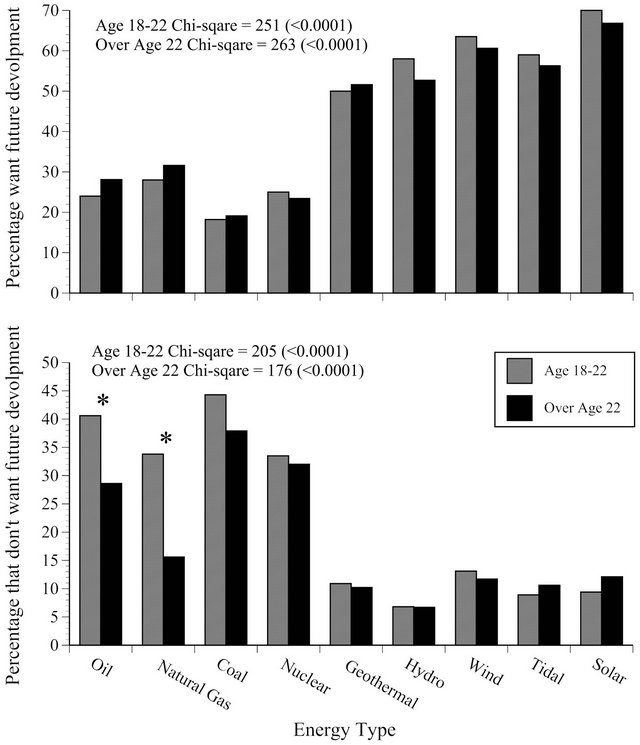
Figure 3. Overall worry score or index for different energy sources for college students (open circles) and people over 22 (black triangle). Shown are means ± standard error. Star equals significant age-related difference.
were significant differences, with people being more worried about risks/exposures to food (mean of 3.12 ± 0.05) and wildlife (mean of 3.03 ± 0.05) than they were for workers (2.67 ± 0.05) and from the facility itself (2.49 ± 0.04). Other components scored even lower. Older respondents were significantly more worried about exposure from the plant itself, and from transportation, than were younger people (X2 tests, P < 0.05).
The relationship between overall worry and energy types subjects did not want to develop, is also shown in Figure 3. Although generally related, people did not want to see coal developed further, even though they were less worried about coal than for either nuclear or natural gas. In contrast, people were more worried about hydro than their response on future development would suggest.
In summary, the null hypotheses were rejected with respect to all questions. There were significant differences as a function of energy type in rating of relative spatial and carbon footprint size, understanding of renewable energy, perceptions of which energy source to develop, and in overall worry about different energy forms. The relationship between overall worry and the percentage of people who do not want future development were generally related, except for coal (Figure 3). There were few age-related differences.
4. Discussion
This study tested both knowledge and perceptions, and inevitably revealed some misconceptions regarding energy and climate. A 2011 report from the Yale University Center on Climate Policy reported that 90% of respondents identified development of clean energy and 70% rated global warming as medium, high, or very high priority for the country, even to the point that 65% supported a “carbon tax” [36]. A 2012 report for the World Energy Summit found that American concerns for energy security and the economic impacts of energy choices ran high, accompanying an interest in renewable and alternative energy sources [37]. The report reflected a strong interest in incentivizing renewable energy, based on both environmental and economic concerns [37]. Thus it is reasonable to predict that students and residents in a University town would have at least a basic understanding of these issues and their relationships. Further, one might expect younger people to have a greater understanding because they are still in school and exposed to some of these issues [see 2].
4.1. Carbon and Spatial Footprints
In this survey we asked specifically about “carbon footprint” and “spatial footprint” rather than ecological footprint, a more complex and controversial construct [8]. Understanding carbon footprints, reducing carbon emissions, and reversing global climate change is one of the foremost current ecological and media issues. Considerable attention has been given to examining global drivers, and to the need to reduce emissions from fossil-burning fuel (for electricity and transport) and industrial processes that have been accelerating rapidly [3,20]. The currency for these discussions is “carbon footprint’, which relates to the amount of carbon released as carbon dioxide per unit (typically per kilowatt hour). Carbon is released by the burning of all types of fossil fuel and the carbon/kwh depends on the thermal density of the fuel, the efficiency of the combustion process, and air pollution control devices (although the latter only redirect the carbon from air to some other disposal process).
We expected respondents to have at least a basic grasp of the general issue of carbon associated with familiar energy types, since this has received extensive media attention. Respondent rankings correspond well to our own expectations, including the recognition that geothermal emits more carbon (in addition to sulfur) than other “renewable” sources [38]. Their ratings were generally correct despite the fact that neither hydrothermal nor hydro are used in New Jersey and thus the ratings do not reflect local experience.
Determining spatial footprints is difficult because of differences in the physical environment. This topic gets little media coverage, and not surprisingly respondents seemed unfamiliar with the concept, judging by their middle-of-the-road responses. A few examples of the complexities of spatial footprint will suffice: 1) slope, updrafts and local geography influence how many wind towers can be efficiently placed on a given amount of land, 2) the size and depth of the thermal field determines how much electricity can be generated from the field, and 3) weather patterns and latitude influence solar capacities, and how many solar cells are needed, facing in what directions, and how much energy is required to rotate them. For solar, the spatial footprint on a roof can be discounted compared to the usurpation of otherwise productive agricultural acreage or natural landscape. In the production of energy from biomass (not examined in this study), a water footprint must be considered since different plants (crops) require different amounts of water to produce a unit of energy [39], and the release of carbon from biomass burning varies by crop type [40].
Further, determination of both carbon and spatial footprints depend upon whether only direct footprints are considered, or indirect are as well. For example, the direct footprint of a hydropower generation plant includes the occupied area of the dam and plant, the build-up of land surrounding the facility, and the flooding of land behind a dam. Indirect effects include machinery production, building materials, what workers require to run the plant and the energy (either from hydro or fossil fuel) that is required for all machinery and materials to run to hydropower plant. Similarly, the direct footprint of a nuclear plant is the land area occupied by reactors, other buildings, storage pools and pads, as well as buffer areas. But the area involved in mining and processing, and ultimately the off-site disposal or reprocessing of spent fuel rods must be considered. Surface mining versus underground mining, and surface disposal (currently on site) versus repository storage of fuel, would provide different footprints.
Although there were differences among energy types in the spatial footprint responses, the responses reflect unfamiliarity rather than knowledge. That is, the ratings by subjects did not reflect current science. Few calculations have been made to compare with the perceptions reported in this paper. Stőglehner [9], however, provided some comparisons, and found that spatial footprints per energy produced decreased as follows: coal (highest spatial footprint, relative value of 20), oil (12), gas (10), biofuels, hydropower, solar, and wind (all less than 1). Geothermal, nuclear, and tidal were not examined. Huijbregts [41] provided another accounting of ecological footprint (in decreasing order) of biomass, hydro, wind and solar, and fossil and nuclear energy, but did not examine indirect footprints. Using energy chains for cars, Holden and Hǿyer [7] came up with a ecological footprint ranking of biomass > oil > natural gas > hydro. The most inclusive ranking is from Sovacool [42]: coal > oil > natural gas >> nuclear > geothermal = biomass > solar = hydro = wind. The estimated release ranges from 1000 g CO2/kWh for coal to about 10 g/kWh for solar, wind and hydro. There are several discrepancies depending on assumptions. For example, the full nuclear cycle includes substantial carbon emission in the front end, although negligible carbon is released during the reactor operations [42]. These discordant analyses illustrate the importance of scientists deciding on a uniform method of calculating spatial or ecological footprints.
In the present study of respondents from a university community in central New Jersey, the ranking of spatial footprint (in decreasing order) was: coal/oil/nuclear/ geothermal > hydro/wind/solar > tidal, but the differences were small with mean ratings for spatial footprint between 2.5 and 3.5, while they rated carbon footprints as varying from 1.8 to 4. Moreover, there were few age-related differences in knowledge about carbon and spatial footprints (refer to Figure 1). Older people thought the spatial footprint for hydro was larger than did younger people, but the differences were not great and may not be meaningful.
4.2. Renewability of Resources
Much of the public debate, public-policy decisions, and international agreements concern the dichotomy between renewable and non-renewable resources. Renewable resources are those that are naturally renewed, such as solar, wind, tidal, geothermal, and to varying extents biomass [43,44]. Our definition of “renewable” is an energy source that is not depleted by use. In our view, there is not a perfect dichotomy, but instead there are intermediate stages. Geothermal, for example, in not completely renewable because it requires recharge to maintain the steam source [38].
Various polls have shown wide-spread support for the concept of renewable energy for environmental, economic, and security reasons [37]. Some people, however, have questioned whether the current high material living standards in developed nations; can be maintained using only renewable energy [45]. Several agencies and governments have addressed the development of energy plans [46] and systems that are 100% renewable [47,48], acknowledging that these would involve major societal changes in farming practices (if biofuels are key), use of land (if solar and wind), and possible offshore effects (if offshore wind), not to mention the direct environmental effects.
A reasonable public debate that leads to public policy decisions and the siting of energy facilities, however, requires an understanding of which sources are renewable, as well as the relative spatial footprint each requires. Clearly the most renewable energy source is solar, since the sun’s energy striking the earth is relatively constant, taking into account latitude/season and atmospheric clarity, and wind energy which results from the sun’s differential heating of the earth’s surface. In the present study, subjects rated both solar and wind as the most renewable, although the average rating was less than 5, meaning that some people did not consider it completely renewable. At present, New Jersey has little solar or wind energy, although these are being encouraged by State government and the media.
Improved technology aims at increasing the efficiency of energy conversion for solar as well as for other forms of energy considered renewable (wind, tidal, geothermal, hydro), which requires energy-dependent generators to convert the renewable energy into electricity [49]. Geothermal, companies, for example, developed methods of powering the generators from geothermal energy rather than depending upon oil, but were slow in becoming independent [50]. Geothermal has the clear advantage of not influencing global warming [51].
We suggest that there are other distinctions that are rarely made when considering renewable resources—the degree of renewability and the predictability of the resource. For example, the sun will continue to shine, but wind is much less reliable, and geothermal is reliable but it can be overexploited. That is, if too much water is withdrawn from the geothermal field, the water table can drop (E. Gunniaugsson, Reykjavik Energy, Iceland, Pers. Comm.). Thus, there are complexities to the term “renewable” that require exploration. Further, methods of energy storage are critical for many forms of energy; the sun doesn’t shine at night, and wind is not always strong enough to turn turbines [52].
Subjects in this survey correctly recognized solar and wind as renewable, and rated natural gas, coal and oil as non-renewable. Even so, however, everyone did not rate them a 1 (not renewable). Nuclear energy, usually considered non-renewable, but advantageous because of its low carbon emission, was rated as intermediate with a wide range of scores from 1 to 5. Thus, there seems to be less understanding among the respondents regarding the renewability status of nuclear. There were few age-related differences, and those that were significant were not great and may not be meaningful.
Greenberg and Truelove [53], in a survey of 3200 US residents, showed that there are multiple publics with respect to energy preferences and risk benefits. In our study, with a relatively homogeneous population within a university community, there was a wide difference in knowledge about the renewability of energy sources under discussion. It suggests public forums on energy resources and sustainability need to clearly define renewable, and identify the resources being discussed.
4.3. Worry, Knowledge and Energy Sources for Development
There is a very large literature on public preferences for, and worries about, different energy sources, with literally hundreds of opinion polls. Overall these polls show a clear preference for renewable sources of energy, and major reservations about coal and nuclear fuel [reviewed in 2]. Greenberg’s national survey of 2701 US residents showed that over 90% wanted greater reliance on solar and wind, and over 70% wanted more reliance on hydroelectric sources. There is still concern, however, about the effect of wind on global climate [54].
In the present study, there was also a preference for wind and solar, followed by tidal, hydroelectric, and geothermal. Nuclear was more preferred for future development than natural gas, oil, and coal, which was surprising, given that the survey was conducted only weeks after the Fukushima nuclear event (March 2011), when the story was still receiving daily coverage in the media. In another series of questions, about 55% said that the Fukushima event and the Deep Water Horizon Gulf oil spill influenced their views about energy use (Burger, unpubl. data). Thus, it is likely that the Fukushima accident influenced the ratings, making it more surprising that nuclear was rated higher for future development than natural gas, oil, or coal.
The mean worry score for different energy sources was generally related to the percent of subjects who did not want that form of energy developed (Figure 3). However, this was only generally true. A higher percentage of subjects were opposed to further development of coal than their worry score would indicate. Generally subjects were not very worried about renewable energy forms (hydro, solar, wind), and few people opposed further development. Some people did, however, feel the renewables should not be further developed, and this bears further study.
4.4. Implications and Conclusions
Overall, subjects in this study had a reasonable understanding of the relative size of the carbon footprint, but less of an understanding of spatial footprints. The implications of this are that people may not be aware of the ecological consequences, in terms of physical space and the amount of ecosystems that would be disrupted, of different energy sources. It also suggests the importance of examining the relative physical impact of different energy sources on natural ecosystems. Understanding spatial footprint is particularly important for the state of New Jersey because it is a small state, with the highest population density in the US, where land is at a premium. We also suggest that permanence should be examined. That is, if a particular energy source is developed, can the ecosystem it replaces ever be restored once the energy source is developed? For example, could an ecosystem be restored if a wind farm or solar panels are placed there? This is an especially important question for New Jersey, where some farmland is being covered with solar panels.
Further, subjects correctly knew which energy sources were renewable and which were not, and they wanted to see more development of renewable resources, and less of non-renewable resources. Younger people wanted to see less future development of oil and natural gas than did older people, and a conclusion which agrees with the findings of Greenberg [2]. Thus, these results suggest that older people are less reluctant to move away from oil and natural gas, toward other forms of energy. However, when the data on the percentage of people who wish to see future development were examined (refer to Figure 2), there were no significant differences as a function of age. All age groups wanted to see future development of renewable energy sources, suggesting further support by people of efforts to develop renewable resources.
Worry can be used by managers to understand educational needs, and discrepancies between worry and their desire to forego further development of some energy sources. For example, people were less worried about coal than their preference for no more development would suggest. It seems people are not worried about it, but do not want to see further coal development. This also suggests that there is another reason for they wish not to see coal development that is not captured by their “worry” scores. The combination of preferences (or lack thereof) for future development, in conjunction with worry scores, may provide another way to examine personal perceptions of energy development.
Finally, this survey clearly indicated that people worry about the development of some energy sources (gas, oil, coal), and worry much less about others (wind and solar, followed by tidal, hydroelectric, and geothermal). The subjects interviewed generally wanted to see more future development of the energy sources that they were less worried about. The only energy source which did not fit this was nuclear (nuclear was more preferred for future development than natural gas, oil, and coal). Thus, overall, surveys can provide information on different aspects of future energy development, such as the public’s rating of which sources to develop, their worry about different energy sources, and their knowledge (and worry) about carbon and ecological footprints.
5. Acknowledgements
This research was partly funded by the Consortium for Risk Evaluation with Stakeholder participation (DE-FC01- 06EW07053), and NIEHS Center Grant (P30ES005022), and EOHSI. The views expressed herein are solely those of the authors, and do not represent any of the funding agencies.
REFERENCES
- M. Greenberg and K. Crossney, “The Changing Face of Public Concern about Pollution in the United States: A Case Study of New Jersey,” Environment, Vol. 26, No. 4, 2006, pp. 255-268.
- M. R. Greenberg, “Energy Sources, Public Policy, and Public Preferences: Analysis of US National and SiteSpecific Data,” Energy Policy, Vol. 37, No. 8, 2009, pp. 3242-3249. doi:10.1016/j.enpol.2009.04.020
- M. R. Raupach, G. Marland, P. Ciais, C. LeQuere, J. G. Canadell, G. Klepper and C. B. Field, “Global and Regional Drivers of Accelerating Cos Emissions,” Proceedings of the National Academy of Sciences, Vol. 104, No. 24, 2007, pp. 10288-10293. doi:10.1073/pnas.0700609104
- B. J. M deVries, D. P vanVuuren and M. M. Hoogwijk, “Renewable Energy Sources: Their Global Potential for the First Half of the 21st Century at the Global Level: An Integrated Approach,” Energy Policy, Vol. 35, No. 4, 2007, pp. 2590-2610. doi:10.1016/j.enpol.2006.09.002
- EIA (Energy Information Administration), Energy-Related Carbon Dioxide Emissions, US Energy Information Administration, 2010. http://www.eia.gov/oiaf/ieo/emissions.html
- N. Chambers, C. Simmons and M. Wackernagel, “Sharing Nature’s Interest: Ecological Footprints as an Indicator of Sustainability,” Earthscan, London, 2000.
- E. Holden and K. G. Hǿyer, “The Ecological Footprints of Fuels,” Transportation Research, Part D, Vol. 10, No. 5, 2005, pp. 395-403.
- IPCC (International Panel on Climate Change), Climate Change 2007, Contribution of Working Group to the Fourth Assesment Report of the Intergovernmental Panel on Climage Change, Cambridge University Press, Cambridge, 2007.
- G. Stoglehner, “Ecological Footpring—A Tool for Assessing Sustainable Energy Supplies,” Journal of Cleaner Production, Vol. 11, No. 3, 2003, pp. 267-277. doi:10.1016/S0959-6526(02)00046-X
- S. M. Benson and F. M. Orr Jr., “Sustainability and Energy Conversion” MRS Bulletin, Vol. 33, No. 4, 2008, pp. 297-302. doi:10.1557/mrs2008.257
- C. J. Bromley, M. Mongillo, G. Hiriart, B. Goldstein, R. Bertani, E. Huenges, A. Ragnarsson, J. Tester, H. Muraoka and V. Zui, V, “Contribution of Geothermal Energy to Climate Change Mitigation: The IPCC Renewable Energy Report,” Proceedings of the World Geothermal Congress, Bali, 25-29 April 2010, pp. 1-5.
- P. Upham, L. Whitmarsh, W. Poortinga, K. Purdam, A. Darnton, C. McLachlan and P. Devine-Wright, “Public Attitudes to Environmental Change: A Selective Review of Theory and Practice,” Research Councils, Swindon, 2009. www.lwec.org.uk
- J. Zoellner, P. Schweizer-Ries and C. Wemheurer, “Public Acceptance of Renewable Energies: Results from Case Studies in Germany,” Energy Policy, Vol. 36, No. 11, 2008, pp. 4136-4141. doi:10.1016/j.enpol.2008.06.026
- A. Spence, W. Poortinga, C. Butler and N. F. Pidgeon, “Perceptions of Climate Change and Willingness to Save Energy Related to Flood Experience,” Nature, Vol. 1, 2011, pp. 46-49.
- G. Ellis, J. Barry and C. Robinson, “Many Ways to Say ‘No’-Different Ways to Say ‘Yes’; Applying Q-Methodology to Understand Public Acceptance of Wind Farm Proposals,” Journal of Environmental Planning and Management, Vol. 50, No. 4, 2007, pp. 517-551. doi:10.1080/09640560701402075
- M. R. Greenberg, “How Much Do People Who Live near Major Nuclear Facilities Worry about Those Facilities: Analysis of National and Site-Specific Data,” Journal of Environmental Planning and Management, Vol. 52, No. 7, 2009, pp. 919-937. doi:10.1080/09640560903181063
- H. C. Hung and T. W. Wang, “Determinants and Mapping of Collective Perceptions of Technological Risk: The Case of the Second Nuclear Power Plant in Taiwan,” Risk Analysis, Vol. 31, No. 4, 2011, pp. 668-682. doi:10.1111/j.1539-6924.2010.01539.x
- R. R. Kasperson, O. Renn, P. Slovic, H. S. Brown, J. Emel, R. Goble, J. X. Kasperson and S. Ratick, “The Social Amplification of Risk: A Conceptual Framework,” Risk Analysis, Vol. 8, No. 2, 1988, pp. 177-187. doi:10.1111/j.1539-6924.1988.tb01168.x
- M. Wolsink, “Entanglement of Interests and Motives: Assumptions behind the NIMBY Theory on the Facility Sitting,” Urban Studies, Vol. 31, No. 6, 1994, pp. 851- 866. doi:10.1080/00420989420080711
- G. O. Rogers, “Siting Potentially Hazardous Facilities: What Factors Impact Perceived and Acceptable Risk?” Landscape and Urban Planning, Vol. 39, No. 4, 1998, pp. 265-281. doi:10.1016/S0169-2046(97)00087-X
- P. Slovic, “The Perceptions of Risk,” In: J. Slovic, Ed., The Perception of Risk, Earthscan, London, 2000, pp. 221-230.
- D. L. Feldman and R. A. Hanahan, “Public Perceptions of a Radioactively Contaminated Site: Concerns, Remediation Preferences, and Desired Involvement,” Environmental Health Perspectives, Vol. 104, No. 12, 1996, pp. 1344-1352. doi:10.1289/ehp.961041344
- M. R. Greenberg, “NIMBY, CLAMP, and the Location of New Nuclear-Related Facilities: US National and 11 Site Specific Surveys,” Risk Analysis, Vol. 29, No. 9, 2009b, pp. 1242-1245. doi:10.1111/j.1539-6924.2009.01262.x
- H. C. Jenkins-Smith, C. L. Silva, M. C. Nowlin and G. deLozier, “Reversing Nuclear Opposition: Evolving Public Acceptance of a Permanent Nuclear Waste Disposal Facility,” Risk Analysis, Vol. 31, No. 4, 2011, pp. 629- 644. doi:10.1111/j.1539-6924.2010.01543.x
- D. Bell, T. Gray and C. Haggett, “The ‘Social’ Gap in Wind Farm Sitting Decisions; Explanations and Policy Responses,” Environmental Policy, 2005, pp. 49-64.
- G. J. Dalton, D. A. Lockington and T. E. Baldock, “A Survey of Tourist Attitudes to Renewable Energy Supply in Australian Hotel Accommodation,” Renewable Energy, Vol. 33, No. 10, 2008, pp. 2174-2185. doi:10.1016/j.renene.2007.12.016
- United States Energy Information Administration (USEIA), US Carbon Dioxide Emissions from Energy Sources, EIA of DOE, 2010.
- T. Soderqvist, H. Eggert, B. Olsson and A. Soutukorva, “Economic Valuation for Sustainable Development in the Swedish Coastal Zone,” Ambio, Vol. 34, No. 2, 2005, pp. 169-175.
- M. Siegrist, G. Cvetkovih and C. Roth, “Salient Value Similarity, Social Trust, and Risk/Benefit Perception,” Risk Analysis, Vol. 20, No. 3, 2000, pp. 353-362. doi:10.1111/0272-4332.203034
- T. C Beierle, “The Quality of Stakeholder-Based Decisions,” Risk Analysis, Vol. 22, No. 4, 2002, pp. 739-749. doi:10.1111/0272-4332.00065
- T. Dietz and P. C. Stern, “Public Participation in Environmental Assessment and Decision-Making,” National Academy Press, Washington DC, 2008.
- P. Devine-Wright, “Local Aspects of UK Renewable Energy Development; Exploring Public Beliefs and Policy Implications,” Local Environment, Vol. 10, No. 1, 2005, pp. 57-69. doi:10.1080/1354983042000309315
- J. Blake, “Overcoming the ‘Value-Action Gap’ in Environmental Policy: Tensions between National Policy and Local Experience,” Local Environ, Vol. 4, No. 3, 1999, pp. 257-278. doi:10.1080/13549839908725599
- R. Kahn, “Siting Struggles; the Unique Challenge of Permitting Renewable Energy Power Plants,” The Electric Journal, Vol. 13, No. 2, 2000, pp. 21-33. doi:10.1016/S1040-6190(00)00085-3
- J. Kitzes, A. Peller, S. Goldfinger and M. Wachernagel, “Current Methods for Calculating National Ecological Footprint Accounts,” Scientific Environmental Sustainability Society, Vol. 4, 2007, pp. 1-9.
- A. Leiserowitz, E. Maibach, C. Roser-Renouf, N. Smith and J. D. Hmielowski, “Climate Change in the American Mind: Public Support for Climate & Energy Policies in November 2011,” Yale University and George Mason University. New Haven, 2011.
- Council on Foreign Relations, US Opinion on Energy Security, 2012.
- J. L. Renner, “Geothermal Energy,” In: T. M. Letcher, Ed., Future Energy: Improved, Sustainable and Clean Options for Our Planet, Elsevier, New York, 2008, pp. 211-224.
- P. W. Gerbens-Leenes, A. Y. Hoekstra and T. H. van der Meer, “The Water Footprint from Biomass: A Quantitative Assessment and Consequences of an Increasing Share of Bio-Energy in Energy Supply,” Ecological Economy, Vol. 68, No. 4, 2009, pp.1032-1060. doi:10.1016/j.ecolecon.2008.07.013
- P. Champagne, “Biomass,” In: T. M. Letcher, Ed., Future Energy: Improved, Sustainable and Clean Options for Our Planet, Elsevier, New York, 2008, pp. 151-170.
- M. A. J. Huijbregt, S. Hellweg, R. Frischknecht, K. Hungerbuhler and A. J. Hendriks, “Ecological Footprint Accounting in the Life Cycle Assessment of Products,” Ecology Economics, Vol. 64, No. 4, 2008, pp. 798-807. doi:10.1016/j.ecolecon.2007.04.017
- B. Sovacool, “Valuing the Greenhouse Gas Emissions from Nuclear Power: A Critical Survey,” Energy Policy, Vol. 36, No. 8, 2008, pp. 2940-2953. doi:10.1016/j.enpol.2008.04.017
- D. M. Berman and J. T. O’Connor, “Who Owns the Sun? People, Politics and the Struggle for a Solar Economy,” Chelsea Green Publishing Co., White River Junction, VT, 1996.
- W. Shi, “Renewable Energy: Finding Solutions for a Greener Tomorrow,” Reviews in Environmental Science and Biotechnology, Vol. 9, No. 1, 2010, pp. 33-37. doi:10.1007/s11157-010-9187-6
- F. E. Trainer, “Can Renewable Energy Sources Sustain Affluent Society?” Energy Policy, Vol. 23, No. 12, 1995, pp. 1009-1026. doi:10.1016/0301-4215(95)00085-2
- E. E. Thorhallsdottir, “Environment and Energy in Iceland: A Comparative Analysis of Values and Impacts,” Environmental Impact Assessment Review, Vol. 27, No. 6, 2007, pp. 522-544. doi:10.1016/j.eiar.2006.12.004
- H. Lund, “Renewable Energy Strategies for Sustainable Development,” Energy, Vol. 32, No. 6, 2007, pp. 912-919. doi:10.1016/j.energy.2006.10.017
- H. Lund and B. V. Mathiesen, “Energy System Analysis of 100% Renewable Energy Systems—the Case of Denmark in Years 2030 and 2050,” Energy, Vol. 34, No. 5, 2009, pp. 524-531. doi:10.1016/j.energy.2008.04.003
- V. Smil, “Energy Transitions: History, Requirements, Prospects,” Praeger, California, 2010.
- L. Rybach and M. Mongillo, “Geothermal Sustainability—A Review with Identified Research Needs,” GRC Transaction, Vol. 30, 2006, pp. 1083-1090.
- B. A. Goldstein, G. Hiriart, J. Tester, B. Bertani, R. Bromley, L. Guierrez-Negrin, C. J. Huenges, H. Ragnarsson, A. Mongillo, M. A. Muraoka and V. I. Zui, “Great Expectations for Geothermal Energy to 2100,” Proceedings 36th Workshop of Geothermal Reservoir Engineering, Stanford, 31 January-2 February 2011.
- D. Dicaire and F. H. Tezel, “Regeneration and Efficiency Characterization of Hybrid Adsorbent for Thermal Energy Storage of Excess and Solar Heat,” Renewable Energy, Vol. 36, No. 3, 2011, pp. 986-992. doi:10.1016/j.renene.2010.08.031
- M. Greenberg and H. B. Truelove, “Energy Choices and Risk Beliefs: It Is Just Global Warming and Fear of a Nuclear Power Plant Accident?” Risk Analysis, Vol. 31, No. 5, 2011, pp. 819-831. doi:10.1111/j.1539-6924.2010.01535.x
- D. W. Keith, J. F. DeCarolis, D. C. Denkenberger, D. H. Lenschow, S. L. Malyshev, S. Pacala and P. J. Rasch, “The Influence of Large-Scale Wind Power on Global Climate,” Proceedings of the Natural Academy of Science of the United States of America, Vol. 101, No. 46, 2004, pp. 16115-16120. doi:10.1073/pnas.0406930101
NOTES
*Corresponding author.