Energy and Power Engineering
Vol. 4 No. 6 (2012) , Article ID: 25019 , 7 pages DOI:10.4236/epe.2012.46055
Estimation of Global Solar Radiation Using Clearness Index and Cloud Transmittance Factor at Trans-Himalayan Region in Nepal
1Institute of Engineering, Tribhuvan University, Kathmandu, Nepal
2Department of Physics, Norwegian University of Science and Technology, Trondheim, Norway
Email: khem@ioe.edu.np
Received August 12, 2012; revised September 20, 2012; accepted September 30, 2012
Keywords: Global Solar Radiation; Seasonal Variation; Cloud Transmittance Factor; Clearness Index; Coefficient of Determination; High Himalaya Region
ABSTRACT
This paper presents the global solar radiation (GSR) and cloud transmittance factor (cf) measured at the horizontal surface over a period of one year from 2009 to 2010 using CMP6 Pyranometer and NILUUV Irradiance Meter at Lukla (Latitude 26.69˚N, Longitude 86.73˚E and Altitude 2850 m) in the foothills of the Mt Everest (8850 m high). Monthly and seasonal variations of global solar radiation as well as correlation between clearness index and cloud transmittance factor at Lukla are presented. The annual average daily global solar radiation is about 3.83 kWh/sq·m/day which is sufficient to promote solar active and passive energy technology at high mountain terrain where there is no other viable alternative sources of energy. The maximum and minimum global solar radiation of 5.33 and 2.08 kWh/sq·m/day is recorded in April and September 2010 respectively. The seasonal variation of solar energy is about 2.87 kWh/sq·m/day and 4.83 kWh/sq·m/day in summer and spring respectively which is not in line with the general trend. The coefficient of determination (R2) between cloud transmittance factor (cf) and clearness factor (K) is found to be 0.97. This novel result can be utilized to estimate the global solar radiation at the horizontal surface where K and cf are available.
1. Introduction
Nepal is located in favorable latitude (26˚N to 29˚N), and receives ample solar radiation throughout the country. The average global solar radiation varies from 3.6 - 6.2 kWh/sq·m/day, and the sun shines for about 300 days a year. The national average sunshine hours and solar insolation are 6.8/day and 4.7 kWh/sq·m/day respectively [1]. However the energy scenario of Nepal is alarming situation. Currently the electricity users in the country are facing 4 to 16 hours of load shedding in summer (rainy season) and dry season (spring) respectively. The load shedding causes huge losses to commercial, industrial, residential customers, and the office buildings including academic and government institutions, health service providers and NGOs and so on. Some losses can be directly estimated whereas some others require indirect methods to estimate the losses. The geophysical structure of Nepal is unique. It expands from low plain area from 60 m to the world’s highest peak Mt Everest. There is vast climatic variation in every 100 to 200 m change of altitude. There are series of zigzag shape of small and high mountains so even the satellite cannot measure the exact value of solar radiation in such complex terrain of Himalaya. Therefore, it is very important to validate the ground base measurement data with empirical model for the confirmation of global solar radiation at different parts of the country.
The study of solar radiation potential will support the promotion of solar photovoltaic technology which is one of the most viable options of renewable energy resources for rural electrification in Nepal [2]. There is no detailed study about the global solar radiation and UV radiation in the Himalaya Region. Only few scattered and short term measured data of solar radiation and ultraviolet radiation is available. However, these data will be helpful to explore the trend of global solar radiation and ultraviolet radiation in the Himalaya Region of Nepal [3].
Alternative Energy Promotion Centre (AEPC) under the Government of Nepal has conducted a project—Solar and Wind Energy Resource Assessment (SWERA) under United Nations Environment Program (UNEP)/Global Environment Fund (GEF) from March 2003 to 2006. The study recommended the annual average solar insolation of about 4.7 kWh/sq·m/day in Nepal. SWERA report showed that there is lower solar radiation potential at low altitude plain region than at high altitude mountains and north western part of the country. The Solar Resource Map developed by DLR Germany satellite estimates 3.5 - 4 kWh/sq·m/day of energy at the central mid hill region and higher energy of 5 - 5.5 kWh/sq·m/day is found in the north western region. Similarly, the solar map report of National Renewable Energy Laboratory (NREL), USA shows that there is almost equal amount –4.5 to 5 kWh/sq·m/day of solar radiation found throughout the country. But in the North-Western Region of Nepal the solar insolation is found to be 6 - 6.5 kWh/sq·m/day based on the results of the measurement carried out by SWERA. These Solar Resource Satellite derived DLR and NREL solar resource maps are compared with the ground level measured data of 3 sites. The relative biasness of the model data with respect to the ground level measured data is analyzed considering point to point as well as region to region monthly and annual variation. It shows that within a particular point of location, DLR satellite data has higher Relative Biasness in comparison to NREL data [4].
It is necessary to develop the authentic database for modeling and also investigate the solar active and passive energy application in Nepal for the industrial, tourism trade, communication, education, modern agriculture and public health. Further, it will be used to study the impacts on human health, solar energy budget, climate change, global warming and impacts on agriculture production in the long run [5].
It is known that the higher the altitude greater the total solar irradiance under the clear and intermediate sky conditions, but under the overcast days the solar irradiance is very low in comparison with sunny days [6]. The solar radiation increases with increase in altitude mainly due to decreasing amounts of air molecules, ozone, aerosols and clouds in high altitude atmosphere. Actually, mapping the solar radiant energy on the earth’s surface is a requirement not only in the studies of climate change, effects on ecosystems, environmental pollution but also in agriculture, hydrology, food industry and non conventional energy development programs [7].
The utilization of solar energy, like any other natural resource, requires detailed information on availability. Since solar radiation reaching the Earth’s surface depends on many factors which are not of global character, a study of solar radiation under local weather conditions is also essential.
The present study is expected to provide more information about the total solar radiation potential which will be crucial for designing and predicting the performance of solar energy equipment and solar energy potential [8].
The global solar radiation is affected by clouds, water vapor, aerosols, ozone, and other gases. The cloud is the key affecting factor for solar radiation. The water vapor varies over a day and season. There is more water vapor in the air during wet season compared to the dry season. These are not the only parameters affecting the amount of solar radiation arriving at the earth surface, but the incident angle of solar rays also affects the of solar radiation. This angle varies with time, season and location. The geographical distribution of solar radiation over a region is normally different from other regions due to the position and atmospheric constituents of the local weather condition [9]. Clouds is the major cause of fluctuation in the solar radiation and sunshine hours on the ground surface. The variation, however, is not due to the angle of incidence of the sun’s rays with ground surface and its azimuth [10].
The cloud transmittance factor (cf) is the ratio of measured radiation to the calculated clear sky radiation without aerosols and zero surface albedo. It is measured in percentage.
The main aim of this study is to estimate the global solar radiation using the cloud transmittance factor (cf) and clearness factor (K). This paper presents the trend of monthly and seasonal variation of global solar radiation at High Mountain with complex terrain where there is no viable alternative option of energy supply for the tourism business and the residential customers of electricity.
Measuring Site
Lukla lies in the Khumbu Valley just south of the Mt. Everest. It is located in the central part of Himalayan Range and partially includes the area of Sagarmatha National Park. This area is characterized by poor annual mean precipitation mostly concentrated during summer monsoon season. Winter synoptic circulation is dominated by western streams bringing events which lead to snowfalls in the western and central Himalayan Range and the Tibetan Plateau. In summer, southern monsoon streams dominate carrying damp ocean air toward interior of the continent. The measuring site is situated at 2850 meters above from the mean sea level. The surrounding terrain, thin air, highly changeable weather and fast changing visibility are the characteristics of the sensitive weather region from the aviation perspective. The climate is sub-tropical with wet summers and chilly, dry winters mainly affected by its altitude and the summer monsoon season. The temperature ranges from 4˚C to 27˚C and –15˚C to 6˚C in summer and winter respectively [11].
2. Instruments and Methods
The global solar radiation on a horizontal surface was measured using Kipp and Zonen CMP6 Pyranometer and NILU-UV Irradiance Meter measures the cloud transmittance factor at Lukla. These instruments are installed at Lukla (Lat. 26.69˚N, Long. 86.73˚E, Alt. 2850 m). The figures of CMP6 Pyranometer and NILU-UV Irradiance Meter is shown in Figures 1(a) and (b).
The CMP6 pyranometer has wide spectral range of instrument from 310 nm to 2800 nm. The operating temperature is from –40˚C to 80˚C. The sensitivity of instrument and field of view are 5 to 15 µV/W/sq·m and 180˚ respectively. All the measuring data is recorded by LOGBOX SD data logger within a minute resolution for 24 hours. Its special features are low noise, high resolution and low power consumption. It can be used in all weather conditions. It collects the data at real time for the needs of meteorology and slow signal analysis. For data logging 128 KB of memory is available. We can insert the SD memory card for long term data storage. For the communication LOGBOX uses either RS232 or RS485 communication port [12].
 (a)
(a)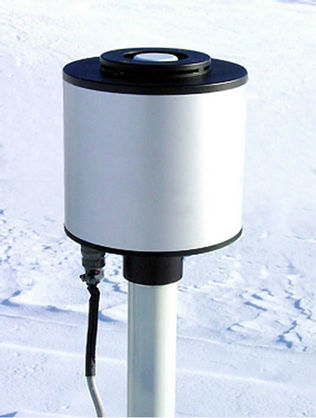 (b)
(b)
Figure 1. (a) CMP6 pyranometer; (b) NILU-UV irradiance meter.
The cloud transmittance factor (cf) is measured by sophisticated NILU-UV irradiance meter. This device is a six-channel radiometer designed to measure hemispherical irradiances as well as cloud transmittance factor on a plane surface. The different effects of cloud on global solar radiation and UV radiation are estimated on the basis of cloud transmittance factor. The measured cf is utilized to explain the availability of solar energy in different locations. It is the ratio of measured radiation to the calculated clear sky radiation without aerosols and zero surface albedo. It is measured in percentage. The range of cloud transmittance factor value ranges from 0 to 1 [13].
The global solar radiation (Hg) is measured using CMP6 Pyranometer on the horizontal surface at Lukla. Similarly the cloud transmittance factor cf is measured by NILU-UV Irradiance Meter.
However the extraterrestrial global solar radiation H0 is in Joules per square meter and Isc is in W/m2. H0 is calculated using equation (1.10.3) [14].
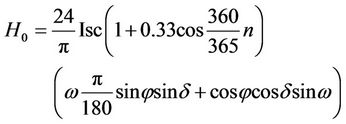 (1)
(1)
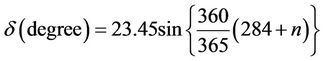
where φ is the latitude (rad) and δ is the solar declination angle (rad). ω is sunset hour angle for typical day and n is mean day of each months where, n is the day of the year. January first n = 1 to 365 days.
 (2)
(2)
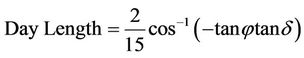
The relation of day length is,
 (3)
(3)
 (4)
(4)
where ω is the sunset hour angle.
In this paper we compare the monthly and seasonal variation of global solar radiation on the basis of cf and K. The use of these two coefficient factors, we can found the coefficient of determination. On the basis of R2, the Hg/H0 can be found using the linear equation and after applying the Equation (1) for the extraterrestrial global solar radiation is found. At the end Hg can be calculated which will be novel work in our complex terrain of Himalaya region where all types of instruments cannot installed.
3. Results and Discussions
3.1. Diurnal Variation of Global Solar Radiation
Figure 2 shows the measured and estimated value of
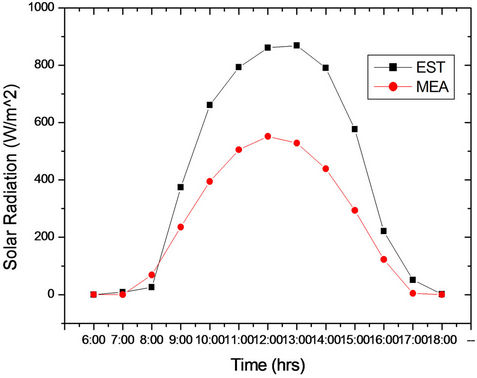
Figure 2. Diurnal Variation of global solar radiation in clear sky day on 26 January, 2010 at Lukla.
diurnal variation of global solar radiation at Lukla on 26th January 2010. However, maximum solar radiation of 868.61 W/sq·m is recorded in the noon. The measured value is 38.12 percent less than estimated value of global solar radiation. The statistical analysis of the data gives the correlation coefficient of 0.96 between measured value and calculated value of solar radiation. Similarly, the standard deviation and P-value are 30.29 and 0.0001 are found respectively. Hence statistical analysis indicates that the measured data are relevant as well as sufficient to explore the solar energy even in January, i.e. during winter season.
3.2. Relationship between Clearness Index (K), Cloud Transmittance Factor (cf) and Measured Global Solar Radiation at Lulka
The global solar radiation and cloud transmittance factors have are measured at the above mentioned site continuously by Pyranometer and NILU-UV irradiance meter. The measurements are recorded at intervals of 1 minute. Based on these 1 minute data for the whole year, monthly mean values of global solar radiation, clearness index and cloud transmittance factor have been computed and presented in Table 1.
The clearness index is defined as the ratio of measured global solar radiation (Hg) to the extraterrestrial global solar radiation (H0). Similarly the cloud transmittance factor is the ratio of measured radiation to the calculated clear sky radiation without aerosols and zero surface albedo. It is measured in percentage. Figure 3 shows that the coefficient of determination of 0.97 is obtained from clearness factor (K) and cloud transmittance factor (cf). It is observed that sufficient amount of energy is available for extraction even during the winter season.
Figure 4 shows the relationship between global solar radiations (GSR), clearness index (K) and cloud transmittance factor (cf). Figure 4 shows that the increasing and decreasing trend of GSR, cf and K are tentatively similar it means that there is strong correlation in between GSR, cf and K. Hence if cf values are available, the GSR can be predicted which will be the new way in coming days. The given figure clearly indicates that maximum amount of solar energy can be harvested in spring and minimum in summer which is quite different trend compared to Kathmandu, Pokhara and Biratnagar [10].
3.3. Monthly Variation of Solar Energy at Lukla
Figure 5 shows that the GSR varies from month to month due to the rotation of earth as well as local weather condition. Lukla is one of the entry point for Mount Everest. The Lukla Airport is one of most dangerous airport in the world because of complex terrain as well as unpredictable weather. Thus the solar radiation varies from 7.51 MJ/sq·m/day (September) to 19.18 MJ/sq·m/day (April). Table 1 data reflects that there is meaningful matching of the result between GSR, K and cf. The overall monthly average GSR is about 13.67 MJ/sq·m/day. It is concluded that even at winter and rainy season sufficient amount of solar energy is found to be available which points towards the need to promote the solar energy technology in that region.
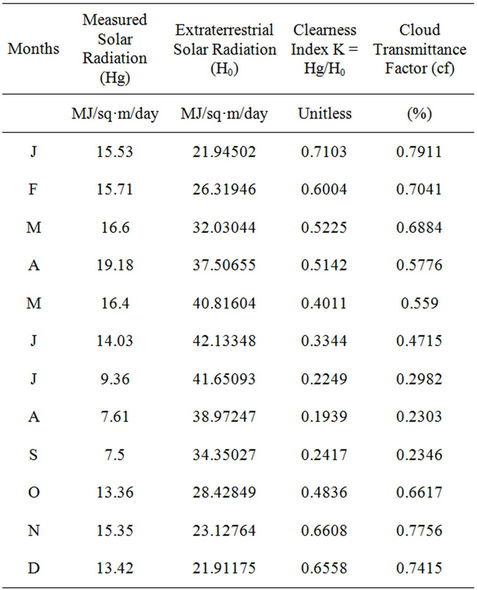
Table 1. Monthly mean measured and extraterrestrial monthly mean value of GSR.
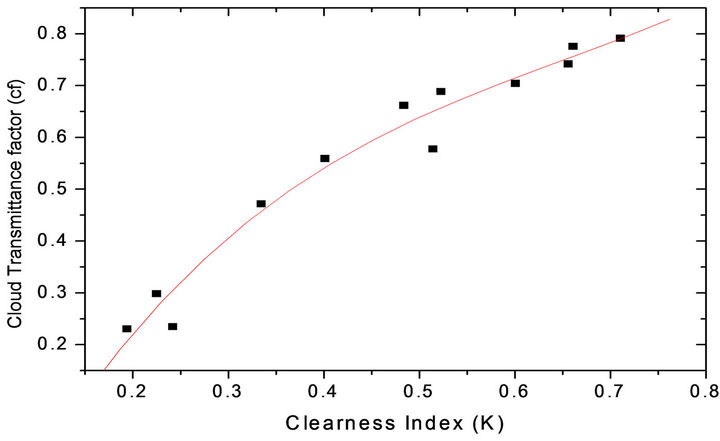
Figure 3. Correlation coefficient in between clearness index K and cloud transmittance factor (cf) at Lukla in 2009-2010.
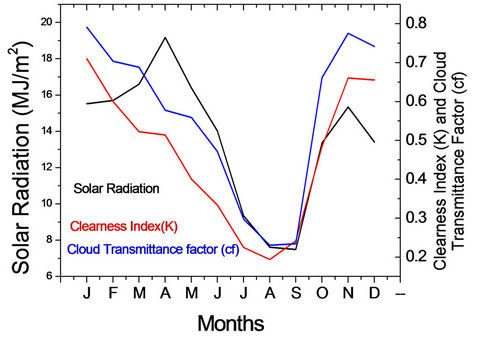
Figure 4. Relationship between global solar radiation, clearness index and cloud transmittance factor at Lukla in 2009- 2010.
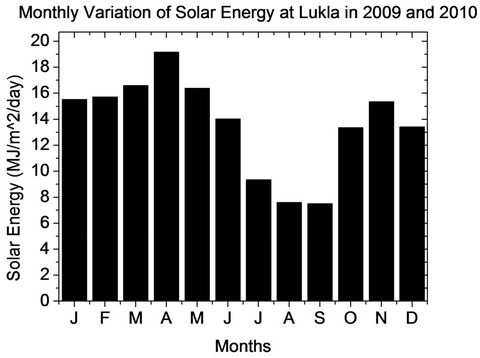
Figure 5. Monthly variation of global solar radiation at Lukla in 2009-2010.
3.4. Seasonal Variation of Solar Energy at Himalaya Region
Figure 6 shows the global solar radiation significantly fluctuates in season to season. Lukla represents the High Mountain region in the northern part of Nepal. The solar energy 14.88, 17.39, 10.33 and 12.07 MJ/m2/day is found at Lukla in winter, spring, summer and autumn season respectively.
Similarly the clearness index K and average cloud transmittance factors cf of 0.65, 0.50, 0.25, 0.46, and 0.75, 0.61, 0.33 and 0.55 are found in winter, spring, summer and autumn seasons respectively. It can be concluded that the maximum clear sky days occur in spring and minimum clear sky days are found in summer. In addition to this, maximum amount of energy is available during spring and minimum in autumn. This trend is quite different from the results for Kathmandu, Pokhara and Biratnagar [10] for different seasons.
4. Conclusions
It is observed that the maximum and minimum amount of solar energy of 19.18 MJ/m2/day and 7.51 MJ/m2/day were recorded in April and September in 2010 at Lukla. The variation in available solar insolation was the result of variation in cloud transmittance factor and clearness index during these two different seasons. High cf and K were observed in the April than in September.
Hence, it can be concluded that the global solar radiation is high enough to promote off grid and grid connected photovoltaic (PV) solar power generating plants at Lukla and the vicinity because of highly favorable climatic conditions like the presence of lower humidity at higher altitude. Before It is highly desirable
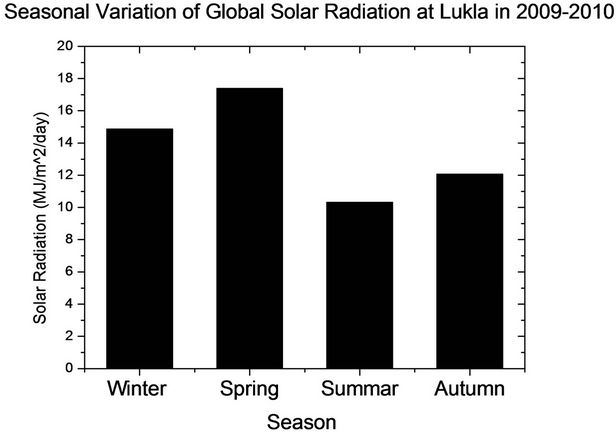
Figure 6. The Seasonal variation of global solar radiation at Lukla in the year 2009 and 2010.
to evaluate all relevant parameters related to the installation of solar PV power plants before executing the same project.
It has been observed that the solar radiation varies for different months and seasons. At the Lukla the maximum solar energy is available during spring when the sun is not expected to provide higher amount of energy to the earth’s surface compared to that of summer. This is associated with the variation in distance of sun from the earth’s surface.
Hence, it is confirmed that the global solar radiation can be estimated on the basis of coefficient of determination, cloud transmittance factor and clearness index as well.
5. Acknowledgements
Authors are grateful to express sincere thanks to Solar Radiation and Aerosol in Himalaya Region (SAHR) project of IOE Pulchowk (Nepal) for providing the data of Pyranometer and NILU-UV Irradiance Meter. Authors are also grateful to Dr. Nava Raj Karki Department of Electrical Engineering IOE Pulchowk and Er.Ram Chandra Poudel, Department of Mechanical Engineering IOE Pulchowk.
REFERENCES
- Water and Energy Commission Secretariat (WECS), “Energy Synopsis Report,” Government of Nepal, 2010.
- M. B. Basnyat, “Rural Electrification through Renewable Energy in Nepal,” World Review of Science, Technology and Sustainable Development, Vol. 1, No. 1, 2004, pp. 74-80. doi:10.1504/WRSTSD.2004.004857
- B. K. Bhattarai, “Factors Affecting Solar Ultraviolet Radiation, Based on Some Case Studies in Norway and Nepal,” Doctoral Theses at NTNU, 2007, pp. 26-27.
- SWERA Final Report, “United Nation Environment Program Global Environment Facility (UNEP/GEF),” Solar and Wind Energy Resource Assessment in Nepal (SWERA), 2006.
- K. N. Poudyal, P. Daponte, D. V. Luca, B. K. Bhattarai and B. Sapkota, “Study of Variation of Global Solar Radiation at Different Altitudes of Himalaya Region—A Case Study in Nepal,” 17th Symposium IMEKO TC 4, 3rd Symposium IMEKO TC 19 and 15th IWADC Workshop, Instrumentation for the ICT Era, Kosice, 2010.
- M. Oki and H. Shiina, “Preliminary Study on an Estimation Method for Annual Solar Irradiance at Various Geographical Altitudes,” 8th International IBPSA Conference, Eindhoven, 11-14 August 2003, pp. 11-14.
- M. Iqbal, “An Introduction to Solar Radiation,” Academic Press, New York, 1983.
- M. B. Sukhera and M. A. R. Pasha, “Solar Radiation Maps for Pakistan,” Solar and Wind Technology, Vol. 4, No. 2, 1987, pp. 229-238. doi:10.1016/0741-983X(87)90053-1
- J. Serm, “Assessment of Solar Energy Potentials for Cambodia,” 2008.
- K. N. Poudyal, B. K. Bhattarai, B. Kjeldstad and B. K. Sapkota, “Solar Radiation Potential at Four Sites of Nepal,” Journal of the Institute of Engineering, Vol. 8, No. 3, 2011, pp. 189-197.
- U. Kenichi and R. Aryal, “Impact of Tropical Convective Activity on Monthly Temperature Variability during Nonmonsoon Season in the Nepal Himalayas,” Journal of Geophysical Research, Vol. 113, No. 9, 2008.
- Kipp and Zonen, “Instruction Manual,” 2008. http://www.kippzonen.com/?product/1251/CMP+6.aspx
- B. A. K. Høiskar, R. Haugen, T. Danielsen, A. Kylling, K. Edvardsen, A. Dahlback, B. Johnsen, M. Blumthaler and J. Schreder, “Multichannel, Moderate-Bandwidth Filter Instrument for Measurement of the Ozone-Column Amount, Cloud Transmittance, and Ultraviolet Dose Rates,” Applied Optics, Vol. 42, No. 18, 2003, pp. 3472-3479. doi:10.1364/AO.42.003472
- J. A. Duffie and W. A. Beckman, “Solar Engineering of Thermal Processes,” 2nd Edition, John Wiley and Sons, New York, 1991.