Energy and Power Engineering
Vol. 4 No. 3 (2012) , Article ID: 19017 , 7 pages DOI:10.4236/epe.2012.43019
Energy Audit of a Brewery—A Case Study of Vitamalt Nig. Plc, Agbara
1Department of Mechanical Engineering,University of Lagos, Lagos, Nigeria
2Department of Mechanical Engineering, University of Benin, Benin, Nigeria
3Department of Mechanical Engineering, Auchi Polytechnic, Benin, Nigeria
Email: noaholugbenga@gmail.com, {aiobanor, auduluqman}@yahoo.com
Received May 15, 2011; revised June 17, 2011; accepted July 2, 2011
Keywords: Efficiency; Energy Intensity; Energy Productivity; Cost of Energy Input
ABSTRACT
The efficient use of energy is of prime importance in all sector of the economy. Energy cost is a significant factor in economic activity on par with factors of production like capital, land and labor [1]. The imperative of an energy shortage situation calls for energy conservation measure, which essentially means using less energy for the same level of activity. A comprehensive energy audit of Vitamalt Nigeria Plc, Agbara was carried out using portable thermal and electrical instruments with the objective of studying the present pattern of energy consumption and identifying the possibilities of saving energy in the plant. Collected, was a five year (2000-2004) data on energy consumption of Vitamalt Nig. Plc. The data were evaluated and analyzed to determine the present energy performance level of the firm. A complete energy balance of the factory was carried out to relate energy input, conversion efficiency with production output in order to identify areas of energy wastages/losses and savings that can be achieved. Energy performance parameters such as Energy intensity, Energy productivity and Normalized performance indicator (NPI) were used as a measure of assessing the energy performance of the plant. The NPI calculated over the span of five years gave an average of 1.2 GJ/m2 indicating a FAIR range in energy performance level classification (1.0 - 1.2) while significant savings and improvement in energy usage is achievable. Maximizing efficiency of existing system, optimizing energy input requirement and significant capital investment in procuring new energy conserving equipment must be made for the energy performance level to fall into a good range classification (less than 0.8).
1. Introduction
The advent of high crude oil prices resulted in a global energy crisis leading to huge cost in generating power, running of boilers and internal combustion engines, necessitating a need for energy management by industrial sector for efficient energy use, maximization of profit and enhanced competitive position [2].
Energy audit concept is a measure of the efficiency of energy utilization in a manufacturing process, thus leading to interest in energy performance of machines and plants directly associated with production process [3]. It is important to account for total consumption, cost and how energy is used for each commodity such as steam, water, air and natural gas. Attention is focused by Energy managers on how to reduce energy consumption per unit of production. To obtain best possible savings, good audit and survey must be carried out. An energy audit helps in energy cost optimization, pollution control, safety aspects and suggests the methods to improve the operating and maintenance practices of the system. Energy Audit attempts to balance the total energy inputs with its use and serves to identify all the energy streams in the systems and quantifies energy usages according to its discrete function [4]. Proper maintenance helps conserve energy by keeping operational efficiencies at their best level.
Energy Surveys and audit are carried out to investigate ways employees can save energy and to identify areas that require high level of energy efficiency. Data were collected for a period of five years (2000-2004) on energy performance of Vitamalt Nig. Plc, Agbara and the analysis has been carried out.
2. Materials and Method
The factory has a total floor area 19,146 m2 and a treated floor area of 12813.57 m2. The Company’s primary source of power supply is the Power Holding Company of Nigeria (PHCN) and 2 giant generating sets as back-up. It has two fire-tube (shell) boilers that uses gas and black oil (low pour fuel oil) as its source of energy, some equipment/machines e.g. pumps, motors, and compressor that uses electricity as their source of energy. Portable test equipment like the flow meter, infrared thermocouple, manometer and multimeter were used in determining flow rates, temperature and electrical readings. The following data were collected:
• Electricity, diesel, and gas consumed per month over a 5 years period;
• Production rate of the Company per month over a 5 years period;
• Number of working hour per day;
• Number of occupancy (shift) per day;
• Floor area of the factory;
• Power rating of all machines/equipment powered by electricity.
All data were presented in tabular and graphical forms as seen in Tables 1-5 and Figures 1-5.
Percentage Energy of Electricity and Fuel (diesel, black oil and gas) consumption were obtained for the 5 years period which can be seen in Table 8.
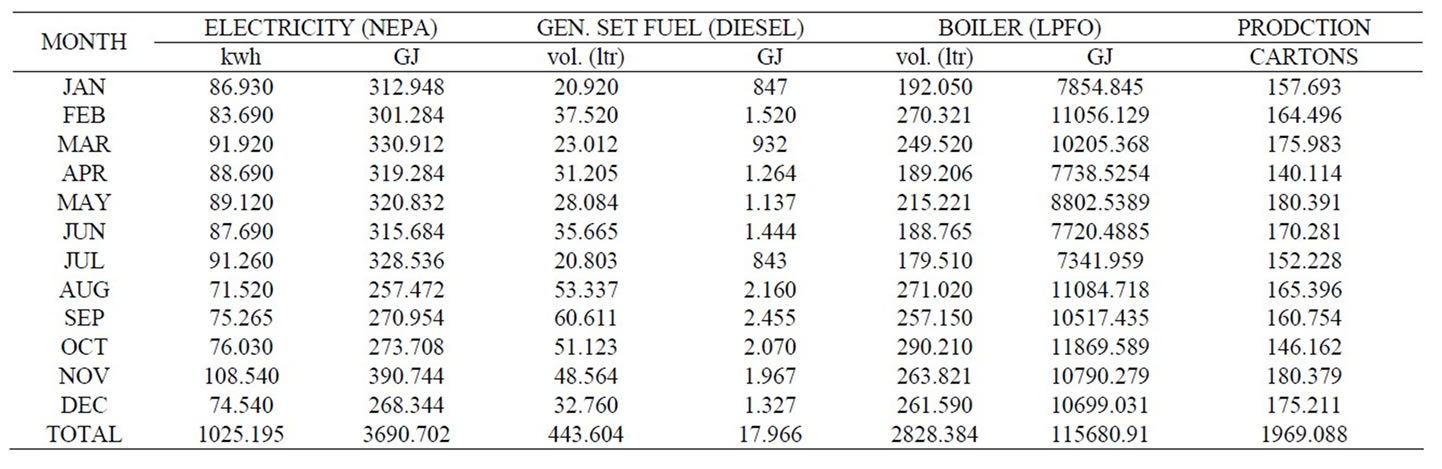
Table 1. Energy consumption and production output (2000).
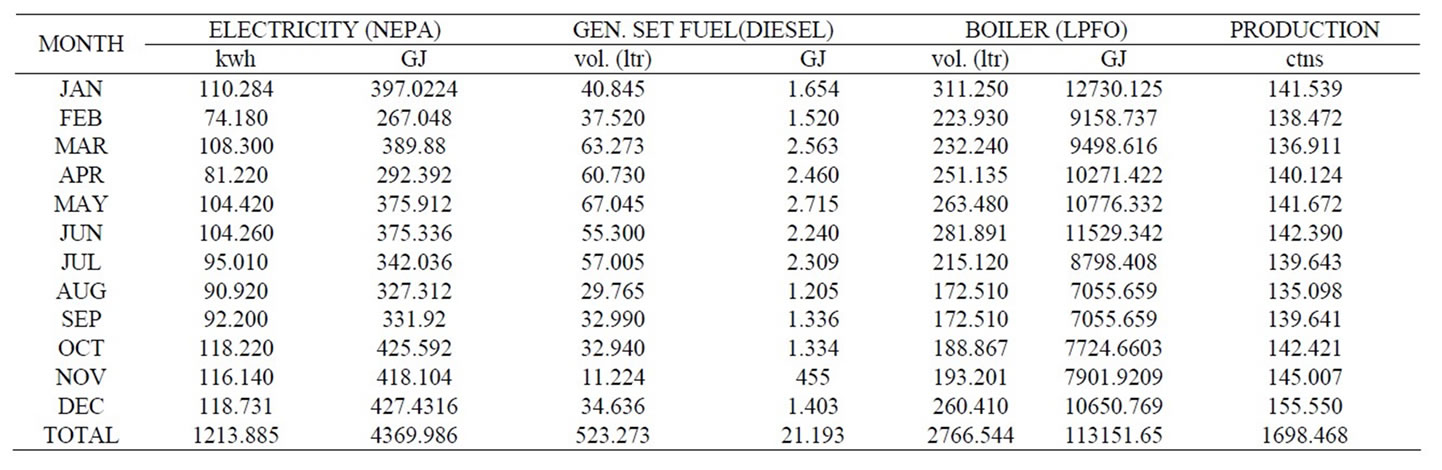
Table 2. Energy consumption and production output (2001).
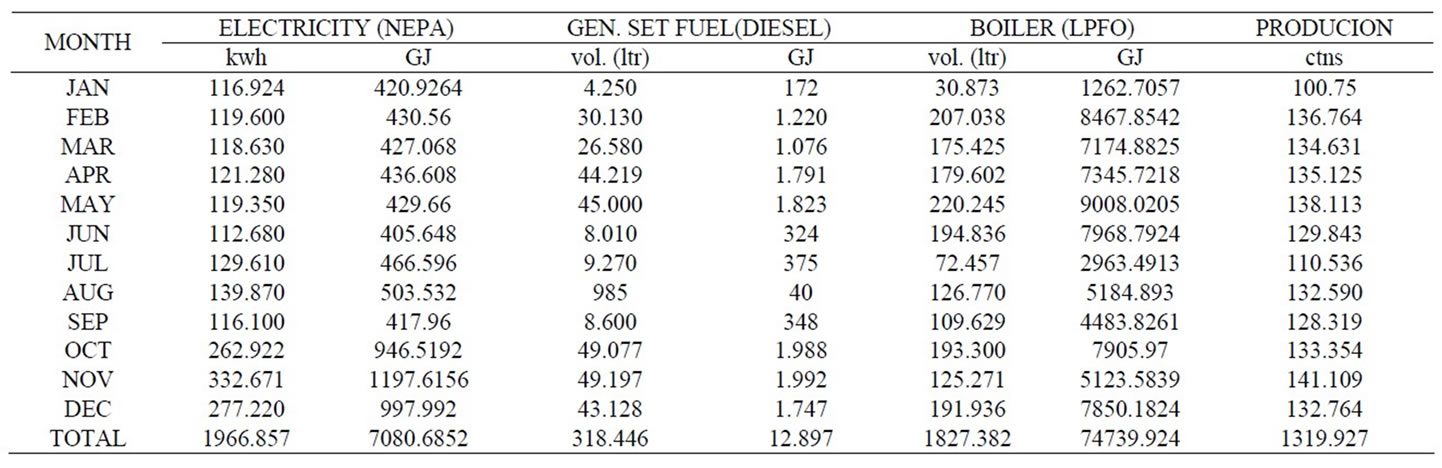
Table 3. Energy consumption and production output 2002.
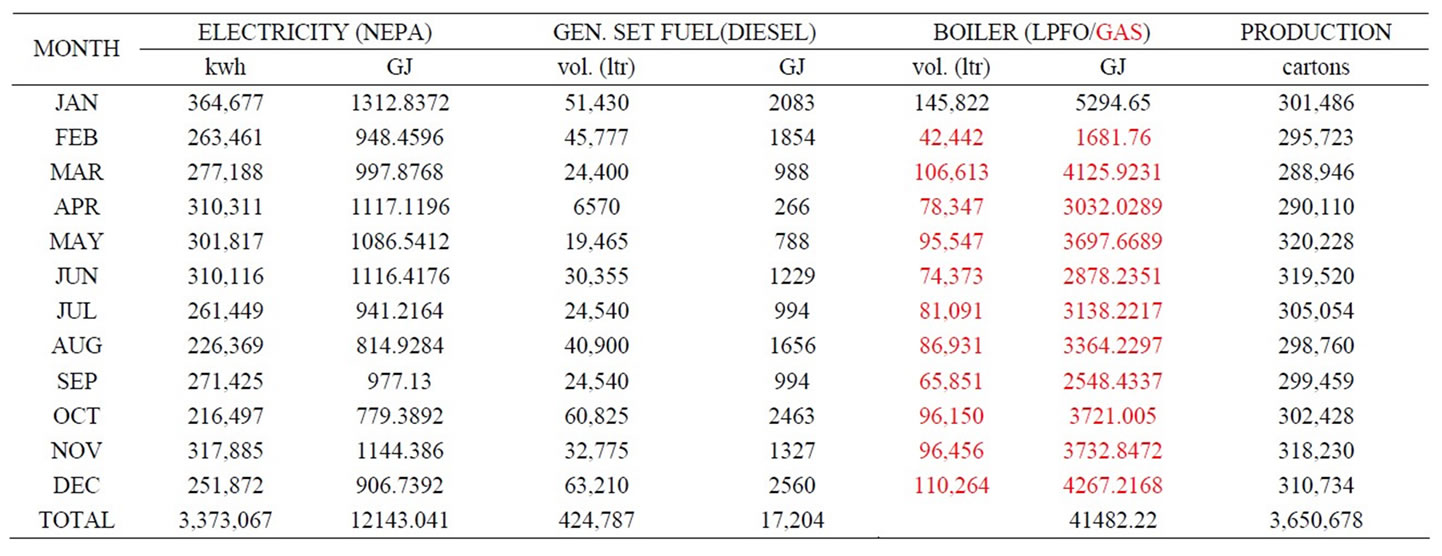
Table 4. Energy consumption and production output (2003).
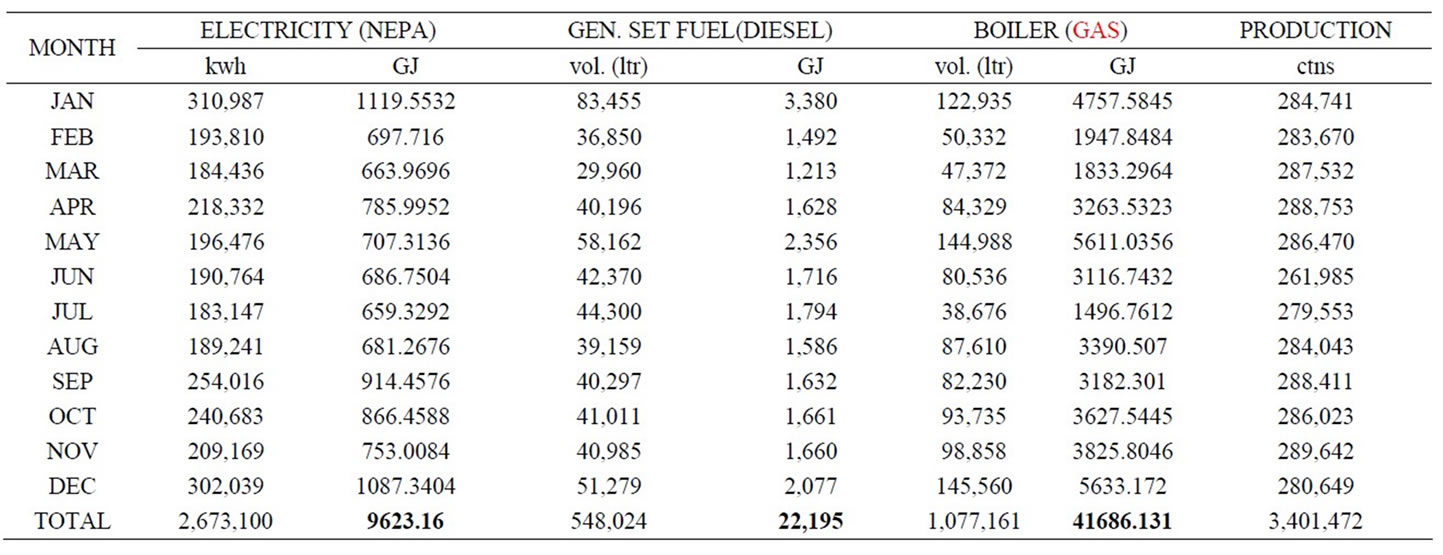
Table 5. Energy consumption and production output (2004).
 (a)
(a)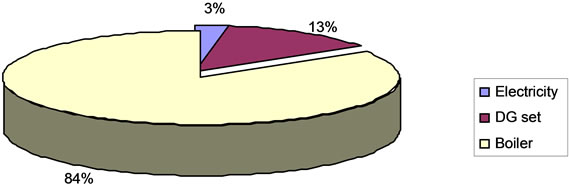 (b)
(b)
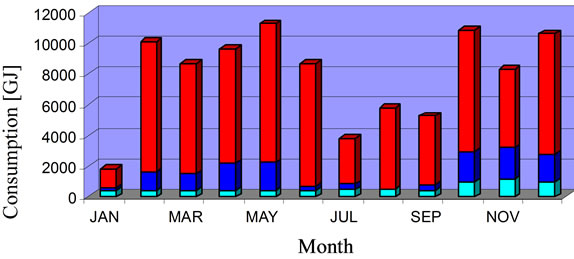
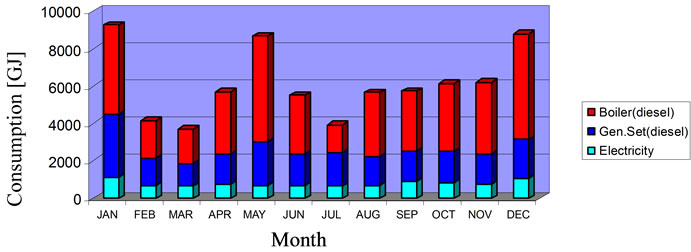
Figure 1. (a) Monthly energy consumption (2000); (b) Total energy inputs (2000).
 (a)
(a)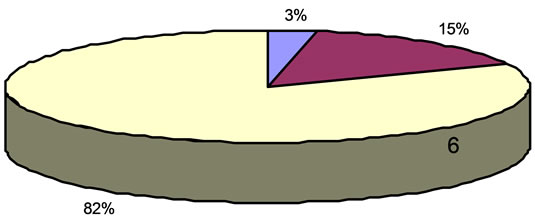 (b)
(b)
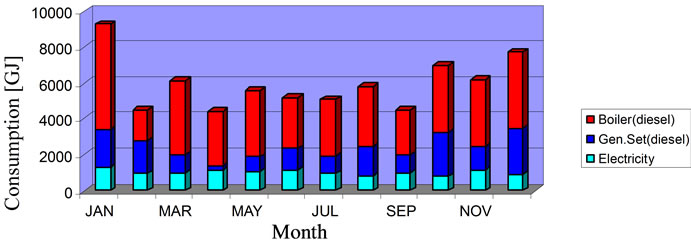
Figure 2. (a) Monthly energy consumption (2001); (b) Total energy inputs (2001).
 (a)
(a)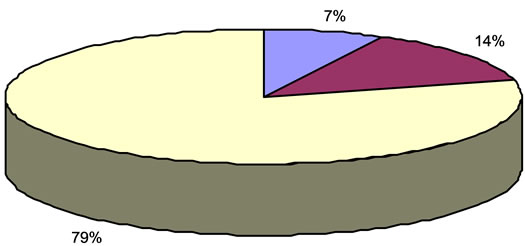 (b)
(b)
Figure 3. (a) Monthly energy consumption (2002); (b) Total energy inputs (2002).
 (a)
(a)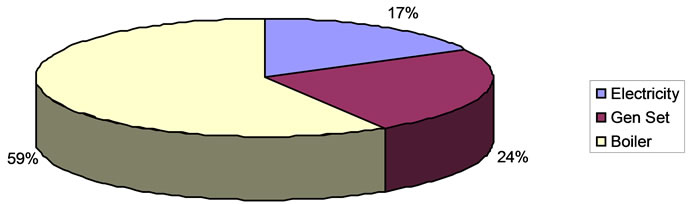 (b)
(b)
Figure 4. (a) Monthly energy consumption (2003); (b) Total energy inputs (2003).
 (a)
(a)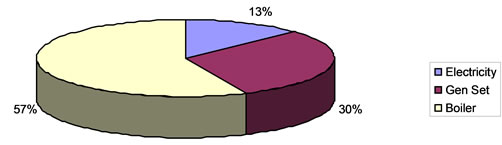 (b)
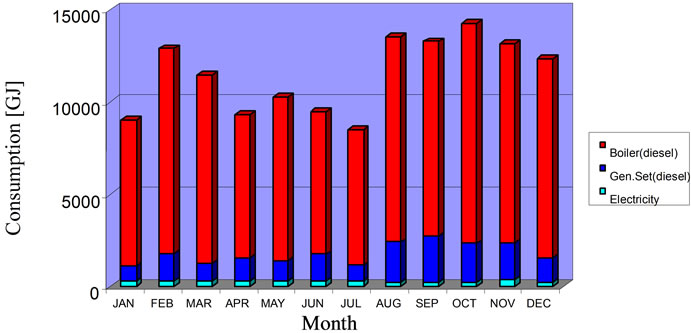
(b)
Figure 5. (a) Monthly energy consumption (2004); (b) Total energy inputs (2004).
Energy performance parameters such as Energy intensity, Energy productivity and Normalized performance indicator (NPI) are useful yardstick to assess the energy performance level of the company [5].
2.1. Energy Intensity
This is the ratio of the energy consumed per year in GJ to the floor area of the Factory in square meters.
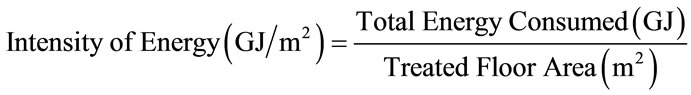
This was calculated for a 5 years period (2000-2004) and a summary presented in Table 6. Average Energy Intensity over the 5 years (2000-2004) was 7.852 GJ/m2.
2.2. Energy Productivity
This is the total energy consumed per unit of production.
Average Energy Productivity for the 5 years period (2000-2004) was 52.14 MJ/ctn (See Table 6).
2.3. Cost of Energy Input into Unit Production
This is the cost of energy to produce a unit product.

Cost of Energy for different energy sources utilized in the plant were summed together to obtain the Total Energy cost. Values of Cost of Energy input for the five years (2000-2004) are given in Table 6. Average Cost of Energy input/Product was N34.72/carton for the five year period.
2.4. Normalized Performance Indicator (NPI)
Performance Indicators are values of energy consumption which can be used to indicate whether the actual consumption is low or high relative to similar typical building. It is expressed as the total annual site energy consumption for a building per unit treated floor area and multiplied by the hour of use factor. Value obtained is compared with standard NPI value quoted by the Energy Efficiency Office [6,7] for such factory. If a building is rated as “good”, then a further investigation may be required unless there are no obvious areas of improvement.

Average Normalizes Performance Indicator over 5 years period (2000-2004) was 1.2 GJ/m2 which is rated as fair for the factory size. NPI values calculated for the five years are summarized in Table 6.
A line graph was used to express the trend and also to compare the different energy efficiency performance Parameters for the 5 years period as can be seen in Figure 6.
3. Discussion of Result
Results obtained from analysis were based on data provided by the company and those taken using measuring equipment. Total energy consumed per annum was on a decline from 137.4 GJ in year 2000 to 71.4 GJ in 2003 and a slight increase in 2004. This decline is attributed to change in boiler fuel. Total energy cost per annum which was expected to drop due to decline in energy consumed was on the contrary as there was an increase from N60.1 million in year 2000 to N96.9 million in 2004. This energy cost increase was due to yearly increase in electricity unit charge by the main power supplier PHCN. A summary of total energy consumed, percentages and cost are presented in Tables 7-10 and Figure 7.
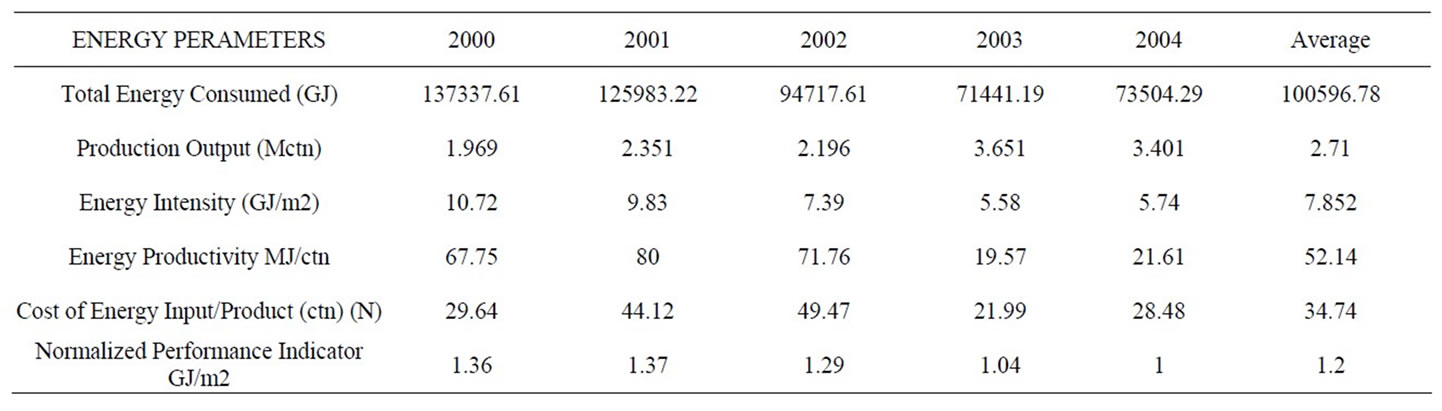
Table 6. Energy efficiency performance result of the factory.
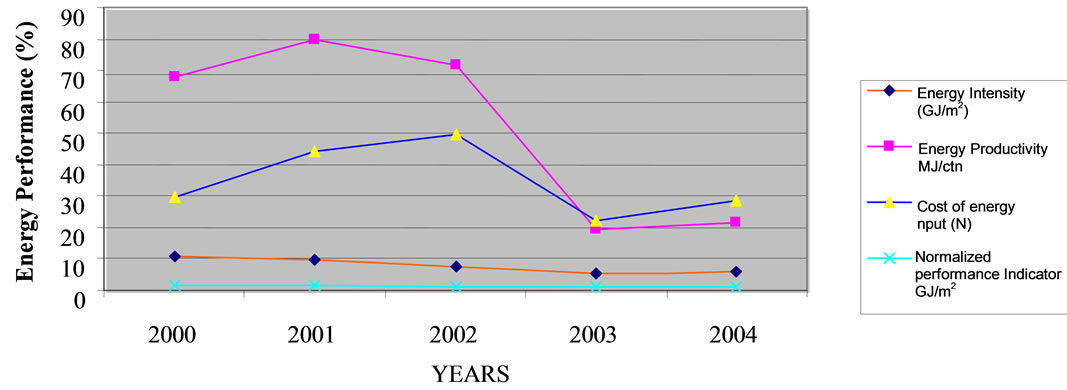
Figure 6. Comparison of different energy efficiency performance parameters.
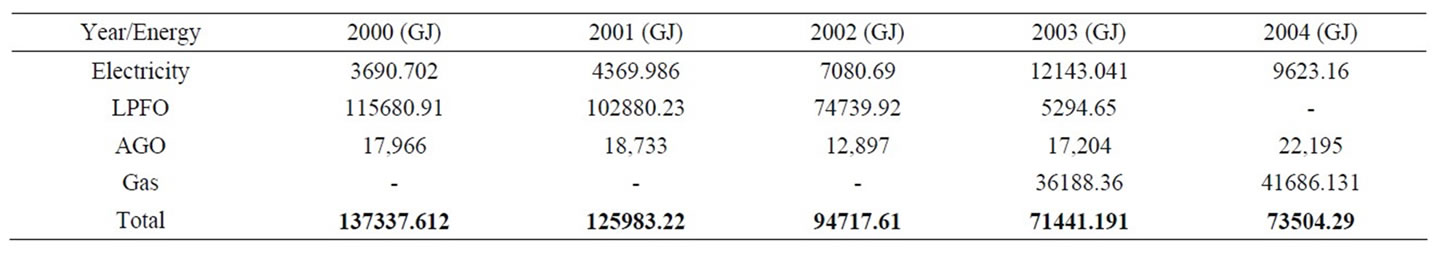
Table 7. Summary of total energy consumed.
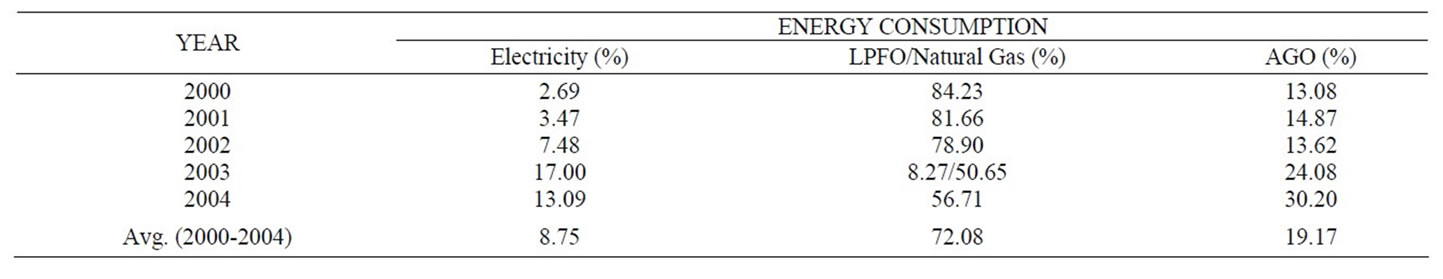
Table 8. Summary of percentage energy consumption.
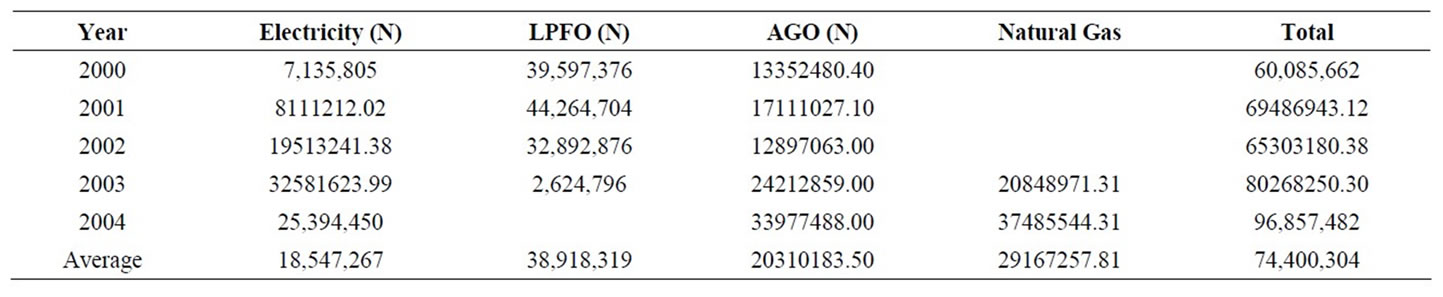
Table 9. Energy cost.
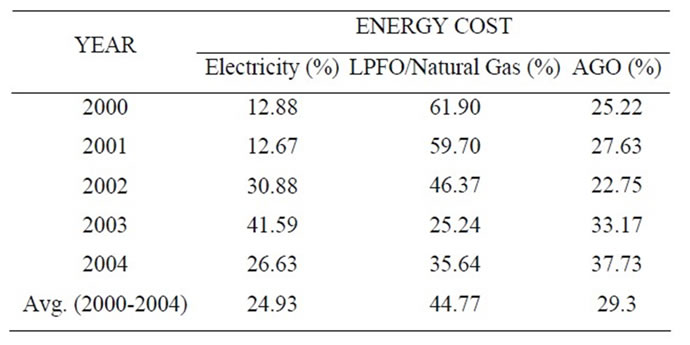
Table 10. Summary of percentage energy cost.
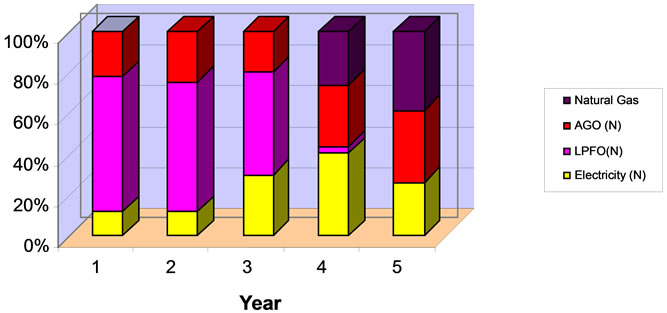
Figure 7. Percentage energy cost (2000-2004).
In the year 2004, the Company’s boilers were completely fired by natural gas and the use of LPFO was phased out due high cost of the product. Consumption information for the year 2004 is presented in a Sankey diagram as illustrated in Figure 8.
The company looses N1.4 million worth of fuel annually to increase in blowdown rate. This was due to inappropriate feed water treatment resulting into high level of TDS present in the feedwater. A saving of N1.2 million will be achieved in fuel cost annually by raising boiler efficiency to 75.3% as calculated if all losses are reduced and an economizer is incorporated. Further saving of N1.6 m worth of fuel can also be made annually if the level of water treatment is improved upon and the proportion of returned condensate is increased thereby reducing the rate of blowdown. An average saving of N0.3 million can be realized if the firm reduces her compressed air discharge pressure by 10% as calculated to meet actual production requirement. Substantial cost in power consumption can be made if obsolete and nonefficient electric motors and pumps are replaced with modern, effective and less energy rated ones.
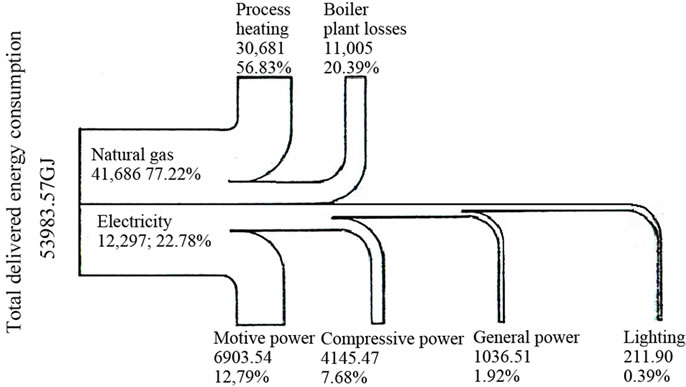
Figure 8. Sankey diagram for energy account in 2004.
The Normalized Performance Indicator (NPI) values calculated for the five years gave an average of 1.2 GJ/m2, this indicated a “fair” range which implies an average performance [8] while significant savings and improvement in energy usage is achievable. There is room for improvement to a satisfactory and good classification range.
4. Conclusions
Based on the energy efficiency study carried out on Vitamalt Nigeria Plc, Agbara, the following conclusions were arrived at:
1) For a treated floor area of 12813.57 m2 over a fiveyear period (2000-2004), average annual energy consumption was 100596.78 GJ was obtained.
2) This consumption was made up of Electricity-8.75%, LPFO/Natural Gas—72.08% and diesel fuel—19.17% while in terms of energy cost, electricity, LPFO/Gas and diesel accounted for 24.93%, 45.76% and 29.3% respectively.
3) Average annual production output (million cartons) for the five years studied was 2.407 while the NPI (normalized performance Indicator) for the factory in GJ/m2 was 1.2 which is in the “fair” range indicating that there is still room for improvement [9] in terms of energy utilization and savings.
4) Average Intensity of energy (GJ/m2) was 7.852 while average energy productivity in (MJ/ctn) was 52.14 as seen in Table 6.
5) The Average cost of energy input/product was calculated to be N34.74/carton with a lowest value of N21.99/ctn in year 2003.
6) The average cost of annual energy consumption was N74.40 million while an average yearly savings on fuel in boiler, improved feedwater quality, reduction in compressed air pressure and improved boiler efficiency to 75.3% would amount to N4.3 million.
7) Other factors that must be critically looked into are:
• Install electric meters in major production and administrative units tomonitor/curtail power wastages in each unit thereby reducing energy cost on power;
• Improve boiler feedwater quality to eliminate cost incurred in extra blowdown;
• Raise boiler efficiency by reducing flue gas losses and other losses;
• Reduce steam leakages along pipelines and improve lagging of steam pipes;
• Procurement of test equipment for energy monitoring in the factory;
• Good maintenance and control must be put in place in order to improve the energy performance of the factory and rating to “good”;
• Motivation for energy conservation among workers;
• Significant capital investment should be made in replacement of inefficient energy consuming equipment to reduce the energy consumption.
5. Acknowledgements
Our acknowledgement goes to the Management and Staff of Vitamalt Nig. Plc for the opportunity given to us to conduct the energy survey research work in their factory.
REFERENCES
- Petroleum Conservation Research Association, “What is Energy Audit,” 2004. www.pcra.org/english/aboutus/default.htm
- Microsoft Corporation Encarta Premium Suite, 2004. http://encarta.msn.com/
- P. O. Aiyedun and O. B. Ologunye, “Energy Efficiency of a Private Sector with Cadbury Nigeria Plc., Ikeja, Lagos as a Case Study,” Nigeria Society of Engineers Technical Transaction, Vol. 36, No. 2, 2001, pp. 59-63.
- C. O. Ojo, “Energy Audit of a Refinery—Case Study of Port-Harcourt Refining Company,” Master’s Thesis, University of Benin, Benin, 1995.
- Chartered Institution of Building Services, “CIBS Building Energy Code part 4, Measurement of Energy Consumption and Comparison with Targets for Existing Buildings and Services,” Chartered Institution of Building Services, London, 1982.
- The Construction Information Service, “Energy Audit for Industries,” Building Research Energy Conservation Support Unit, Department of Energy, Watford, 1993.
- The Construction Information Service, “Economic Use of Gas-Fired Boiler Plant,” Building Research Energy Conservation Support Unit, Department of Energy, Watford, 1979.
- Chartered Institution of Building Services, “CIBS Building Energy Code part 2, Measurement of Energy Consumption and Comparison with Targets for Existing Buildings and Services,” Chartered Institution of Building Services, London, 1984.
- D. K. Hale, D. Vincent and P. T. Clarke, “The Industrial Energy Thrift Scheme, Department of Industry, Energy Unit,” National Physical Laboratory, Middlesex, 1979.