Communications and Network
Vol. 4 No. 1 (2012) , Article ID: 17494 , 7 pages DOI:10.4236/cn.2012.41005
NAMD Package Benchmarking on the Base of Armenian Grid Infrastructure
1International Scientific Educational Center, National Academy of Sciences of the Republic of Armenia, Yerevan, Armenia
2Institute for Informatics and Automation Problems, National Academy of Sciences of the Republic of Armenia, Yerevan, Armenia
3Institute of Applied Problems of Physics, National Academy of Sciences of the Republic of Armenia, Yerevan, Armenia
Email: *sicnas@sci.am
Received November 22, 2011; revised December 24, 2011; accepted January 9, 2012
Keywords: Parallel molecular dynamics; NAMD benchmarking; grid
ABSTRACT
The parallel scaling (parallel performance up to 48 cores) of NAMD package has been investigated by estimation of the sensitivity of interconnection on speedup and benchmark results—testing the parallel performance of Myrinet, Infiniband and Gigabit Ethernet networks. The system of ApoA1 of 92 K atoms, as well as 1000 K, 330 K, 210 K, 110 K, 54 K, 27 K and 16 K has been used as testing systems. The Armenian grid infrastructure (ArmGrid) has been used as a main platform for series of benchmarks. According to the results, due to the high performance of Myrinet and Infiniband networks, the ArmCluster system and the cluster located in the Yerevan State University show reasonable values, meanwhile the scaling of clusters with various types of Gigabit Ethernet interconnections breaks down when interconnection is activated. However, the clusters equipped by Gigabit Ethernet network are sensitive to change of system, particularly for 1000 K systems no breakdown in scaling is observed. The infiniband supports in comparison with Myrinet, make it possible to receive almost ideally results regardless of system size. In addition, a benchmarking formula is suggested, which provides the computational throughput depending on the number of processors. These results should be important, for instance, to choose most appropriate amount of processors for studied system.
1. Introduction
It is fact that computational Grids [1-5] consists of various computational layers. The computational resources can be integrated within the organization-institution, country, region, and worldwide. In order to ensure that Armenia would not stay behind in this important area, an appropriate national Grid infrastructure has been deployed on basis of available distributed computational resources.
Particularly in 2004, the first high Performance computing cluster (Armcluster) in the South Caucasus region had been developed in Armenia. Now the Armenian Grid infrastructure [6-8] consists of seven Grid sites located in the leading research (National Academy of Sciences of the Republic of Armenia, Yerevan Physics Institute) and educational (Yerevan State University, State Engineering University of Armenia) organizations of Armenia. Apart from computing and storage resources, core Grid services [9] which enable seamless access to all resources are provided to the national user communities. Armenian leading research and educational organizations actively engage in different International Projects such as [10-13]. The Armenian National Grid Initiative has been established in 2009 and participates as a partner in the policy board of European Grid Initiative [14].
Interest in modeling of complex systems using molecular dynamics (MD) simulation has increased dramatically [15-17], and the parallel implementation makes it possible the fully understanding interesting phenomena and events, which occurs on long timescale and impossible to get from real experiments. During last decade the usage of parallel computational resources and supercomputers leads to the significant progress in bio-systems modeling [18-21]. Increasing in system dimensions and simulation time became possible with the linear increase of computational resources of distributed computing infrastructures. A number of MD software packages, like NAMD [22], GROMACS [23], CHARMM [24] and AMBER [25] are widely used and the most commonly used packages are free available NAMD and GROMACS with open source codes, which are aimed at the high performance simulation with parallel support. The GROMACS developers claim as a “fastest MD” code, meanwhile the NAMD is a most scalable and efficient on parallel runs. It should be noted that both packages use the Message Passing Interface standard for communication between the computational nodes. Recently, the comparison of NAMD and GROMACS has been done by us [26], where comparable feature analysis of both packages has been carried out. It was stated that the GROMACS has been displayed as faster as NAMD, which is probably due to united atom character, meanwhile NAMD is more suitable for simulation of relatively small systems and for detailed analysis of the system in all atom character. It was also established that NAMD shows linear increase with increase of number of processors, however GROMACS receives saturation and even goes to the worst results.
The parallel scaling of GROMACS (version 3.3) molecular dynamics code has been studied by Kutzner and coworkers [27]. They have claimed the high single-node performance of GROMACS, however, on Ethernet switched (HP ProCurve 2848 switch) clusters, they find the breakdown in scaling, when more than two nodes were involved. They have tested 3Com 3870, 3Com 5500, HP 3400CL/24 and D-Link DGS 1016D switches for up to 10 nodes and have observed no change (same results as in case of HP 2848). For comparison, the authors performed the benchmarks with Myrinet-2000 interconnection.
The scaling of NAMD to ~8000 processors of Blue Gene/L system has been presented in [28]. They achieved 1.2 TF of peak performance for cutoff simulation and ~0.99TF with PME method. The corresponding speedup values were 5048 and 4090. The Blue Gene architecture has up to 65,536 dual core processors (i.e. 216 nodes) connected by a special auxiliary torus interconnection. The NAMD scaling has been performed on 3000 processors at Pittsburgh supercomputering center [29].
In order to better understand the parallel behavior of NAMD package, a series of benchmarks have performed within the ArmGrid infrastructure by using different types of interconnections and processor features. The purpose of current research is to evaluate the parallel performance of NAMD package and estimate the role of interconnection and processor performance. The results has practical meaning to the end users to effectively port and use computational resources of the Grid sites similar to the investigated clusters.
2. Benchmarks and Results
The NAMD package is a C++ based parallel program, which is implemented using CHARM++ communication library [30]. NAMD is parallelized via hybrid force/spatial decomposition using cubes (patches) with larger dimensions than the truncation radius is. The speedup estimation of the NAMD (version 2.7) package has been benchmarked on the base of Armcluster and Grid sites located in the State Engineering University of Armenia (SEUA), Yerevan State University (YSU) and Yerevan Physics Institute (YERPHI). The usage of the above mentioned computational resources dedicated by the following factors:
• Different interconnection technologies including Myrinet (ArmCluster), Infiniband (YSU), Gigabit Ethernet (SEUA, YERPHI).
• Different node architectures including Intel Xeon 3.06 GHz (ArmCluster) and Quad Core Intel Xeon (SEUA, YSU, YERPHI).
Though the nodes of SEUA, YSU and YERPHI Grid sites based on Intel Quad Core Xeon architectures, they use different types of network interconnections, mainboards, processors and other components: SEUA—MSI X2-108-A4M/E5420 2.5 GHz, YSU—HP ProLiant BL460c/E5405 2.0 GHz, YERPHI—Dell PE1950 III/ E5420 2.5 GHz.
The system of ApoA1 (with 92224 atoms) available on the official web page of the NAMD package—is used as a benchmarking system (lipid bilayer with lipoprotein A1 in water environments). Particularely 1 fs timestep, the PME electrostatics, 12 Å van der Waals forces truncated at and  cell size are used. There are lots of benchmarking results on mentioned system and therefore, it is reasonable to examine and compare to already existing data and test the computational resources.
In molecular dynamics simulations, the parameter which describes the speed of calculation, is expanding days per ns (days/ns). The mentioned parameter has been therefore examined (Figure 1 plots the computational throughput in days per ns versus the number of processors).
As can be seen from Figure 1, good results achieved on SEUA and YERPHI Grid sites if we take into account single processor. We have received about 21 days per ns experiment on SEUA and YERPHI Grid sites, and it should be noted that we have obtained almost same value using 2 processors on ArmCluster. It is naturally to suppose, that SEUA and YERPHI Grid sites with 2.5 GHz processors treat data more quickly than ArmCluster with 3.06 GHz and the reason is the caching and 32/64 bit differences. The 32 bit 3.06 GHz ArmCluster processor deal with data slower about twice than 64 bit 2.5 GHz SEUA and YERPHI Grid sites, however further increase of processors claim the importance of interconnection rather than processor performance. Before 16 processor, one can see almost continuously decrease, meanwhile
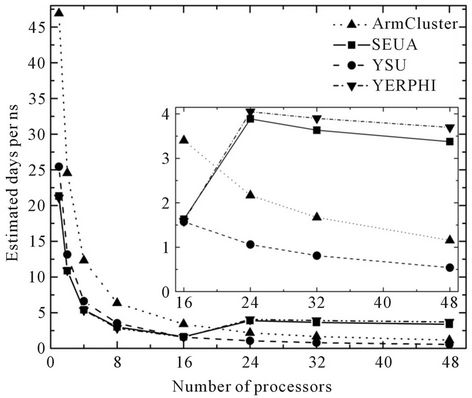
Figure 1. NAMD performance and the estimation of days/ns against the number of processors.
further increase of processors lead to the worst value for SEUA and YERPHI Grid sites. Because of using low latency and high-bandwith Myrinet and Infiniband networks, the Armcluster and YSU Grid site scale well and show better results than SEUA and YERPHI Grid sites, however, due to Infiniband interconnection, the estimation of YSU sites shows rather good values than ArmCluster with Myrinet support.
The difference is probably due to processor performance, as already mentioned, the caching. It is established that the large cache is perfectly suited for NAMD. It is important to note that the best result for the system of 92,224 atoms achieves on YSU Grid sites—48 processors. It is established that interconnection plays important role and it is obvious from Figure 1, that in comparison with simple Gigabit Ethernet, the Myrinet and Infiniband accelerates up to 4 - 7 times. The estimated speed of calculation was about 0.5 days per ns (48 processors in YSU site), which is rather good result.
To check the performance of Gigabit Ethernet equipped SEUA cluster depending on system size and to reveal the optimal number of processors, the additional testing have been performed. In this regards, we have tested 54 K, 210 K, 330 K and 1000 K systems on SEUA cluster and together with 92 K results, the data are shown in Figure 2. It is obvious that the changing of system size does not influence on the results when we take into account the systems up to 330 K atoms and we still see the breakdown in scaling at the optimal number of processors (at 16 point). After the 16 processors, with the increase of number of processors, we see also the increase of simulation time. In addition, one can see that with the decrease of system size, the sharply increase of the simulation duration occurs (the results of 92 K atoms on 24 processors is almost same as 210 K atoms on 16

Figure 2. NAMD performance and the estimation of days/ns on SEUA accordingly for 1000 K, 330 K, 210 K, 92 K and 54 K atoms systems.
processors). In case of 210 K and 330 K atoms, the difference between 16 and 24 processor results is about 0.7 - 1 days, meanwhile for 54 K and 92 K systems the differences are ~1.9 and ~2.2 days correspondingly. Hence, one can assume, that in some manner, Gigabit Ethernet equipped clusters have limitations and in our case the 2x[Node] = 16 is the optimal number of processors. However, it is most important to note, that this assumption is true, when the system size do not exceed the so called “critical amount” of atoms and therefore, for small systems, it is recommended to use 2x[Node] processors to avoid wasting computational resources. On the other hands, the further increase of system size (testing of large 1000 K systems) shows that so called “critical point” (16 processors) disappears (no breakdown is observed) and we see the decrease of estimated days per ns with the increase of the processors. As already mentioned, NAMD is parallelized via hybrid force/spatial decomposition, where for each pair of neighboring cubes (called patches) an additional force computation object is assigned, which, in its turn, can be independently mapped to any processor. For relatively small systems, the problem is that the increasing of processors lead to the spending more time on communication, however, the further increase of system size claims that the increasing of processors is more efficient rather than any type of interconnection between processors.
To testify above mentioned suggestion, an additional benchmarks on Armcluster have also been performed in order to clarify the Myrinet equipped ArmCluster’s features depending on system size. Together with nowstandard 92 K system, the 210 K, 110 K, 54 K, 27 K, 16 K systems are also examined and the curves are shown in Figure 3.
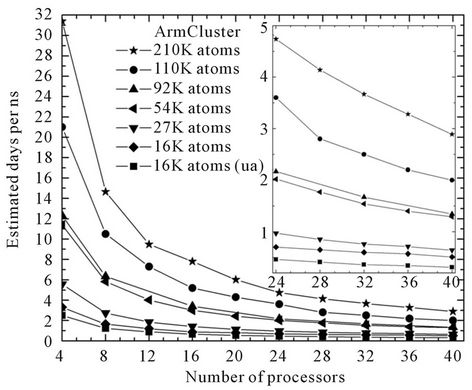
Figure 3. NAMD performance and the estimation of days/ns on ArmCluster accordingly for 210 K, 110 K, 92 K, 54 K, 27 K, 16 K and 16 K united atoms systems.
We see that increasing the system size lead to the increase to the speed of calculation, as well as, if we use the united atom character instead of all atom accelerate parallel simulation compared with all atom model.
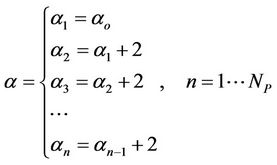
The main aim of this work is to estimate and extrapolate our benchmark findings. As one can see, there are some peculiarities depending on system size, and therefore we were trying to get in some manner a “universal” formula, which will describe the behavior of changing. According to our testing, depending on coefficients, the following formula is better describing the curves:
 (1)
(1)
where  and
and  are coefficients, which describes the physical nature of cluster (processor type, frequency, etc.) and the network (bandwidth, latency) correspondingly, the
  is number of atoms, and the
  is a number of processors. This is surely a roughly estimation, however, for ArmCluster, after the testing, we obtained results near the testing points. We have estimated the coefficients and following results were obtained.
 (2)
(2)
i.e. the coefficient can be interpret as , where
  is defined as processor frequency, i.e., in case of ArmCluster—
 . The network characterized parameter
 , which is roughly set to zero, is estimated to be as follow:
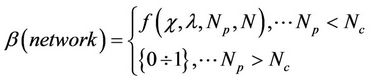 (3)
(3)
where  is a so called critical (or optimal) number of processors, which depends on system size and network type. The network coefficient
  and the complex function
  depends on many factors, like network bandwidth, latency time, etc., however the increasing processors (
 ) shows that the network parameter displays as just a correction
 . The testing and formula estimated data are shown in Table 1. We see a value drift for 4 - 16 processor range, meanwhile from 16 to 48 processor data are in well agreement with estimated findings and even roughly estimation lead to the good comparison results for Myrinet networked ArmCluster. In addition, we also estimated 1000 K large system performance on 40 processors, and we received 13.16 days per ns, and the corresponding calculation shows 13.14, which is surely excellent agreement.
The further step is the estimation of other cluster data, namely the estimation of Gigabit Ethernet equipped SEUA cluster data. According to suggested Formula (1), we have calculated and compared the data, where correspondingly the  and
and  coefficients are set to follows:
  (
( ), and the
  correction is set to be 1. The data for 1000 K large system is shown in Figure 4. As one can see the testing points are somewhat in agreement with suggested formula data.
To check the formula, we have also performed benchmarks of 210 K system on Blue Gene/P supermachine (IBM Blue Gene/P: PowerPC 450 processors, a total of 8192 cores) at Bulgarian Supercomputing Centre. The benchmarking data together with data according to Formula (1) are shown in Table 2. In overall, we find the good agreement with estimated findings.

Figure 4. NAMD performance and the estimation of days/ns on SEUA cluster for 1000 K system. The curve by suggested (1) formula is also shown.
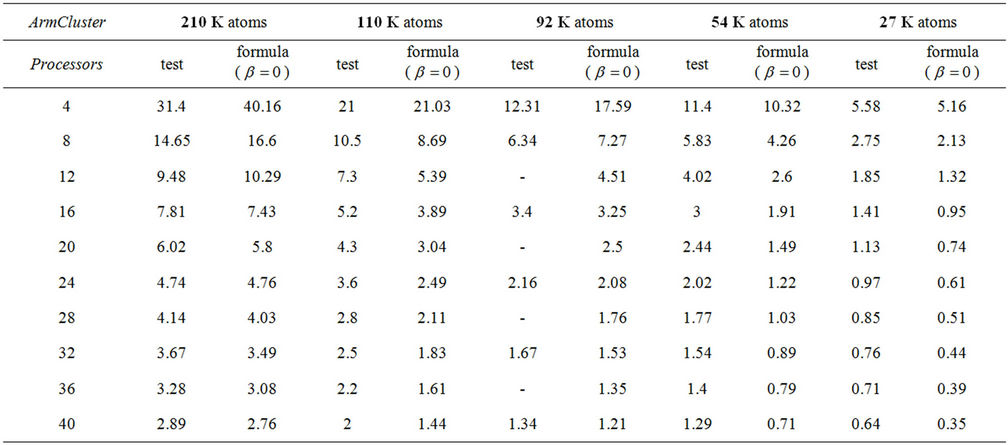
Table 1. Comparison of testing and formula data on ArmCluster, depending on system size.
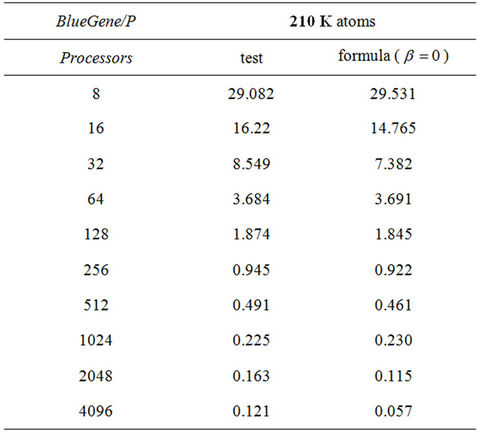
Table 2. Comparison of testing and formula data on BlueGene/P supermachine.
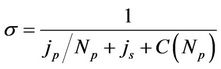
The next estimated parameter, which describes the parallelization, is the speedup  coefficient. The speedup
  measures the efficiency of using multiply processors with respect to a single one. If we take into account the communication time between processors, according to Amdahl’s law, the speedup can be interpreted as follows.
 (2)
(2)
where —number of processors,
  and
and  is the amount of job, which can be done in parallel and in serial (
 ) and the
  is a function of the number of processors and describes the network depending on the network bandwidth and the latency time. In case of ideal parallelization (Figure 5), all the operations would be perfectly parallelized—
 (
( and
and ), which means
  times faster operations. No gain observes when
 .
.
Here, the speedup (i.e. the speedup relative to one processor) was calculated by simple dividing executing time on single-processor  to the executing time on
 processors—
 .
. . The speedup calculation profiles are exemplified on Figure 5. One can see that high performance infiniband shows ideally speedup value and the breakdown in scaling is observed in case of SEUA and YERPHI Grid sites after 24 processors, as it

Figure 5. The speedup calculation on different grid sites.
is obvious from Figure 1. The breakdown of SEUA and YERPHI Grid sites is probable due to overloading of Gigabit switches. The ArmCluster also shows linear increase, however, is a bit lower than YSU with Infiniband support.
3. Conclusions
The results should be important to choose the most appropriate amount of computational resources for various types of interconnections and studied systems sizes. As a result of series of benchmarks, a formula has been obtained to provide the computational throughput depending on the number of processors, which, in our opinion, should be testified with other benchmarks in the literature.
It is stated the in contrary to high performance Myrinet and Infiniband clusters, for Gigabit Ethernet there is limit of optimal number of processors for relatively small systems. The further increase of the system size shows that the increasing of processors is more suitable than the any type of interconnection between processors: after 16 processor, Gigabit Ethernet equipped clusters shows breakdown in scaling, however for less than 16 CPUs, it scales very well. Therefore, it is expected to study the systems with various sizes in order to receive some peculiarities for GROMACS software package and as well to check and compare GROMACS data with exiting NAMD results.
4. Acknowledgements
This work was supported in part by the European Commission under EU FP7 project HP-SEE (under contract number 261499).
REFERENCES
- Armenian National Grid Initiative, 2011. http://www.grid.am
- H. Astsatryan, Yu. Shoukourian and V. Sahakyan, “Creation of High-Performance Computation Cluster and Databases in Armenia,” Proceedings of the 2nd International Conference on Parallel Computations and Control Problems (PACO ’2004), Moscow, 4-6 October 2004, pp. 466-470.
- H. Astsatryan, Yu. Shoukourian and V. Sahakyan, “The ArmCluster Project: Brief Introduction,” Proceedings of the International Conference on Parallel and Distributed Processing Techniques and Applications (PDPTA ’2004), CSREA Press, Las Vegas, Vol. 3, 2004, pp. 1291-1295.
- I. Foster, C. Kesselman and S. Tuecke, “The Anatomy of the Grid-Enabling Scalable Virtual Organizations,” International Journal Supercomputer Applications, Vol. 15, No. 3, 2001, p. 3.
- I. Foster and C. Kesselman, “Computational Grids Chapter 2 of ‘The Grid: Blueprint for a New Computing Infrastructure’,” Morgan-Kaufman, San Francisco, 1999.
- H. Astsatryan, H. Keropyan, V. Sahakyan, Yu. Shoukourian, B. Chiladze, D. Chkhaberidze, G. Kobiashvili and R. Kvatadze, “Introduction of Armenian-Georgian Grid Infrastructures,” Proceedings of the International Conference on Computer Science and Information Technologies (CSIT’09), Yerevan, 28 September-2 October, 2009, pp. 391-394.
- H. Astsatryan, “Introduction of Armenian National Grid Infrastructure,” 22nd International Symposium on Nuclear Electronics & Computing, Varna, 7-14 September 2009, p. 22.
- H. Astsatryan, V. Sahakyan, Yu. Shoukouryan, M. Daydé, A. Hurault, M. Pantel and E. Caron, “A Grid-Aware Web Interface with Advanced Service Trading for Linear Algebra Calculations,” High Performance Computing for Computational Science—VECPAR 2008, Lecture Notes in Computer Science, Springer Toulouse, 24-28 June 2008.
- Core Infrastructure Centre of Enabling Grids for E-sciencE (EGEE) Project, 2011. https://cic.gridops.org
- EU FP7, “‘South East European eInfrastructure for Regional eScience’ Project,” 2011. http://www.see-grid-sci.eu
- EU FP7, “‘Black Sea Interconnection’ Project,” 2011. http://www.blacksea-net.org
- ISTC, “‘Development of Scientific Computing Grid on the Base of Armcluster for South Caucasus Region’ Project,” A-1451, 2011.
- ISTC, “‘Development of Armenian-Georgian Grid Infrastructure and Applications in the Fields of High Energy Physics, Astrophysics and Quantum Physics’ Project,” A-1606, 2011.
- European Grid Initiative, 2011. http://web.eu-egi.eu
- M. E. Tuckerman, D. A. Yarne, S. O. Samuelson, A. L. Hughes and G. J. Martyna, “Exploiting Multiple Levels of Parallelism in Molecular Dynamics Based Calculations via Modern Techniques and Software Paradigms on Distributed Memory Computers,” Computer Physics Communications, Vol. 128, No. 1-2, 2000, pp. 333-376. doi:10.1016/S0010-4655(00)00077-1
- M. E. Tuckerman and G. J. Martyna, “Understanding Modern Molecular Dynamics Methods: Techniques and Applications,” The Journal of Physical Chemistry, Vol. 104, No. 2, 2000, pp. 159-178. doi:10.1021/jp992433y
- A. H. Poghosyan, L. H. Arsenyan, H. H. Gharabekyan, J. Koetz and A. A. Shahinyan, “Molecular Dynamics Study of Poly(diallyldimethylammonium chloride) (PDADMAC)/ Sodium Dodecyl Sulfate (SDS)/Decanol/Water Systems,” The Journal of Physical Chemistry B, Vol. 113, No. 5, 2009, pp. 1303-1310. doi:10.1021/jp806289c
- W. Dubitzky, A. Schuster, P. Sloot, M. Schroeder and M. Romberg, “Distributed, High-Performance and Grid Computing in Computational Biology,” Lecture Notes in Bioinformatics, Vol. 4360, 2007, p. 192.
- S. Sild, U. Maran, A. Lomaka and M. Karelson, “Open Computing Grid for Molecular Science and Engineering,” Journal of Chemical Information and Modeling, Vol. 46, No. 3, 2006, pp. 953-959. doi:10.1021/ci050354f
- B. Schuller, M. Romberg and L. Kirtchakova, “Application Driven Grid Developments in the OpenMolGRID Project,” In: P. M. A. Sloot, et al., Eds., Advances in Grid Computing, Lecture Notes in Computers Sciences, Springer, Berlin, Vol. 3470, 2005, pp. 23-29.
- W. Dubitzky, D. McCourt, M. Galushka, M. Romberg and B. Schuller, “Grid-Enabled Data Warehousing for Molecular Engineering,” Special Issue on High-Performance and Parallel Bio-Computing in Parallel Computing, Vol. 30, No. 9-10, 2004, pp. 1019-1035.
- L. Kale, R. Skeel, M. Bhandarkar, R. Brunner, A. Gursoy, N. Krawetz, J. Phillips, A. Shinozaki, K. Varadarajan and K. Schulten, “NAMD2: Greater Scalability for Parallel Molecular Dynamics,” Journal of Computational Physics, Vol. 151, No. 1, 1999, pp. 283-312. doi:10.1006/jcph.1999.6201
- D. van der Spoel, A. R. van Buuren, E. Apol, P. J. Meulenhoff, D. P. Tieleman, A. L. T. M. Sijbers, B. Hess, K. A. Feenstra, E. Lindahl, R. van Drunen and H. J. C. Berendsen, “Gromacs User Manual Version 3.1.1,” Nijenborgh 4, Groningen, 2002.
- B. R. Brooks, R. E. Bruccoleri, B. D. Olafson, D. J. States, S. Swaminathan and M. Karplus, “CHARMM: A Program for Macromolecular Energy, Minimization, and Dynamics Calculations,” Journal of Computational Chemistry, Vol. 4, No. 2, 1983, pp. 187-217. doi:10.1002/jcc.540040211
- D. A. Pearlman, D. A. Case, J. W. Caldwell, W. R. Ross, T. E. Cheatham, S. DeBolt, D. Ferguson, G. Seibel and P. Kollman, “AMBER, a Computer Program for Applying Molecular Mechanics, Normal Mode Analysis, Molecular Dynamics and Free Energy Calculations to Elucidate the Structures and Energies of Molecules,” Computer Physics Communications, Vol. 91, No. 1-3, 1995, pp. 1-41. doi:10.1016/0010-4655(95)00041-D
- A. H. Poghosyan, G. A. Yeghiazaryan, H. H. Gharabekyan and A. A. Shahinyan, “The Gromacs and NAMD Software Packages Comparision,” Computer Physics Communications, Vol. 1, No. 4, 2006, pp. 736-743.
- C. Kutzner, et al., “Speeding up Parallel GROMACS on High-Latency Networks,” Journal of Computational Chemistry, Vol. 28, No. 12, 2007, pp. 2075-2084. doi:10.1002/jcc.20703
- S. Kumar, C. Huang, G. Almasi and L. V. Kale, “Archieving Strong Scaling with NAMD on Blue Gene/L, ipdps,” Proceedings of the IEEE International Parallel and Distributed Processing Symposium, Rhodes Island, 25-29 April 2006, p. 41.
- J. C. Philips, G. Zheng, S. Kumar and L. V. Kale, “NAMD Biomolecular Simulation on Thousands of Processors,” Proceedings of South Carolina 2002, Baltimore, September 2002.
- L. V. K. S. Krishnan, “CHARM++: A Portable Concurrent Object Oriented System Based on C++,” ACM SIGPLAN, Vol. 28, No. 10, 1993, pp. 91-108.
NOTES
*Corresponding author.