

Advances in Pure Mathematics
Vol.06 No.09(2016), Article ID:69990,10 pages
10.4236/apm.2016.69050
An Efficient Smooth Quantile Boost Algorithm for Binary Classification
Zhefeng Wang, Wanzhou Ye
Department of Mathematics, College of Science, Shanghai University, Shanghai, China

Copyright © 2016 by authors and Scientific Research Publishing Inc.
This work is licensed under the Creative Commons Attribution International License (CC BY).
http://creativecommons.org/licenses/by/4.0/



Received 29 July 2016; accepted 21 August 2016; published 24 August 2016
ABSTRACT
In this paper, we propose a Smooth Quantile Boost Classification (SQBC) algorithm for binary classification problem. The SQBC algorithm directly uses a smooth function to approximate the “check function” of the quantile regression. Compared to other boost-based classification algorithms, the proposed algorithm is more accurate, flexible and robust to noisy predictors. Furthermore, the SQBC algorithm also can work well in high dimensional space. Extensive numerical experiments show that our proposed method has better performance on randomly simulations and real data.
Keywords:
Boosting, Quantile Regression, Smooth Check Function, Binary Classification

1. Introduction
Boosting [1] is one of the most successful and practical methods that comes from the machine learning community. It is well known for its simplicity and good performance. The powerful feature selection mechanism of boosting makes it suitable to work in high dimensional space. Friedman et al. [2] developed a general statistical framework to estimate function, which is often called a “stage-wise, additive model”.
Consider the following function estimation problem
 (1)
(1)
where  is a loss function which is typically differentiable and convex with respect to the second argument.
Estimating  from the given data
  with predictor vector
  and
and  which is response variable, it can be performed by minimizing the empirical loss
 . To minimize the loss function, one employs iterative steepest descent in functional space. This leads to the generic functional gradient descent algorithm [3] [4] .
Many boosting algorithms can be understood as functional gradient descent with appropriate loss function. For example, if  is chosen, it would get AdaBoost [2] ; if
  is used, it would reduce to L2_Boost [5] . This idea was also applied to quantile regression and classification models [6] - [8] .
Compared to classical least square regression, quantile regression [9] [10] is robust to outliers in observations, and can give a more complete view of the relationship between predictor and response. Furthermore, least square regression implicitly assumes normally distributed errors, while such an assumption is not necessary in quantile regression [10] . In quantile regression, let  be the τth quantile of the random variable Y. Hunter et al. [11] proved that
 (2)
(2)
where  is the “check function” [10] defined by
 (3)
(3)
with indicator function  if the condition is true, otherwise
 . Let
. Let  be the τth conditional quantile of Y for given x, i.e.,
 . Given training data
  with predictor vector
  and response
 , quantile regression aims at estimating the conditional quantiles
 , which can be formulated as
 (4)
(4)
Motivated by the gradient boosting algorithms [3] [4] , Zheng [7] proposed the Quantile Boost (QBoost) algorithms for predicting quantiles of the interested response for regression and binary classification in the framework of functional gradient ascent/descent. In regression problem, Quantile Boost Regression (QBR) algorithm [7] performed gradient descent in the functional space to minimize the objective function. However, the QBR algorithm applied the gradient boosting algorithm to the “check function”  without smooth approximation, and the objective function of QBR is not everywhere differentiable. Therefore the gradient descent algorithm is not directly applicable. In binary classification scenario, Zheng [7] considered the following model
 (5)
(5)
where Y* is a continuous hidden variable,  is the true model for Y*,
  is a disturb and
  is the binary class label for the observation x. The above model defines the class label Y via a hidden variable Y*. Thus the conditional quantile of the class label Y, i.e.,
  , can then be estimated by fitting the corresponding conditional quantile function of the hidden variable Y*, i.e.,
 . From the relation
  and the definition of quantile, the paper got the following relation:

which is an inequality of the posterior probability of the binary class label given the predictor vector, where  is the τth conditional quantile function of the laten variable Y* with
  as the parameter vector.
Hence, if we make decision with cut-off posterior probability value , it needs to fit the
  quantile regression function of the response. Once the model is fitted, i.e., the parameter vector
  is estimated as
 , it can make prediction by
 (6)
(6)
where  is the predicted class label for the predictor vector x. An equivalent form of the definition of quantile is introduced
 (7)
(7)
which can be proved equal to a maximized problem that the Quantile Boost Classification (QBC) algorithm [7] was proposed.
Based on [7] [12] , Zheng [8] proposed two smooth regression algorithms: gradient descent smooth quantile regression (GDS-QReg) model and boosted smooth quantile regression (BS-QReg) algorithm. The BS-QReg algorithm used a smooth function  to approximate the “check function”
  in the qunatile regression problem. It can also be seen as a smoothed version of QBR algorithm [7] .
In this paper, we consider the problem of using the smooth function  to approximate the “check function”
  in the QBC algorithm [7] .
Then we propose the Smooth Quantile Boost Classification (SQBC) algorithm, which applies the functional gradient descent to minimize the smooth objective function. Compared to QBC algorithm, the SQBC algorithm doesn’t need to transform the minimize problem to a maximize problem. And because of the use of smooth “check function” , the SQBC algorithm has a model parameter more than QBC algorithm which makes our algorithm more flexible in applications. In addition, our SQBC algorithm also can work well in high dimension spaces problems and more robust to the dataset with noisy predictors. From our experiments on simulation studies and real datasets, the SQBC algorithm has a better performance than QBC algorithm and other three state-of-the-art boost-based classifiers.
The rest of this paper is organized as follows: in Section 2, we first present the approximate smooth function of the “check function”. Then, we use the smooth operate trick to deal with our problem and give the smooth version objective function and loss function. With the application of the smooth loss function, we propose the Smooth Quantile Boost Classification (SQBC) algorithm; Section 3 discusses some computational issues in the proposed SQBC algorithm and introduces implementation details. In addition, we report the experimental results of the proposed SQBC algorithm on simulation datasets and real datasets; in Section 4, the conclusion of the paper is given.
2. Boosting Procedure for Smooth Quantile Classification
Assume  is the collection of all the weak learners (base procedures), i.e.,
  , where d is the total number of weak learners which could possibly be ¥. Denote the space spanned by the weak learners as
 (8)
(8)
Assume  be the τth conditional quantile function of the continuous latent variable Y* with
  as the parameter vector, which lies in the space spanned by the functions in
 , i.e.,
 . Given training data
  with
with  and
and . To estimate the class label
  in (6) for given the predictor vector
 , we need to estimate the conditional quantile function of the continuous latent variable Y*, i.e.,
 .
.
In this paper, instead of transforming the minimized problem in (7) to a maximized problem, we replace the “check function”  in (7) by its smooth function
  with a small α directly. The smoothed function as following
 (9)
(9)
where  is called the smooth parameter. The properties and proofs of the smooth function
  can be found in [8] .
Then, the problem becomes to solve
 (10)
(10)
However, the function  in the above minimized problem is still not differentiable at the origin
  due to the use of the indicator function
 . To apply gradient based optimized methods, we also replace
  by its smooth version [7] , and solve
 (11)
(11)
where  is the smooth version of the indicator function
  and h is a small positive value. The smooth function
  has following properties [13] :
 (12)
(12)
In this paper, we also take  as the standard normal cumulative distribution function
 (13)
(13)
We consider solving the minimized problem in (11) in the general framework of functional gradient descent with the loss function
 (14)
(14)
which is differentiable and convex to the second argument. A direct application of the generic functional gradient descent algorithm [3] [4] yields the Smooth Quantile Boost Classification (SQBC) algorithm, which is given in Algorithm 1.
3. Simulation
In this section, we first give an illustration of the calculation of the SQBC algorithm and the experiments. Then, three experiments were conducted to study the performance of the proposed SQBC algorithm. The first experiment is on four simulation datasets with different dimensions, the second one on the German bank credit score datasets with and without niose, and the third experiment is conducted on two gene expression datasets. We com- pared the SQBC algorithm with QBC [7] and three state-of-the-art boost-based classifiers. Such as L2_Boost algorithm [5] , AdaBoost algorithm [1] and LogitBoost algorithm [2] .
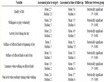
Algorithm 1. Smooth Quantile Boost Classification algorithm (SQBC).
3.1. Calculation
In Algorithm 1, the third step of SQBC algorithm can be performed by an ordinary least square regression or a decision tree etc. Hence the  may be regarded as an approximation to the negative gradient by the base procedure for SQBC. In this paper, all the boost-based algorithms used the decision stump [14] as the base procedure because its good performance in boosting algorithms [3] .
In step 4 of SQBC algorithm, the step size factor can be determined by a line search algorithm. Alternatively, for simplicity in each iteration, we could update the fitted function  by a fixed, but small, step in the negative gradient direction. It is verified that the size of ηm is less important as long as it is sufficiently small. A smaller value of fixed step size ηm typically requires a larger number of boosting iterations and thus more computing time, while the predictive accuracy has been empirically found to be good when choosing ηm “sufficiently small”, e.g., ηm = 0.1. Thus, in our experiments, the step size parameter is fixed at ηm = 0.1 for all iterations, as suggested by Bühlmann [15] and Friedman [3] .
Similar to reference [7] , the standard normal cumulative distribution function in (11) was used as approximation to the indicator function with h = 0.1.
In our experiments, we made decision at the cut-off posterior probability 0.5, therefore we fit QBC and SQBC with τ = 0.5.
In the proposed SQBC algorithm, the smooth parameter α of the smooth function  will influence the performance of the algorithm. As we know in [16] that the choice of the smooth parameter α should not too small. On the other hand, a small value of α ensures that the smooth “check function” and the original “check function” are close. In each experiment, we first do the experiment of choosing the smooth parameter α of SQBC algorithm on each dataset, then we use the result of the SQBC algorithm with the best α to compare with the other boosting classifiers.
3.2. Numeric Simulation
In this subsection, four simulation datasets were generated to study the performance of the proposed SQBC algorithm and compare to other four algorithms.
The simulation datasets generated with two classes from the model
 (15)
(15)
The detail of the four datasets are list as following:
5-Dimension Data: , Σ is a 5 × 5 matrix with the pairwise correlation between xi and xj is given by
  with r = 0.5, the error term
  follows standard normal distribution.
10-Dimension Data: , Σ is a 10 × 10 matrix with the pairwise correlation between xi and xj is given by
  with r = 0.5, the error term
  follows standard normal distribution.
20-Dimension Data: , Σ is a 20 × 20 matrix with the pairwise correlation between xi and xj is given by
  with r = 0.5, the error term
  follows standard normal distribution.
30-Dimension Data: , Σ is a 30 × 30 matrix with the pairwise correlation between xi and xj is given by
  with r = 0.5, the error term
  follows standard normal distribution.
We generated 10,000 samples for four datasets respectively. We randomly selected a training set of size 8000 from each dataset and evaluated the five algorithms on the other 2000 examples. All algorithms were run for 100 iterations. The splitting-training-testing process was repeated 500 times.
Firstly, use the principle of the choice of α in Subsection 3.1 as a guide, we demonstrate the choice of α by data generated and splitting-training-testing process above for 14 different values of the smooth parameter α. Table 1 gives the mean of testing misclassification error rates (%) of the SQBC algorithm with 14 different values of the smooth parameter α on the four simulation datasets.
Table 1 shows that the performance of the SQBC algorithm is best when α are 0.2, 0.2, 0.8 and 0.9 on 5-dimension, 10-dimension, 20-dimension and 30-dimension simulation datasets respectively.
Table 1. The mean of testing misclassification error rates (%) of the SQBC algorithm with 14 different values of the smooth parameter α on four different dimension simulation datasets.
We do the same procedure again use the other four boosting classifiers on the four simulation datasets. Table 2 shows the mean train and test misclassification error rates. From Table 2 we can see that compared to the alternative methods, SQBC achieves the best performance on all four different dimension simulation datasets.
3.3. Simulation on German Bank Credit Score Dataset
In this subsection, we compare the result of SQBC algorithm with the other four classifiers on the German bank credit score dataset used in [7] which is available from UIC machine learning repository. The dataset is of size 1000 with 300 positive examples, each has 20 predictors normalized to be in . In addition, similar to [7] , to test the variable selection ability of SQBC, twenty noisy predictors were generated from the uniform distribution on
  and were added to the origin dataset.
For the two datasets, without preselecting variables, we randomly selected a training set of size 800 from the dataset for model training and evaluated the five algorithms on the other 200 examples respectively. All algorithms were run for 100 iterations. The splitting-training-testing process was repeated 500 times.
Since the smooth parameter α of the smooth function  will influence the performance of the SQBC algorithm, we choice α on the clean and noise credit datasets. The above procedure repeated for 14 different values of the smooth parameter α. Table 3 gives the mean of testing error rates (%) of the SQBC algorithm on clean and noisy credit dataset.
Table 3 shows that the performance of the SQBC algorithm is best when α = 0.5 on clean dataset and α = 0.9 on noisy dataset. And this verifies the qualitative analysis, that is, α should be small but not too small. Thus, we use α = 0.5 in the following experiments on the clean credit datasets and α = 0.9 on the noisy credit dataset.
Based on the above result of the best smooth parameter α, we compare the SQBC algorithm to other four algorithms on the credit score dataset with and without noisy predictors using the above procedure. The mean testing error rates are listed in Table 4. From Table 4 we can see that compared to the alternative methods, SQBC achieves the best performance on both clean and noisy data. Besides, we observe that SQBC deteriorates only slightly on the noisy data, verifing its robustness to noisy predictors.
3.4. Results on Gene Expression Data
In this subsection, we compare the SQBC algorithm with the alternative methods on two publicly available datasets in bioinformatics: Colon and Leukemia [14] . In these datasets, each predictor is the measure of the gene expression level, and the response is a binary variable. The Colon dataset is publicly available at http://microarray.princeton.edu/oncology/, and the Leukemia at http://www-genome.wi.mit.edu/cancer/. See Table 5 for the sizes and dimensions of these datasets.
Similar to [7] , since all the datasets have small size n, the leave-one-out (LOO) cross validation is carried out to estimate the classification accuracy. That is, we put aside the ith observation and trained the classifier on the
Table 2. The performance of L2_Boost, AdaBoost, LogitBoost, QBC and the proposed SQBC algorithm on four different dimensions simulation datasets. Listed are the mean values of 500 train and test misclassification error rates (%).
Table 3. The mean of testing misclassification error rates (%) of the SQBC algorithm with 14 different values of the smooth parameter α on German bank credit score datasets with and without noise.
Table 4. The performance of L2Boost, AdaBoost, LogitBoost, QBC and the proposed SQBC algorithm on German bank credit score datasets with and without noise. Listed are the mean values of 500 testing misclassification error rates (%).
Table 5. The size and dimension of each dataset.
remaining (n − 1) data points. We then applied the learned classifier to get , the predicted class label of the ith observation. This procedure is repeated for all the n observations in the dataset, so that each one is held out and predicted exactly once. The LOO error number (NLOO) and rate (ELOO) are determined by
 (16)
(16)
 (17)
(17)
In LOO cross validation, the training and testing sets are highly unbalanced, which will affect the evaluation result. To provide more thorough results, we also conducted 5-fold cross validation (5-CV) and 10-fold cross validation (10-CV), in which each dataset was randomly partitioned into five or ten parts of roughly equal size. In every experiment, one part was used as the testing set, and the other four or nine parts were used as the training set.
Like the experiments above, we also choice α in SQBC algorithm on the Colon and Leukemia datasets for the three CV methods. Table 6 gives the mean of testing misclassification error rates (%) of the SQBC algorithm on each dataset and each method.
From Table 6, we can see that the SQBC algorithm performs best in the LOO CV method when α = 1.5 on Colon dataset and α = 0.7 - 2.0 on Leukemia dataset. In the 5-CV method, SQBC algorithm performs best when α = 0.01 or 2.0 on Colon dataset and α = 1.5 or 2.0 on Leukemia dataset. And in the 10-CV method, SQBC algorithm performs best when α = 0.1 on Colon dataset and α = 2.0 on Leukemia dataset.
Table 7 summarizes the LOO classification error numbers and rates of the considered classifiers on the two datasets. From Table 7, it is readily seen that on Colon dataset SQBC perform more accurate than AdaBoost, LogitBoost and QBC, but less accurate than L2_Boost. However, the results of SQBC and QBC are very close. On the Leukemia dataset, AdaBoost and LogitBoost have the best performance is. Our SQBC is more accurate than L2_Boost and QBC, but preforms worse than AdaBoost and LogitBoost. In addition, the results of SQBC and the algorithms which have the best performance are also very close.
Table 8 and Table 9 list the mean of the testing misclassification error rates of the 5-fold CV and 10-fold CV. From Table 8 and Table 9 we observe that SQBC algorithm yields the best performance on the two datasets in the 5-fold CV and 10-fold CV methods.
Table 6. The mean of testing misclassification error rates (%) of the SQBC algorithm with 14 different values of the smooth parameter α on Colon and Leukemia using LOO-CV, 5-fold CV and 10-fold CV methods.
Table 7. The leave-one-out error numbers and rates of the considered algorithms on the two gene expression datasets. For each algorithm, the misclassification numbers are provided and the error rates are listed in parentheses.
Table 8. The 5-folds cross validation mean testing misclassification error rates (%) of the considered algorithms on the two gene expression datasets.
Table 9. The 10-folds cross validation mean testing misclassification error rates (%) of the considered algorithms on the two gene expression datasets.
4. Conclusions
Motivated by Quantile Boost Classification (QBC) algorithm in [7] , this paper directly applies the smooth function  [8] to approximate the “check function” of quantile regression problem, resulting Smooth Quantile Boost Classification (SQBC) algorithm for binary classification.
Similar to QBC algorithm, SQBC algorithm can also yield local optima, work in high dimensional spaces and select informative variables. The SQBC algorithm was tested extensively on four simulation datasets with different dimensions, the German bank credit score dataset with and without noise, and two gene expression datasets. On all datasets, compared with the QBC algorithm [7] and other three popular boost-based classifiers: AdaBoost [1] , L2_Boost [5] and LogitBoost [2] , SQBC algorithm has the significantly better results. And the comparative result on credit score dataset with and without noise shows that SQBC is robust to noisy predictors. Moreover, the result of gene expression datasets shows that the SQBC algorithm can work in high dimensional spaces and have a better performance.
Recently, Chen et al. [17] described a scalable end-to-end tree boosting system called XGBoost, which proposed a novel sparsity-aware algorithm for sparse data and weighted quantile sketch for approximate tree learning. Motivated by Chen et al. [17] , we plan to develop the SQBC algorithm in the framework of XGBoost to make the SQBC algorithm more useful. In addition, in [18] , the paper applied a quantile-boosting approach to forecast gold returns. The current version of SQBC is only for binary classification problem, and we plan to develop the algorithm to do some other predicting tasks like [18] in the economics and finance.
Cite this paper
Zhefeng Wang,Wanzhou Ye, (2016) An Efficient Smooth Quantile Boost Algorithm for Binary Classification. Advances in Pure Mathematics,06,615-624. doi: 10.4236/apm.2016.69050
References
- 1. Freund, Y. and Schapire, R. (1997) A Decision-Theoretic Generalization of On-Line Learning and an Application to Boosting. Journal of Computer and System Sciences, 55, 119-139.
http://dx.doi.org/10.1006/jcss.1997.1504 - 2. Friedman, J., Hastie, T. and Tibshirani, R. (2000) Additive Logistic Regression: A Statistical View of Boosting. Annals of Statistics, 28, 337-407.
http://dx.doi.org/10.1214/aos/1016218223 - 3. Friedman, J. (2001) Greedy Function Approximation: A Gradient Boosting Machine. Annals of Statistics, 29, 1189-1232.
http://dx.doi.org/10.1214/aos/1013203451 - 4. Pierdzioch, C., Risse, M. and Rohloff, S. (2015) A Quantile-Boosting Approach to Forecasting Gold Returns. North American Journal of Economics Finance, 35, 38-55.
http://dx.doi.org/10.1016/j.najef.2015.10.015 - 5. Chen, T.Q. and Guestrin, C. (2016) XGBoost: A Scalable Tree Boosting System. arXiv:1603.02754v3.
- 6. Manski, C.F. (1985) Semiparametric Analysis of Discrete Response: Asymptotic Properties of the Maximum Score Estimator. Journal of Economics, 27, 313-333.
http://dx.doi.org/10.1016/0304-4076(85)90009-0 - 7. Bühlmann, P. and Hothorn, T. (2007) Boosting Algorithms: Regularization, Prediction and Model Fitting. Statistical Science, 22, 477-505.
http://dx.doi.org/10.1214/07-STS242 - 8. Dettling, M. and Bühlmann, P. (2003) Boosting for Tumor Classification with Gene Expression Data. Bioinformatics, 19, 1061-1069.
http://dx.doi.org/10.1093/bioinformatics/btf867 - 9. Kordas, G. (2006) Smoothed Binary Regression Quantiles. Journal of Applied Econometrics, 21, 387-407.
http://dx.doi.org/10.1002/jae.843 - 10. Chen, C. and Mangasarian, O.L. (1996) A Class of Smoothing Functions for Nonlinear and Mixed Complementarity Problems. Computational Optimization and Applications, 5, 97-138.
http://dx.doi.org/10.1007/BF00249052 - 11. Hunter, D.R. and Lange, K. (2000) Quantile Regression via an MM Algorithm. Journal of Computational and Graphical Statistics, 9, 60-77.
- 12. Koenker, R. (2005) Quantile Regression. Cambridge University Press, New York.
http://dx.doi.org/10.1017/CBO9780511754098 - 13. Koenker, R. and Bassett, G. (1978) Regression Quantiles. Econometrica, 46, 33-50.
http://dx.doi.org/10.2307/1913643 - 14. Zheng, S.F. (2011) Gradient Descent Algorithms for Quantile Regression with Smooth Approximation. International Journal of Machine Learning and Cybernetics, 2, 191-207.
http://dx.doi.org/10.1007/s13042-011-0031-2 - 15. Zheng, S.F. (2010) Boosting Based Conditional Quantile Estimation for Regression and Binary Classification. Advances in Soft Computing, 6438, 67-79.
http://dx.doi.org/10.1007/978-3-642-16773-7_6 - 16. Kriegler, B. and Berk, R. (2007) Boosting the Quantile Distribution: A Cost-Sensitive Statistical Learning Procedure. Technical Report, Department of Statitics, University of California, Los Angeles.
- 17. Bühlmann, P. and Yu, B. (2003) Boosting with the L2-Loss: Regression and Classification. Journal of the American Statistical Association, 98, 324-340.
http://dx.doi.org/10.1198/016214503000125 - 18. Mason, L., Baxter, J., Bartlett, P.L. and Frean, M. (2000) Boosting Algorithms as Gradient Descent. Proceedings of Advances in Neural Information Processing Systems (NIPS), 8, 479-485.