World Journal of Mechanics
Vol.05 No.12(2015), Article ID:62117,12 pages
10.4236/wjm.2015.512026
Analytical Model on Steel Tanks Damaged by Corrosion
Francisco Casanova-del-Angel1, Moisés Gaytán-López2
1National Polytechnic Institute, Mexico City, Mexico
2SACM SMA, Government of Mexico City, Mexico City, Mexico

Copyright © 2015 by authors and Scientific Research Publishing Inc.
This work is licensed under the Creative Commons Attribution International License (CC BY).
http://creativecommons.org/licenses/by/4.0/


Received 22 October 2015; accepted 19 December 2015; published 22 December 2015
ABSTRACT
The mechanical behavior of steel employed in the hull of a steel tank damaged by corrosion has been analyzed. The tank was used to filter a deep-water well for an 8-year period. Influence of porosity and dissolution of material may be introduced in the main constitutive relation adding a new damage variable C, which describes electrochemical damage. An elastoplastic theoretical model coupled to damage of a member, and other for damage related to thermodynamic energy are developed. This theoretical development has been used to analyze mechanical behavior of steel used in the body of a steel tank damaged by corrosion in water purifier plants, Eastern System, Mexico City, where three of every ten filters show excessive corrosion inside the steel plate filtration tanks. With samples taken from steel of the tank’s hull and reinforcement of false bottom supporting filtering material inside the tank, metallography tests were carried out; localized and generalized types of corrosion were determined, as well as the type of corrosion composites generated due to anticorrosive coating used inside the tank from its manufacturing.
Keywords:
Structural Corrosion, Damage Mechanics, Steel, Spectrometry, Tensile Stress Loss

1. Introduction
In presence of high magnitude overloads, structures show damage symptoms, characterized by degradation of elastoplastic properties. This is called damaging process. The structure, as in an uniaxial assay, goes through an elastic phase modeled by elastic behavior laws and, then, through a plastic phase with hardening (modeled by the elastoplastic behavior with hardening laws). Such hardening process is gradually lowered due to the damaging process, until the last load of the structure is reached and beginning a softening process, where damage rules over hardening, finally breaking the probe, even causing solicitation of an imposed displacement. The state law, considering the damage, is obtained taking into consideration the damaged area, as we will see throughout our theoretical development, entitled: Development of a model for damage related to thermodynamic energy.
Related to control of incrustation and corrosion when water is in rain form, it may be supposed that it is chemically balanced with the surrounding environment. When touching the soil, water dissolves certain mineral components of such, among others, calcium and bicarbonate ions. Carbon dioxide required for the reaction is continually obtained from decomposition and oxidation of organic matter of the soil due to activity of microorganisms. When water rich in calcium ions and bicarbonate is extracted from the soil and is re-exposed to air, reaction becomes inverted, carbon dioxide escapes to the air and calcium carbonate also precipitates once more.
Constitutive models define a relation between stresses and strains. Constitutive models comprised in mechanics of continuous media are presented as a promising tool to treat structural response, allowing calculation of geometrically complex structures based on finite elements codes, which allow putting together various constitutive phenomena into one formulation.
2. Mechanical Damage
The
 scalar damage variable is defined as the ratio of the damaged area Ad to the nominal area A may be expressed as follows:
 (1)
(1)
where Dn is the damage variable towards n direction, A is the intersection area with the plane, and Ad is the effective area damaged by corrosion, contained in A.
The value of D scalar damage variable is between 0 and 1 (0 ≤ D ≤ 1). D = 0, for a material without damage, and D = 1 for a material completely broken. In fact, failure occurs in a D < 1 value, through instability process.
The term effective stress, related to the effective surface resisting load, (A - Ad), is:
 (2)
(2)
Introducing in (2) the damage variable
 (3)
(3)
Thus obtaining Equation (4):
 (4)
(4)
Equation (4) defines effective stress in a material under tension. Finally, strain equivalent to the principle proposed by Lemaitre used in the elastic damage scalar classical form is:
 (5)
(5)
In this model, the mechanical effect of progressive surface loss caused by corrosion and external load is described by a single internal variable, which degrades Young’s model for material. The constitutive relation is:
 (6)
(6)
where
 and
and
 are the components of stress tensor and strain, respectively (i, j, k & l Î [1, 3]),
 is the starting rigidity module, and D is the damage variable defined before. Material is isotropic at the beginning and, together with E and
 , Young’s model and Poisson relation are respectively considered.
3. Damage by Corrosion
Since increase in material dissolution, in turn, increases porosity, its mechanical influence has been considered to be similar to the increase of holes and micro fissures, thus producing degradation of material in the area being damaged. In light of this, it is logical to introduce variable C in the stress-strain relation, in a similar way to the treatment of mechanical damage C, also within 1 and 0: where 0 for a material without electrochemical damage and 1 for a material completely dissolved. The stress-strain relation containing the two types of damage, both mechanical and corrosion, is given in (7):
 (7)
(7)
where C is the variable for damage by corrosion obtained through an electrochemical measure system, calibrated to obtain a behavior similar to mechanical damage D. It should be noticed that a similar approach was obtained for chemical damage in [1] [2] .
For calculation of damage parameter D, the damaged area value is obtained through (8), Figure 1, where A is the nominal area, w and t are the dimensions of the damaged area, Dn is the scalar damage variable, Ad is the damaged area and a is the thickness with corrosion damage.
 (8)
(8)

3.1. Elastoplastic Model Coupled to Damage of a Member
Generalized strains in joints in an elastic joints with damage and plasticity are expressed through equation (9) and are:
 (9)
(9)
where
 is the strain of elastic beam,
 is the plastic strain,
 is the strain due to damage,
 is the flexibility matrix of an elastic beam column in starting state without damage and {M} the matrix of the main directions of damage.
Supposing there is an axial generalized stress N without buckling, the
 relation allows obtaining a generalized stress-strain relation. With a uniform damage condition, the following is obtained:
 (10)
(10)
where

On the other hand, in accordance with the concentrated elasticity model, generalized strains of the member are expressed through the following relation:
 (11)
(11)
Deleting the
 term between Equations (10) and (11) we obtain:
 (12)
(12)
Equation (12) means that, in order to obtain a concentrated an elasticity model equivalent to that obtained through damage of continuous media theory, it is necessary to define axial generalized strain. It may be ob-
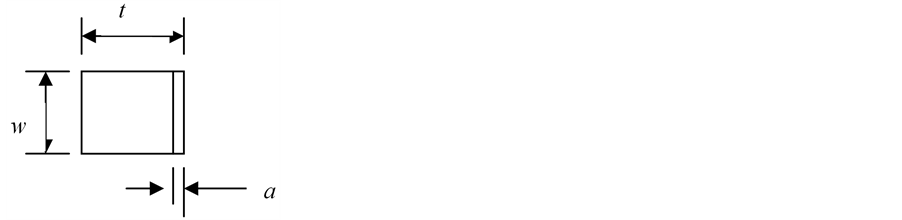
Figure 1. Mechanical damage.
served that, when damage has a zero value and joints have null flexibility (or an infinite rigidity), they behave as rigid-plastic connecting rods. If damage is equal to one, flexibility is infinite. In this case, it is equivalent to imagine that joints and beam column are disconnected and, therefore, the system may not transmit axial load.
Theoretical developments tells us that, when there are buckling effects, behavior is too complex to obtain explicit analytic expressions similar to Equation (12) valid for the general case, even using extremely simple damage evolution laws. Therefore, the existence of a set of damage internal variables
 is presented which may, as the damage of continuous media variable, have values within the [0, 1] interval, such that behavior of an elastic joints may be expressed as:
 (13)
(13)
where
 is a diagonal matrix which non-null terms are the elements of its diagonal:
 (14)
(14)
 and
and
 parameters represent a measurement of buckling damage in joints i and j, respectively. Therefore, the state law of a degradable elastoplastic member is obtained substituting equation (14) in Equation (13):
 (15)
(15)
where
 is the flexibility matrix of a degradable member and in the specific case of small strains:
 (16)
(16)
With
 the rigidity matrix of a degradable member. And for the specific case of a constant transversal section member with area A, inertia I, elasticity module E and length l, the rigidity matrix elements
 are expressed as follows:

As it may be verified, in case of the existence of a completely degraded joint
 the degraded rigidity matrix coincides with that of a member with an internal joint. And the
 damage variable reduces rigidity of the member in presence of axial actions.
Complementary strain energy of
 member may be expressed as the addition of the complementary strain energy of the elastic beam column
 and the complementary strain energy of joints:

And small strains


where U is the strain energy.
Generalized strain or stresses are obtained from complementary strain energy or strain energy, respectively, through:
 and
and
3.2. Damage According to Thermodynamic Energy
Based on damage mechanics, thermodynamic strength related to damage
 is determined, provided by (17), as derived from complementary strain energy, U, related to damage
 :
:
 (17)
(17)
where
 is the complementary strain energy of member
 with A as total transverse area of the element, E as elasticity module, and l the length of the element. N is the axial generalized stress.
The concept of thermodynamic strength related to damage comes from classical theories of degradation and fracture and may be interpreted as the strength causing damage. Deriving strain energy related to , thermodynamic stresses related to plastic generalized strains coincide with generalized strains, which justifies to have considered fluency functions as depending on such.
4. Introduction to Application
In 1869, James P. Kirkwood, Chief Engineer of the Water Department, St. Louis, USA, described European water plants in a report, which served the American Water Works Association, AWWA as a guide throughout many years to manufacture filters. Many of the first experimental works on slow-action sand filters were carried out at the Lawrence experimental station, Sanity Board, Massachusetts State, USA, which started to operate in November, 1887, and was under supervision of Allen Hazen from summer, 1888, throughout March 1893 [3] . From 1949, Jacobsen researched the dynamic effect of the fluid in aircraft containers, in 1952 Graham and Rodríguez considered that dynamic pressures of the fluid on the walls may be divided in impulsive and convective pressure. In 1957, Hosner picked up Graham and Rodríguez’ approach and proposed an analysis procedure based on a simple mass-spring model. In practice, seismic analysis of storage tanks is based on such methodology.
Mexico City has a population of more than 8,851,080 inhabitants. In 1951, the City required 4 m3/s of potable water; and in 1976 it required 9 m3/s: this increment was achieved by drilling wells in Lerma Valley [4] - [6] . As water demand increased, water was obtained from a water collection system called Sistema Cutzamala. However, such source has been insufficient. Therefore, the extraction of underground water has become necessary, taking advantage of the fact that Mexico City is seated on a natural basin. Mexico City is subdivided in 16 boroughs. Iztapalapa is the most populated boroughs in the City, with 15,789 inhabitants/km2 within a 115 km2 territory, with an inhabitant population projection of 1,850,721 by the year 2015, and a foreseen demand of 8066.42 l/s. Given that it receives 3961.32 l/s, it has an insufficient outflow for the demand.
Related to the influence of well water components in the corrosion behavior of filtering tanks, Table 1 shows two heavy metals, iron and manganese, with high influent values: 0.428 mg/l for iron and 0.272 mg/l for manganese. Regarding effluent, the 0.02 mg/l value is lower than the limit, for iron, and 0.01 mg/l higher for manganese, which defines the standard for both cases. In addition, this shows that industrial activity exists in the area where the well is located. Once purification processes and outflow to be potabilized are determined, reinforced concrete, steel or other material is used to construct tanks, sumps, containers, etc. Figure 2 shows location of 16 water treatment plants in the eastern and southern areas in Mexico City, the operation area, as well as the corresponding boroughs.

Figure 2. Areas in the Federal District for operation of potable water infrastructure. Taken from the Master Potable Water Plan for the Federal District, 1997-2010.

Table 1. Energy UT from tensile test and ductility value of steels analyzed.
After the first 8 years of operation of the eastern system water treatment plants in Mexico city, 3 out of 10 filters showed exceedingly high corrosion inside the filtering tanks with A284 Grade C steel plates and e = 9.8 mm wall thickness: indeed the corrosion rendered the filters useless. This problem made evident the need to experiment the evolution of corrosion and the structural behavior of the tank damaged by corrosion within the laboratory. Such damage by corrosion generates a local failure in the joint of the false bottom, supporting filtering material, with the wall of the auto-supported tank. Such local failure causes total and/or partial suspension of potabilized water supply to Mexico City. Due to the functioning of such pressurized steel tanks, it is not possible to periodically check the evolution of corrosion inside them: the operation filtering tank would have be suspended, thus affecting potable water supply for up to forty days, i.e. the period required to remove filtering material and properly check false bottom and the wall of the tank.
We move now to look at the development of the experiment, in order to obtain data related to corrosion in the wall of the damaged filtering tank within a determined period of time; damage analysis, both mechanical and by corrosion; corrosion speed assessment; and discussion of results.
4.1. Experimental Development
Metallographic analysis was carried out to confirm steel used, the corrosion compounds, as well as to determine of the type of damage by corrosion; in A284 Grade C steel with e = 9.8 mm plate thickness used in the hull of the tank and A36 steel with e = 6.35 mm plate thickness used in the reinforcement of the false bottom.
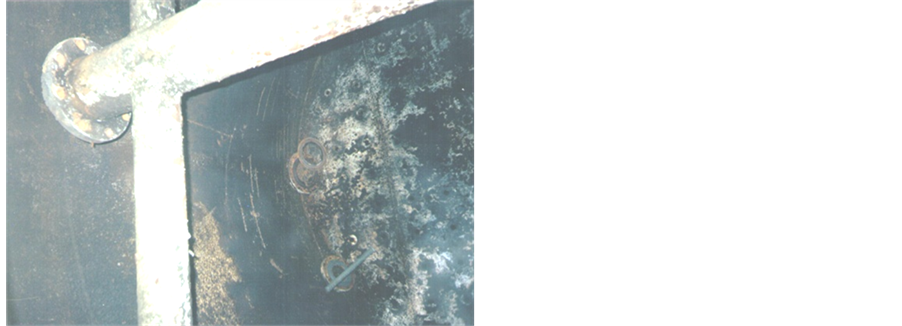
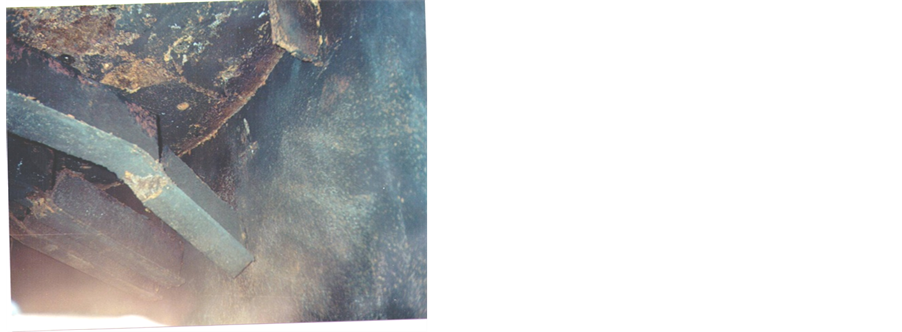
Six samples of two different thicknesses intervening in the structure of the tank were taken, hull of the tank with 9.8 mm thickness, and a sample of the beams supporting the false bottom inside the tank, 6.35 mm thick, Figure 3(a) and Figure 3(b), based on [7] . Dimensions of the sample were 30 × 20 × 9.5 mm and 30 × 20 × 6.35 mm.
4.2. Results of Metallographic Analysis
Figure 4(a) shows the resulting microstructure of “Small Sample” steel pieces (A36 steel, dimensions: 30 × 20 × 6.35 mm) and “Small Sample” (A284 Grade C steel, dimensions: 30 × 20 × 9.52 mm). In the Small Sample
 (a) (b)
Figure 3. Steel tank damaged by corrosion. (a) Interior of a steel tank under analysis; (b) reinforcement of the false bottom plate. View from below the false bottom.

 (a) (b)
Figure 4. Microstructure of A36 steel piece. (a) Small sample steel pieces. A36 steel with dimensions: 30 × 20 × 6.35 mm; (b) small sample steel pieces. A284 Grade C steel with dimensions: 30 × 20 × 9.52 mm.
shown in Figure 4(b) as M_chica (6) a high quantity of inclusions may be observed, relatively higher than those in sample M_grande (3). M_chica (3) macrograph, obtained by means of secondary electron technique, reveals microstructure of the sample, which includes perlite grains approximately 50 µm - 70 µm long, surrounded by ferrite. This micrography shows that the presence of such inclusions is still evident. Sample M_grande (3) shows a uniform distribution of inclusions in a lower proportion, and less when compared with the Small Sample, which has an approximate interval of 3 µm - 5 µm. Micrography of figure M_grande (3), obtained by means of compositional model technique (retro-dispersed electrons), shows a microstructure with perlite grains 80 µm and 100 µm long, with inclusions.
Spectrum of Figure 5 shows, separately, elements which, in the corresponding environment, react creating compounds which generate the development of corrosion in the metal. Figure 6 shows the profile of the A284 Grade C steel sample, where damage by corrosion may be observed.
4.3. Assessment of Corrosion Speed
In accordance with results obtained by metallographic analysis, an acceptable 0.2 mm/year corrosion speed is determined for A284 Grade C steel probe, which allows us to consider that, in another 8-year operation period, the structure will also maintain an acceptable corrosion speed, since corrosion compounds generate a passivation
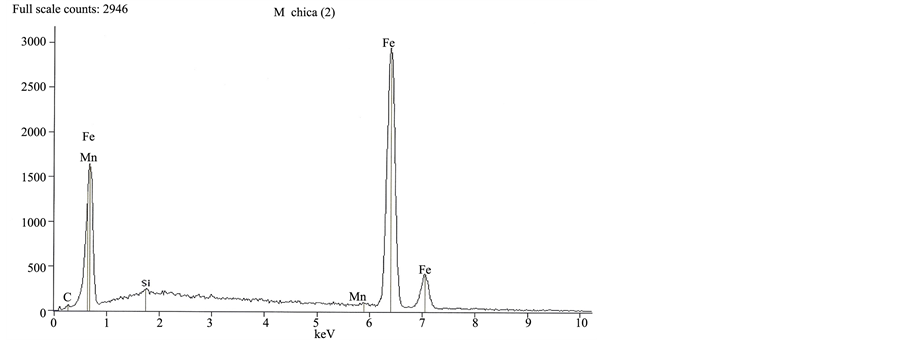
Figure 5. Distribution of chemical elements frequencies conforming metal and corrosion elements (A36 steel).
 (a) (b)
Figure 6. Microstructure (profile) of A284 Grade C steel named M_grande (3). (a) Corrosion compound and anticorrosion coating debris; (b) depth of generalized corrosion damage.
layer controlling and inhibiting corrosion, which allows us to expect proper behavior of structure, even in case of losing the whole coating due to corrosion, as provided by the Rules for Construction in the Federal District, which is 1/6 of calculated plate thickness. In this case, there was a 3 mm increase [8] .
4.4. Tensile Strength of Analyzed Steel
Tensile strength of material is obtained under the stress-strain curve of the tensile test integrated between yield strength and maximum stress (εy and εmáx). Adjusted curve for A284 Grade C not corroded steel provides us with a Degree 5 polynomial, which integration between points εy = 0.0025 and εmáx = 0.2148 shows a 88.495 MPa tensile strength of material, Figure 7, blue curve. For damaged area between εmáx = 0.2148 and εu = 0.295, energy in the damaged area in the reference probe is: 29.10 MPa, Figure 7, blue curve. For not corroded A284 Grade C steel, tensile strength Ut of not corroded A284 Grade C steel is: 59.60 MPa, Figure 7, red curve. For the damaged area, there is a Degree 4 polynomial, and the value of energy in the damaged area is 28.273 MPa, Figure 7, red curve.
4.5. Not Corroded A36 Steel
For not corroded A36 steel, there is a Degree 6 polynomial with limits: εy = 0.0030, εmáx = 0.078 and 37.26 MPa tensile strength Ut, Figure 8, blue curve. Energy (equal to the area under the stress-strain curve for not corroded
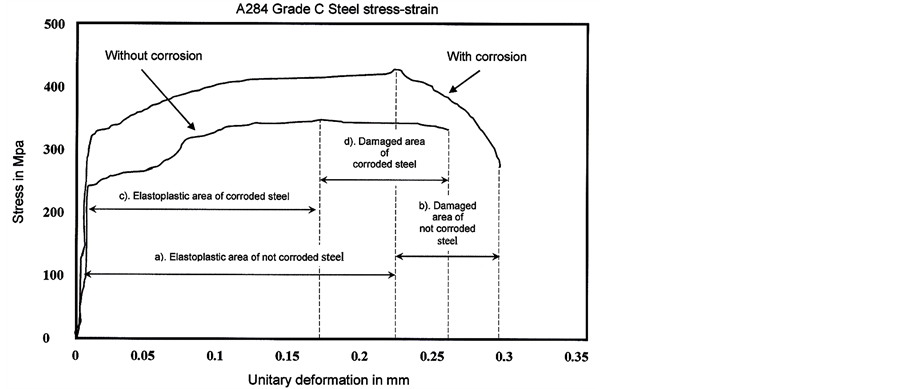
Figure 7. A284 Grade C Steel. (a) Tensile strength calculation for reference not corroded probe; (b) energy calculation in damaged area for reference not corroded probe; (c) tensile strength calculation for corroded probe; and (d) energy calculation in damaged area for corroded probe.

Figure 8. A36 Steel. (a) tensile strength calculation for reference not corroded probe; (b) energy calculation in damaged area for reference not corroded probe; (c) tensile strength calculation for corroded probe; and (d) energy calculation in damaged area for corroded probe.
A36 steel damaged area) is obtained integrating a Degree 4 polynomial to data between εmáx = 0.080 and εu = 0.124 limits, Figure 8, blue curve, providing us with a 22.98 MPa value.
4.6. Corroded A36 Steel
Tensile strength of corroded A36 steel, based on a Degree 5 polynomial, is 20.97 MPa, Figure 8, in green. Energy in damaged area for corroded A36 steel is: 15.045 MPa, shown in Figure 8, in green. Table 1 shows data for energy UT from the tensile test, as well as ductility value of analyzed steels in the three areas for both steels.
For A284 Grade C steel, a 925.8 (N∙m) maximum value has been observed for a 0.9 damage, which shows higher ductility of A284 Grade C steel, while for corroded probe, a 531.93 (N∙m) maximum value has been obtained for a 0.9 damage, 57% energy of not corroded probe in accord to (17). For A36 steel, a 358 (N∙m) the maximum value has been observed for a 0.9 damage, and a 284.067 (N∙m) value for a 0.9 damage in the corroded probe, representing 79% energy of not corroded probe.
5. Discussion of Results
Heavy metal concentrations are indicators of the damaging and corrosion process already present in the tank, and the gradual detachment of metals in the inside. For influent, such concentrations may be due to damaging and corrosion process of pipes feeding the well. This shows that, in effect, the corrosion process occurs in 5 phases. In our case, the first phase is related to the effluent effect; the second one is transition of humidity excess effect; the third one is first phase of corrosion effect; the fourth one is transition of corrosion effect; and the fifth and last one is stabilization of corrosion effect [9] .
Yield strength determined for A284 Grade C steel in the reference probe, was 295 MPa (3000 kg/cm2), very close to the theoretical 290 MPa (2950 kg/cm2) value. The stress value for corroded steel was 237 MPa (2416 kg/cm2). It can be considered that A284 Grade C steel underwent a 19.5% yield strength loss. As Figure 9 shows, such difference has low influence on structural behavior of steel, since a maximum allowable stress equal to 2/3 of yield strength , 193 MPa (1966 kg/cm2), was taken into consideration in the design of structural elements, in this case, of the hull of the tank. Acting stresses are even lower, which is confirmed in view of radial displacements of hull of the tank, taking into consideration loss of thickness due to corrosion.
In the test carried out on A36 steel, yield strength value for non-corroded steel was determined as 368 MPa (3750 kg/cm2), the theoretical value for such stress is 345 MPa (3500 kg/cm2) and the value determined in test for corroded steel is 312 MPa (3181 kg/cm2). It was determined that steel lost 15.5% stress yield strength, as shown in Figure 10. The structural element designed with such steel is the false bottom support for filtering material inside the steel tank. Such element is an “I” profile with plate, including the false bottom plate as higher skid. Such type of profile is more sensible to plate thickness loss due to corrosion.
A284 Grade C steel shows a 32% decrease of energy in elastoplastic area, while A 36 steel shows a 35% decrease of energy in this area, Table 1. This is due to higher ductility of A284 Grade C steel, which has a 13.88% ductility loss due to corrosion after 8 years of operation. A36 steel has a 17.5% ductility loss, in the same period, that is, it loses more ductility due to the composition of steel.
An ultimate 925.8 (N∙m) value for 0.9 damage has been observed for A284 Grade C steel. This shows higher ductility of A284 Grade C steel. An ultimate 358 (N∙m) value for 0.9 damage has been observed for A36 steel, due to lower ductility of such steel.
Upon tank examination, determination of minimal thickness of tank was found to be adequate, where internal pressure determines thickness and, since the formula does not take into consideration coating to prevent corro-
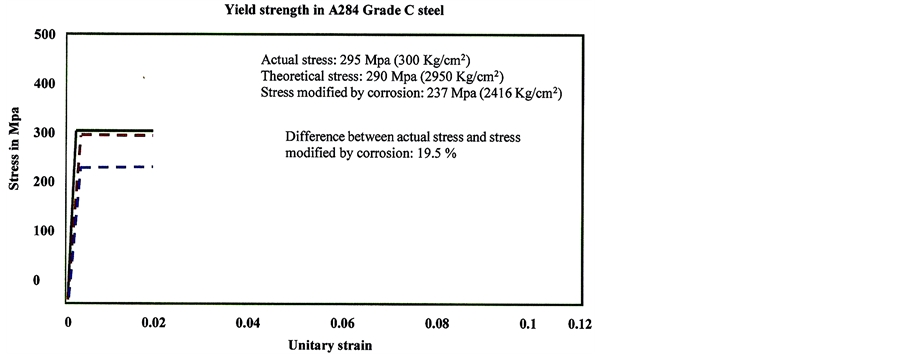
Figure 9. Yield strength stress comparison between corroded and not corroded A284 Grade C steel.

Figure 10. Yield strength stress comparison between corroded and not corroded A36 steel.
sion, the corresponding standard [10] [11] , requires the addition of 1/6 of determined thickness, thus obtaining a proper safety level. This has been verified since, after 8 years of operation, steel showed generalized corrosion with a corrosion speed classified as good, being between 0.1 and 0.5 mm/year.
Stresses on the tangent line below the hull of the tank under analysis are 365.25 kg/cm2. With stress combination due to a seismic event, the most adverse one, such stress increases up to 574.31 kg/cm2, this being half the maximum allowable 1165 kg/m2 stress, and corrosion does not imply an increase in stress, since the thickness increase to prevent corrosion is three times higher due to the corrosion loss shown in such period of time. In the design of false bottom and “I” profile supporting such, it was found that such profile is more sensible to variation of thickness in such section. Therefore, it shows an increase of stress where, due to thickness loss caused by corrosion, cutting stress increases from fv = 1042 kg/cm2 up to fv = 1403 kg/cm2, thus going beyond the allowable FV stress, even with reinforcement in both directions.
6. Conclusions
The theoretical development of damage analysis presented allows understanding the loss of strength phenomenon in metals caused by combined mechanical and electro-chemical corrosion damage effects. A-284 Grade C steel had a higher strength loss measured as fluency stress compared to loss of A-36 steel. The carbon content in steel composition influences variation of strength loss. Steel with higher carbon content has a lower fluency stress and shall also have a higher strength or fluency stress loss due to its higher ductility.
Local failure of false bottom in the filtration tank is due to cracks in tubular connections, since such are areas of high concentration of stresses and high residual stresses. In addition, in those areas the presence of defects in welding is very common. Cathode protection must be considered in the design of such filtration tanks, placing anodes in sections where corrosion is more severe. In our case, it is the joint of the hull with the false bottom.
Carbon steels show, in general, a micro-structure composed by ferrite and perlite, in normal state, as they leave the plant. Grains of material are oriented towards the lamination direction. Among these grains, a flat dislocations distribution prevails. Such dislocations grow as carbon content increases. The metallographic study of the two steels analyzed determined that there are no dislocations of material in their composition which may be considered as a factor of size increasing continuous damage.
The passivation phenomenon in analyzed steel may be considered, since creation of a protecting surface layer of corrosion products such as iron oxide and other ferrous composites derived from anticorrosion coating used in the manufacture of the tank, inhibits dissolution reactions of the metal. This could be observed with the scanning electron microscope.
The benefits of adopting a predictive maintenance strategy would benefit in knowing integrity degree of the inside of the tank, and the joint of the false bottom with the wall of the tank, which may be achieved only draining the tanks and coming into such. Some additional benefits would be extending the useful life of the tank, increasing safety and reducing maintenance costs.
Acknowledgements
This document was developed with part of the time devoted to the IPN-SIP 20120585 research project.
Cite this paper
FranciscoCasanova-del-Angel,MoisésGaytán-López, (2015) Analytical Model on Steel Tanks Damaged by Corrosion. World Journal of Mechanics,05,274-285. doi: 10.4236/wjm.2015.512026
References
- 1. Bolotin, V.V. and Shipkov, A.A. (2001) Mechanical Aspects of Corrosion Fatigue and Stress Corrosion Cracking. International Journal of Solids and Structures, 38, 7297-7318.
- 2. Gérard, B., Pijaudier-Cabot, G. and La Borderie, C. (1998) Coupled Diffusion-Damage Modelling and the Implications on Failure Due to Strain Localisation. International Journal of Solids and Structures, 35, 4107-4120.
- 3. Fair, G.M., Geyer, J.C. and Okun, D.A. (1979) Purificación de agua y tratamiento y remoción de aguas residuals. Volumen II. Editorial LIMUSA. México.
- 4. DGCOH (1997-1) Elaboración de anteproyectos para solucionar los problemas de suministro de agua en diversas colonias de la Delegación Iztapalapa. Consultoría en Ingeniería Itzana S.A. de C.V. Dirección Técnica, Subdirección de Programación. U.D. Planes Hidráulicos Delegacionales. Dirección General de Construcción y Operación Hidráulica. Secretaría de Obras y Servicios. GDF. México.
- 5. DGCOH (1997-2) Diagnóstico de la problemática de suministro de agua potable y drenaje en la Delegación Iztapalapa. Automatizaciones y proyectos de Ingeniería S.A. de C.V. Dirección General de Construcción y Operación Hidráulica. Secretaría de Obras y Servicios. GDF. México.
- 6. DGCOH (1995) Criterio para sancionar la calidad de agua potable. Dirección General de Construcción y Operación Hidráulica. Secretaría de Obras y Servicios. DDF. México.
- 7. ASTM (American Society of Testing Material) Designation: E8-01 (2002) Standard Test Methods for Tension Testing of Metallic Materials.
- 8. RCDF (2004) Reglamento de Construcciones para el Distrito Federal. GDF. México.
- 9. Casanova-del-Angel, F. and Toquiantzi Butrón, R. (2008) Corrosion Phases of Structural Shapes Exposed to the Atmosphere. Corrosion Science, 50, 2288-2295.
http://dx.doi.org/10.1016/j.corsci.2008.05.015 - 10. Standard API 620 (1990) Para tanques de almacenamientos sometidos a presiones internas cercanas a 1 kg/cm2.
- 11. Standard API 650 (1998) Aplicable a grandes tanques horizontales o verticales soldados en campo y presión de operación menores de 1 Kg/cm2.