World Journal of Mechanics
Vol.3 No.3(2013), Article ID:32623,6 pages DOI:10.4236/wjm.2013.33017
Estimation of Fatigue Life of Laser Welded AISI304 Stainless Steel T-Joint Based on Experiments and Recommendations in Design Codes
Division of Structures and Materials, Aalborg University Esbjerg, Esbjerg, Denmark
Email: shl@civil.aau.dk
Copyright © 2013 Søren Heide Lambertsen et al. This is an open access article distributed under the Creative Commons Attribution License, which permits unrestricted use, distribution, and reproduction in any medium, provided the original work is properly cited.
Received February 11, 2013; revised April 9, 2013; accepted May 10, 2013
Keywords: AISI304; Laser Welding; Austenite; Martensite
ABSTRACT
In this paper the fatigue behavior of laser welded T-joints of stainless steel AISI304 is investigated experimentally. In the fatigue experiments 36 specimens with a sheet thickness of 1 mm are exposed to one-dimensional cyclic loading. Three different types of specimens are adopted. Three groups of specimens are used, two of these are non-welded and the third is welded with a transverse welding (T-Joint). The 13 laser welded specimens are cut out with a milling cutter. The non-welded specimens are divided in 13 specimens cut out with a milling cutter and 10 specimens cut out by a plasma cutter. The non-welded specimens are used to study the influence of heat and surface effects on the fatigue life. The fatigue life from the experiments is compared to fatigue life calculated from the guidelines in the standards DNV-RP-C203 and EUROCODE 3 EN-1993-1-9. Insignificant differences in fatigue life of the welded and non-welded specimens are observed in the experiments and the largest difference is found in the High Cycle Fatigue (HCF) area. The specimens show a lower fatigue life compared to DNV-RP-C203 and EUROCODE 3 EN-1993-1-9 when the specimens are exposed to less than 4.0 1E06 cycles. Therefore, we conclude that the fatigue life assessment according to the mentioned standards is not satisfactory and reliable.
1. Introduction
S-N curves are based on experimental data, where traditional welding methods are adopted. Therefore, the S-N curves may not correctly represent the fatigue life, where the laser welding method and other non-traditional welding methods are applied. Nowadays the high-speed laser weld method is widely used in the industry. Hence the standards might need new S-N curves that correctly represent the fatigue life of laser welded stainless steel materials. Laser welding is commonly used to assemble small components in the biomedical, electronics and aerospace industry [1].
In these applications weldings require a very small melted area, hence small laser beams less than 1 kW are used. The Nd:YAG laser beam has been developed further and the maximum heat output is increased to 6 kW [2]. Consequently, it is possible to weld sheet components with a higher thickness. Today AISI304 sheets with a thickness up to 12 mm can be assembled with a modern Nd:YAG laser. Therefore, the application area of the laser welding method is expanded to include traditional welding tasks and the laser welding replaces the TIG and MIG/MAG welding methods.
One of the most significant types of laser welding is the keyhole method [3], which is also used in this study. With the keyhole method it is possible to weld, in one process, perpendicular plates. Therefore, in production of perpendicular plate assemblies the keyhole welding method permits high production volume and a low manufacturing price. The possibility to weld a perpendicular assembly in one single process has been requested by the industry for many years. Therefore, the keyhole method became one of the most important welding procedures with the laser technology. However, when the keyhole welding is used higher stress concentrations are generated in the welded zone and consequently a lower fatigue life can occur. The fatigue behavior of dynamic loaded structures, where the keyhole method is adopted has not been investigated thoroughly in the literature. Therefore, it is necessary to investigate the fatigue life of T-joints exposed to dynamic loading. Laser welding is more effective compared to traditional welding methods, i.e., the process is faster and more energy in supplied to a smaller welding area [4]. However, the small melted area cools down rapidly and high thermal stresses are introduced [5]. The thermal stress influences the metallurgy in the welding area and thereby the mechanical properties [6].
1.1. Guidelines
The present guidelines for fatigue assessment of different types of welded joints according to the design standards are quite general. For stainless steel the assessment is independent of several important aspects mentioned next. Geometrically, the laser welding also cause a smaller welding compared to traditional welding types. However, the smaller welding toe implies in most cases higher stress concentrations and accordingly the fatigue life is decreased. Furthermore, rotating bending fatigue tests [7] with AISI304 materials have shown that the fatigue life is sensitive to the initial defects in the material. The higher stress concentrations are not properly accounted for in the current design guidelines because they are based on experiments with relatively smooth welding’s. The guidelines suggest that an averaged thickness of the sheets and an averaged size of welding toes are used in the fatigue assessment. A fatigue calculation based on these averaged values may not provide a reliable estimate of the fatigue life. The size of the welding toe is known to have a greater impact on the fatigue life in a thin sheet application compared to a situation, where a thick sheet is used [6]. The higher sensitivity in thin plates is caused by the stress concentration in the normal plane to the specimen. When the welding toe is large compared to the plate thickness the toe has a considerable influence on the fatigue life [8] and [9]. A reliable estimate of the fatigue life requires that the geometry of the welding toe is taken into account in the design guidelines.
1.2. Material
In the design standards the fatigue assessment guidelines are based on structural steel like S235JR. These types of steel do not show the same tendency in change of the microstructure under the maximum crack length is decreased. However, the crack growth rate is also decreased. The induced strains ahead of a fatigue crack tip can activate a transformation of an austenitic structure to welding process compared to stainless steel. Therefore, we do not expect that the fatigue life calculated based on the standards fit the fatigue life observed in the experiments, where thin sheets of stainless steel AISI304 are tested. In some types of stainless steel including AISI304 the microstructure is changed i.e. austenitic phase is transformed into a martensitic phase. This transformation is mainly controlled by plastic strain rates and the temperature [10-12]. In case of low temperatures a higher amount of martensitic phase is generated [13-15]. The martensitic phase is more brittle than the austenitic phase. Therefore, the fracture toughness limit is lower and a martensitic structure [16-20]. Furthermore, this transformation also changes the volume and the expansion of the material can lead to compressive stresses. Hence deformation induced martensitic transformation increases fatigue resistance significantly and the threshold stress intensity decreases. The standard S-N curves for welded structural steel do not include the mean stress because of welding introduced residual stresses. In stainless steel the residual stresses coming from the laser welding process are often more significant compared to standard structural steel. Therefore, the higher compressive stresses in the welding zone can lead to crack propagation resistance [21-23]. However, the tensile stresses in the welding zone are increased accordingly and crack initiations are more probable.
1.3. The Study
In this study the fatigue life of welded and non-welded specimens is investigated experimentally. The welded specimens are produced with the keyhole laser welding method. The results from the experiments are compared to the results from the standards, where the S-N curves are based on structural steel and traditional welding methods. Hence this comparison and possible deviations will reveal if the guidelines for fatigue assessments in the current standards can be safely adopted when stainless steel is considered.
2. Experimental Details
The stainless steel used in the experiments is AISI304 and the sheets have a thickness of 1 mm. The welded specimen is a T-joint welded with the keyhole method by a laser and is shown in Figure 1. The concentration of the elements Cr, Ni, S, Mn, Mo, Si and C of the austenitic phase are determined by Electron Probe Micro Analysis. The AISI304 composition is 0.036% C, 0.42% Si, 1.28% Mn, 0.031% P, 0.0010% S, 18.21% Cr, 8.30% Ni.
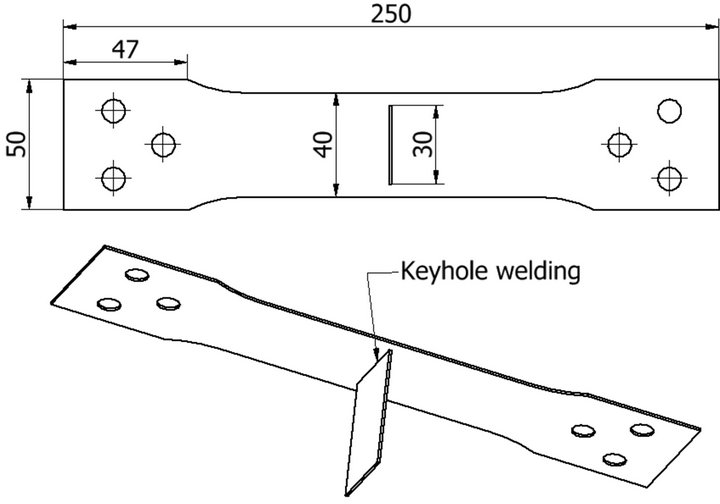
Figure 1. The geometry of the laser welded specimen in AISI 304.
The mechanical properties are σp0.2% = 279 MPa, σp1% = 310 MPa, σU = 635 MPa ultimate strength and 57% elongation. Three different types of specimen are used in the fatigue tests. Two types are non-welded, where one type is cut with a plasma cutter, whereas the other nonwelded type is cut with a milling cutter. The third type is a specimen with a transverse welding with respect to the load direction (T-joint). The welding is carried out with a 2 kW NdYAG laser with a speed of 40 mm per second. Argon gas is used to prevent oxidation of the steel. The steel surfaces are smooth with a maximum variation of 0.01 mm. The welded surfaces have a variation around 0.1 mm. A standard servohydraulic Instron 1255 test machine is used. The experiments are load controlled with a constant amplitude sinusoidal wave form with R = 0.1 and load frequencies in the interval (2 - 12) Hz. The test is completed when a final fracture occurs. The temperature in the laboratory is in the interval (19˚C - 23˚C). The geometry is hourglass formed with a design approximation of ASTM E466 and E468. Two different methods have been used to cut out the non-welded specimens. The different defects from this cutting process are observed and the influence on the fatigue life is established. The knowledge about these defects can be transformed to a tolerable defect size for the S-N curve.
In Figure 2 the non-welded specimen geometry cut by the milling cutter is shown and Figure 3 shows the geometry cut by the plasma cutter.
The missing data points do to the limit number of sample is estimated with interpolation between the low and high cycle fatigue life.
3. Results
The shape of the welding significantly influences stress concentrations. Thus the shape of the welding is an important factor in the estimation of the fatigue life. A macro photo of the cross section of the welding is shown
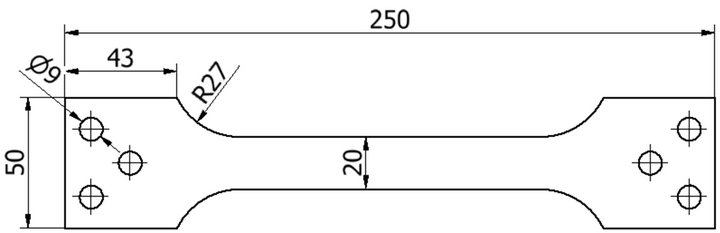
Figure 2. The geometry of the modified non-welded specimens cut out with a milling cutter.
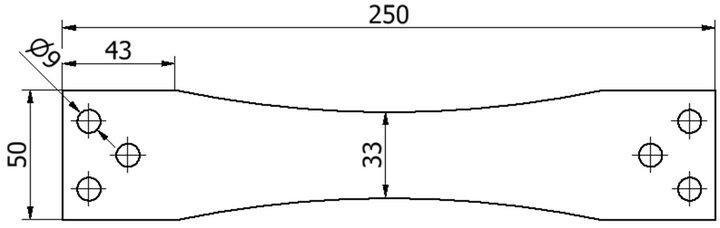
Figure 3. The geometry of the modified non-welded specimens cut out with a plasma cutter.
in Figure 4. The welding has clear defects, which introduce high stress concentrations. The shape is like a wedge in the area where the two parts are welded together. A crack most probably initiates at the end of the wedge shape and the fatigue life will be lower compared to a specimen with a smooth welding. No materials are added during the welding process, which explains these clear defects shown in Figure 4.
Figure 4 clearly reveals that the shape of the toe is non-smooth at the corner compared to a welding geometry obtained from a traditional welding method. In a standard welding procedure this geometry is not acceptable. However, in many configurations with thin sheets and laser welding’s these defects are acceptable because generally these types of welding are exposed to low stress levels. The results of the fatigue test of the nonwelded specimens are shown in Figure 5.
In the low cycle area the fatigue life is nearly identical for the two specimens. In the high cycle fatigue (HCF) area the specimens cut by the milling cutter tend to show a higher fatigue resistance. The tendency is that the fatigue resistance is low for the specimens cut by plasma compared to the specimens cut by the milling cutter. However, the difference in fatigue life for the two types of specimens is insignificant and it can be assumed that the fatigue life is identical. Furthermore, the S-N curve
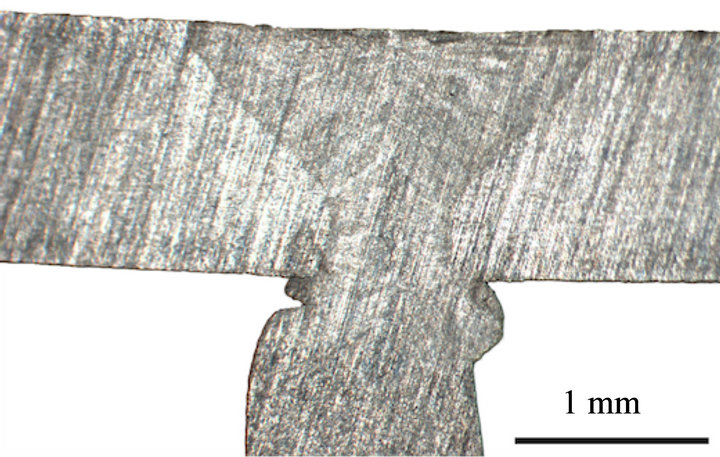
Figure 4. Transverse section view for the keyhole laser welded T-joint.
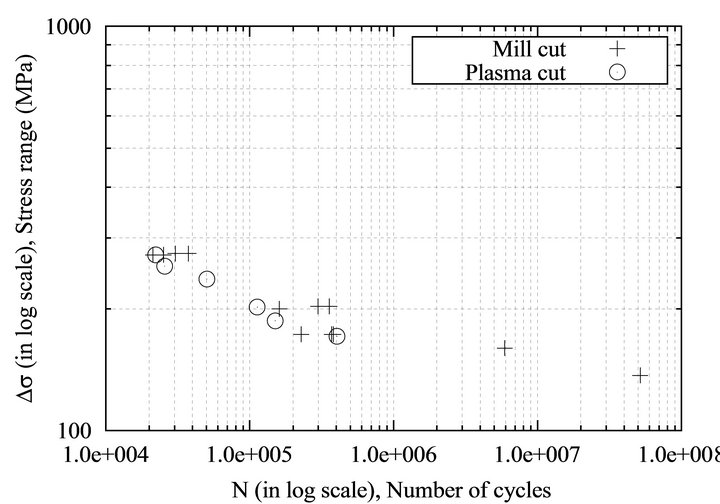
Figure 5. S-N data results of the fatigue life of mill cut and plasma cut non-welded specimens.
clearly shows a knee that starts around 1E06 cycles. The surface on the milling cut specimens is smoother when compared to the surface from the specimens cut by plasma. Generally, a smooth specimen would show a higher fatigue life. However, the results show that the fatigue life is independent of the smoothness of the surface. The heating from the plasma cutting process may affect the surface so that the stress distribution is lower at the surface. The crack initiates at the edge in all the nonwelded specimens. In some of the welded specimens the crack initiates at the edge of the specimen and in the major part of the specimens the crack initiates at the welding. In Figures 6 and 7 the two types of crack initiations are shown.
In Figure 8 fatigue results from the welded and nonwelded specimens are presented.
Clearly the difference in fatigue life is small. In Figure 9 the fatigue life of the non-welded specimens is
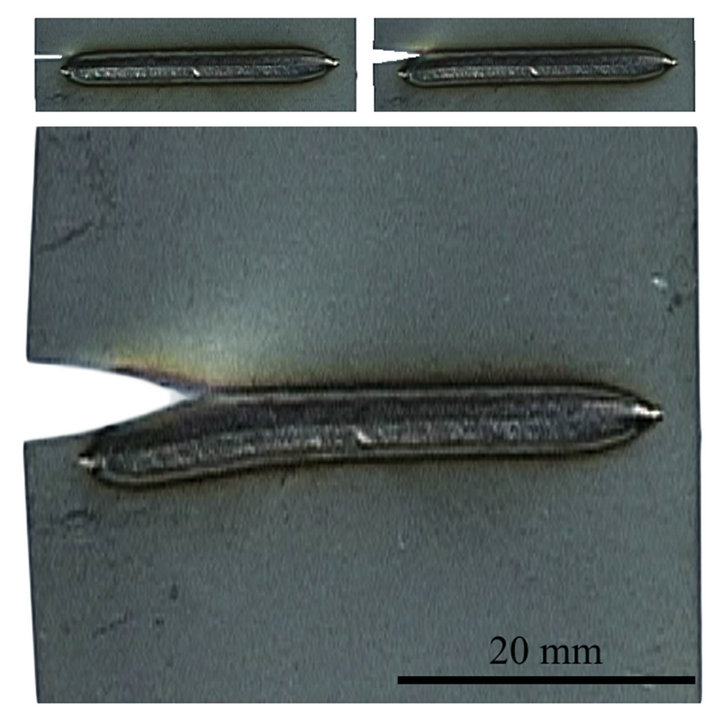
Figure 6. The edge crack growth at the laser welded specimen. The cracks tend to grow in the HAZ Zone.
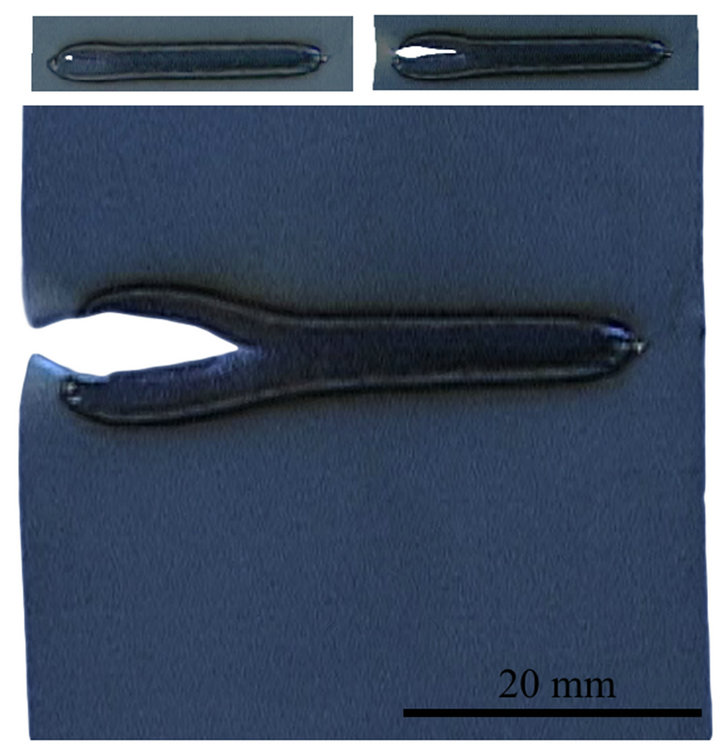
Figure 7. The center crack in the welding at the laser welded specimen. The crack grows in the pre-crack area between the two parts.
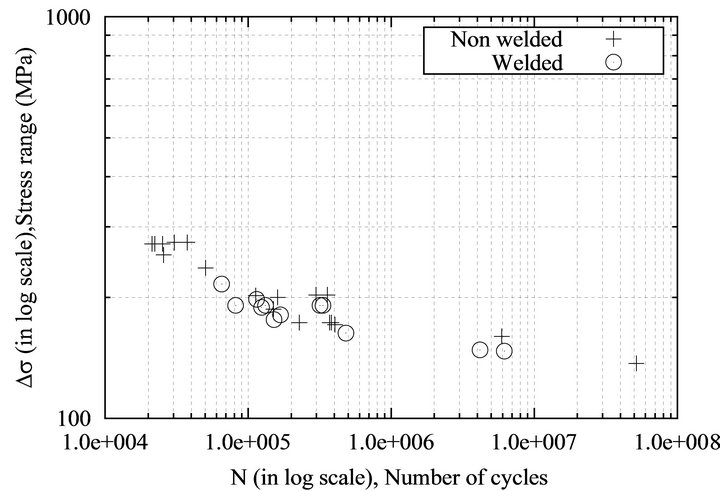
Figure 8. Plot of the fatigue life for the welded and nonwelded specimens.
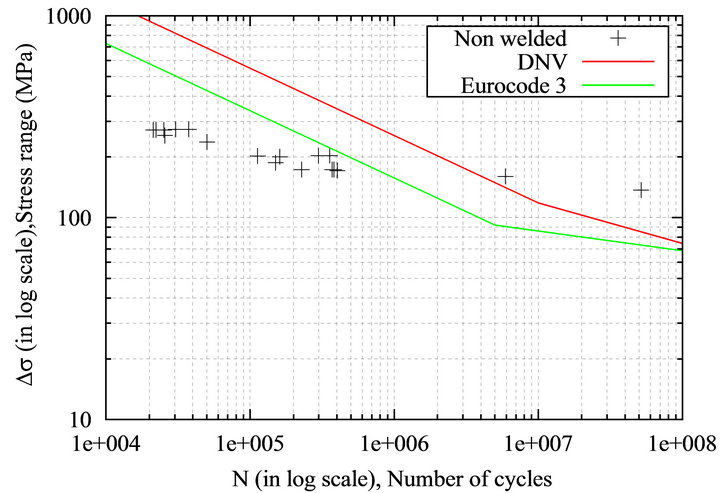
Figure 9. Plot of the fatigue life for the non-welded specimens and the estimated fatigue life based on EUROCODE 3 EN-1993-1-9 and DNV-RP-C203.
compared with the fatigue life calculated on basis of the guidelines in EUROCODE 3 EN-1993-1-9 and DNV RP-C203.
The curves in the DNV RP-C203 standard are associated with a 97.7% probability of survival, whereas the curves in the EUROCODE 3 EN-1993-1-9 standard are associated with a 95% probability of survival. Therefore, the test data should provide higher fatigue strength to compensate for the safety incorporated in the standards. In the calculations according to EUROCODE 3 EN-1993- 1-9 (see Equation (1)) the detail category 125 is used, where m = 3 below constant amplitude limit at 5.0 1E06 cycles and m = 5 up to 5.0 1E08 which is the cut-off limit.
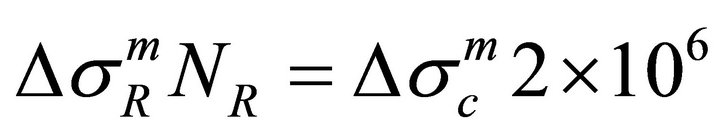 (1)
(1)
The calculations with the DNV RP-C203 standard (see Equation (2)) are based on design curve C, where m = 3 and log(a) = 12.592 below 1E07 cycles and m = 5 and log(a) = 16.320 above 1E07 cycles. The thickness exponent k = 0.15 with a reference thickness of 25 mm.
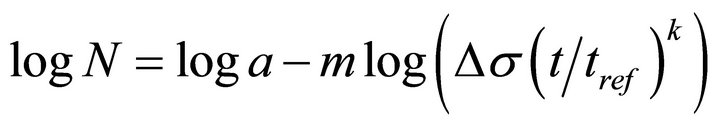 (2)
(2)
In Figure 10 the curve from EUROCODE 3 EN-1993- 1-9 is designed from detail category 80, where m = 3 below the constant amplitude limit at 5.0 1E06 cycles and m = 5 up to 1E08 cycles, which is the cut-off limit. The DNV curve is based on design curve E, where m = 3 and log(a) = 12.01 below 1E07 cycles and m = 5 and log(a) = 15.35 above 1E07 cycles. The thickness exponent k = 0.20 with a reference thickness of 25 mm and a structural stress concentration factor of 1.13.
It is clear from Figures 9 and 10 that the calculated fatigue life gives a long estimate life at the HCF area. With lower cycles fatigue the fatigue life for the specimens tend to have less resistance to a dynamic load. The negligible difference in fatigue life for the welded and nonwelded specimens is most probably caused by local relaxation of the material. The residual stresses from the welding process relax the material by local compression areas and thereby extend the fatigue life. Microstructural transformations can also change the fatigue life. It has been observed that AISI304 can change microstructure from austenite to martensitic and thereby change fatigue and fracture parameters like KIC, KC and crack growth speed. The residual stress and the microstructure transformation are most probable the source that influence the fatigue life so it is similar for welded and non-welded specimens.
The slope of experimental data and of the design code is not equal. The design code is based on ferritic steel and the material used in the experiments is austenitic stainless steel. In the Stainless steel a considerable amount of chrome and nickel affect the fracture parameter and microstructure. This is the reason for the variation of the slope on the S-N curve.
4. Conclusions
In this paper the experimental investigations of the fatigue life for laser welded T-joints and non-welded
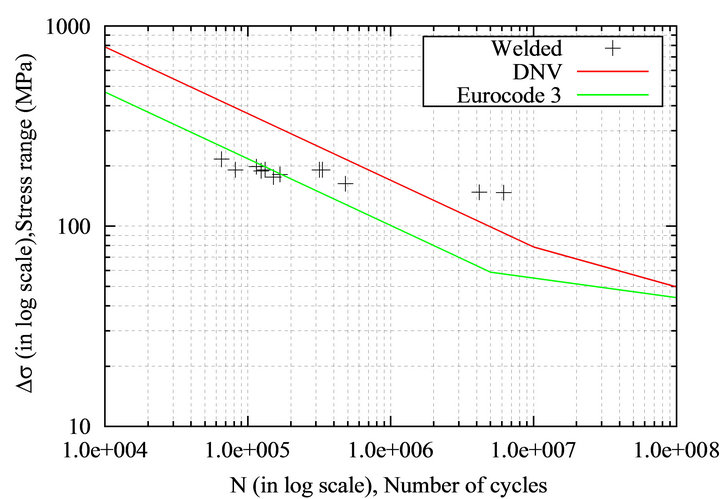
Figure 10. Plot of the fatigue life for the laser welded specimens and the estimated fatigue life based on EUROCODE 3 EN-1993-1-9 and DNV-RP-C203.
specimens made of AISI304 stainless steel are presented. Based on these experimental results the main conclusions are:
• The difference in the fatigue life of a specimen generated by plasma cut or milling cut is insignificant.
• The largest difference in the fatigue life for the plasma and milling cut shows to be in the high cycle fatigue area.
• A comparison between the fatigue life of the welded T-joints specimens and the non-welded specimens shows the tendency that the fatigue resistance is higher for the non-welded specimens.
• The results show that the fatigue life for the welded specimens is lower than the fatigue life estimation based on the standards.
Finally it can be concluded that the fatigue life estimation based on the standards does not satisfy the probability of survival below cycles 4.0 1E06. With cycles above 4.0 1E06 the standards provide lower fatigue life compared to the experiments. In the design standards the fatigue assessment guidelines are based on structural steel like S235JR. Therefore, if these standards are used in the design of stainless steel components only the high cycle fatigue area should be used. Generally, the DNV-RPC203 standard suggests a higher fatigue life compared to the EUROCODE 3 EN-1993-1-9 standard.
REFERENCES
- I. N. Nawia, Saktiotob, M. Fadhalic, M. S. Hussaind, J. Alie and P. P. Yupapinf, “Nd: YAG Laser Welding of Stainless Steel 304 for Photonics Device Packaging,” Procedia Engineering, Vol. 8, 2011, pp. 374-379. doi:10.1016/j.proeng.2011.03.069
- G. Apostol, G. Solomon and D. Iordchescu, “Input Parameters Influence on the Residual Stress and Distortions at Laser Welding Using Finite Element Analysis,” Series D: Mechanical Engineering, Vol. 74, 2012, pp. 153-164.
- B. Aalderink, R. Aarts, J. Jonker and J. Meijer, “Experimental Observations of the Laser Keyhole Welding Process of AA5182,” International Conference on Applications of Lasers and Electro-Optics, Miami, 31 October-3 November 2005, pp. 153-164. http://doc.utwente.nl/52896/1/Wa1008.pdf
- K. Balasubramanian, N. Siva Shanmugam, G. Buvanashekaran and K. Sankaranarayanasamy, “Numerical and Experimental Investigation of Laser BeamWelding of AISI304 Stainless Steel Sheet,” Advances in Production Engineering and Management, Vol. 3, No. 2, 2008, pp. 93-105. http://maja.uni-mb.si/files/apem/APEM3-2_093-105.pdf
- P. Molian, “Solidification Behaviour of Laser Welded Stainless Steel,” Journal of Materials Science Letters, Vol. 4, No. 3, 1985 pp. 281-283. doi:10.1007/BF00719791
- M. S. Salleh, M. I. Ramli and S. H. Yahaya, “Study on Mechanical Properties and Microstructure Analysis of AISI 304L Stainless Steel Weldments,” Journal of Mechanical Engineering and Technology, Vol. 3, No. 2, 2011, pp. 71-82. http://jmet.utem.edu.my/index2.php?option=com_docman&task=doc_view&gid=62&Itemid=40
- C. Suh, M. Suh and N. Hwang, “Growth Behavior of Small Surface Fatigue Cracks in AISI304 Stainless Steel,” Fatigue and Fracture of Engineering Materials and Structures, Vol. 35, No. 1, 2012, pp. 22-29. doi:10.1111/j.1460-2695.2011.01623.x
- J. Linder and A. Melander, “Fatigue Strength of Spot Welded Stainless Sheet Steels Exposed to 3 Percent NaCl Solution,” International Journal of Fatigue, Vol. 20, No. 5, 1998, pp. 383-388. doi:10.1016/S0142-1123(98)00009-7
- F. Karci, R. Kacar and S. Gündüz, “The Effect of Process Parameter on the Properties of Spot Welded Cold Deformed AISI304 Grade Austenitic Stainless Steel,” Journal of Materials Processing Technology, Vol. 209, No. 8, 2009, pp. 4011-4019.
- X. Yang, J. Zhou and X. Ling, “Study on Plastic Damage of AISI304 Stainless Steel Induced by Ultrasonic Impact Treatment,” Materials and Design, Vol. 36, 2012, pp. 477-481. doi:10.1016/j.matdes.2011.11.023
- M. C. Park, K. N. Kim, G. S. Shin and S. J. Kim, “Effects of Strain Induced Martensitic Transformation on the Cavitation Erosion Resistance and Incubation Time of Fe-CrNi-C Alloys,” Wear, Vol. 274-275, 2012, pp. 28-33. doi:10.1016/j.wear.2011.08.011
- M. Jayaprakash, J. Sumanth Kumar, S. Katakam and S. G. S. Raman, “Effect of Grain Size on Fretting Fatigue Behaviour of Aisi 304 Stainless Steel,” International Symposium of Research Students on Materials Science and Engineering, Chennai, 20-22 December 2004, pp. 1-8. http://mme.iitm.ac.in/isrs/isrs04/cd/content/Papers/MBM/PO-MBM-8.pdf
- N. Rossinia, M. Dassistia, K. Benyounisb and A. Olabib, “Methods of Measuring Residual Stresses in Components,” Materials and Design, Vol. 35, 2012, pp. 572-588. doi:10.1016/j.matdes.2011.08.022
- C. Müller-Bollenhagen, M. Zimmermann and H.-J. Christ, “Very High Cycle Fatigue Behavior of Austenitic Stainless Steel and the Effect of Strain-Induced Marten-Site,” International Journal of Fatigue, Vol. 32, No. 6, 2010, pp. 936-942. doi:10.1016/j.ijfatigue.2009.05.007
- O. Takakuwaa, M. Nishikawab and H. Soyama, “Numerical Simulation of the Effects of Residual Stress on the Concentration of Hydrogen around a Crack Tip,” Surface and Coatings Technology, Vol. 206, No. 11-12, 2012, pp. 2892-2898. doi:10.1016/j.surfcoat.2011.12.018
- O. Keiji, M. Yoshio and N. Izuru, “Threshold Behavior of Small Fatigue Crack at Notch Root in Type AISI 304 Stainless Steel,” Engineering Fracture Mechanics, Vol. 25, No. 1, 1986, pp. 31-46. doi:10.1016/0013-7944(86)90201-8
- M. C. Young, J. Y. Huang and R. C. Kuo, “Corrosion Fatigue Behavior of Cold-Worked 304L Stainless Steel,” Materials Transactions, Vol. 50, No. 3, 2009, pp. 657- 663.
- M. C. Park, K. N. Kim, G. S. Shin and S. J. Kim, “Effects of Strain Induced Martensitic Transformation on the Cavitation Erosion Resistance and Incubation Time of FeCr-Ni-C Alloys,” Wear, Vol. 274-275, 2012, pp. 28-33. doi:10.1016/j.wear.2011.08.011
- L. Singh, R. A. Khan and M. L. Aggarwal, “Influence of Residual Stress on Fatigue Design of AISI 304 Stainless Steel,” The Journal of Engineering Research, Vol. 8, No. 1, 2011, pp. 44-52.
- C. Müller-Bollenhagen, M. Zimmermann and H.-J. Christ, “Adjusting the Very High Cycle Fatigue Properties of a Metastable Austenitic Stainless Steel by Means of the Martensite Content,” Procedia Engineering, Vol. 2, No. 1, 2010, pp. 1663-1672.
- L. Tsay, Y. Liu, D. Y. Lin and M. Young, “The Use of Laser Surface-Annealed Treatment to Retard Fatigue Crack Growth of Austenitic Stainless Steel,” Materials Science and Engineering, Vol. 384, No. 1-2, 2004, pp. 177-183. doi:10.1016/j.msea.2004.06.010
- A. Hascalik, E. Unal and N. Ozdemir, “Fatigue Behaviour of AISI 304 Steel to AISI 4340 Steel Welded by Friction Welding,” Journal of Materials Science, Vol. 41, No. 11, 2006, pp. 3233-3239. doi:10.1007/s10853-005-5478-7
- Y. C. Chiou, “Experimantal Study of Deformation Behavior and Fatigue Life of AISI304 Stainless Steel under an Asymmetric Cyclic Loading,” Journal of Marine Science and Technology, Vol. 18, No. 1, 2010, pp. 122-129.