World Journal of Mechanics
Vol.2 No.4(2012), Article ID:21539,7 pages DOI:10.4236/wjm.2012.24026
The Effect of Carotid Plaque Morphology on Longitudinal Fibrous Cap Stress Levels
1MR-Center, Aarhus University Hospital, Aarhus, Denmark
2Department of Cardiothoracic and Vascular Surgery T, Aarhus University Hospital, Aarhus, Denmark
3Department of Cardiology, Aarhus University Hospital, Aarhus, Denmark
4Aarhus School of Engineering, Aarhus University, Aarhus, Denmark
Email: samuel@mr.au.dk
Received May 29, 2012; revised June 30, 2012; accepted July 11, 2012
Keywords: Atherosclerosis; Carotid Artery; Fluid Structure Interaction; Plaque Rupture; Stroke
ABSTRACT
Background and Purpose: Rupture of vulnerable carotid atherosclerotic plaques is a major cause of stroke. Stress levels may reflect risk of rupture in patients with carotid atherosclerotic plaques. Features thought to influence the risk of plaque rupture include the degree of stenosis, lipid-rich necrotic core (LR-NC) size, and thickness of the protective fibrous caps. We used computational models to investigate the effect of these variables on fibrous cap stress levels. Methods: Two-way coupled fluid-structure interaction longitudinal 2D simulations were performed on a bifurcation model based on idealized geometry derived from a symptomatic patient. Models with varying degrees of stenosis (50% - 95%), fibrous cap thicknesses (0.05 - 1 mm), and LR-NC sizes (2 × 1 mm - 6 × 3 mm) were simulated. The stress distribution for each model was calculated and peak principal stresses extracted. Regression analysis was used for assessing the relationship between the variables and stress levels. Results: Mechanical stresses increased with decreasing fibrous cap thicknesses (ß = –0.905, p < 0.001) and increasing LR-NC sizes (ß = 0.262, p < 0.001). The degree of stenosis (ß = 0.024, p = 0.344) and LR-NC placement (ß = –0.001, p = 0.979) had insignificant effects on mechanical stress levels. Conclusions: Thin-capped plaques with large atheromas, known predictors of plaque vulnerability, were shown to exhibit the greatest mechanical stress levels.
1. Introduction
Rupture of vulnerable carotid atherosclerotic plaques is a major source of strokes and transient ischemic attacks [1-4]. Carotid endarterectomy (CEA) has been proven beneficial in symptomatic patients with high degrees of stenosis [5-8]. It is clinical practice to estimate the risk of carotid plaque rupture by measuring the degree of luminal stenosis using ultrasonic Doppler blood velocity measurements [9,10]. Unfortunately, the degree of stenosis may not truly reflect the plaque burden since atherosclerotic plaque growth is characterized by an initial expansion. This may result in normal luminal size belying substantial plaque volumes, a process known as outward remodeling [11,12]. Histopathological examinations suggest morphological plaque features such as large lipidrich necrotic cores and thin protective fibrous caps to be more predictive of rupture prone vulnerable plaques [13].
Detailed in vivo morphological characterization of carotid plaques is possible through high resolution imaging techniques such as magnetic resonance imaging (MRI) [5], intravascular ultrasound [14], and optical coherence tomography [15]. The morphological images may be used for constructing geometrical models for the purpose of computational simulations of mechanical stresses and plaque rupture. Given the traumatic nature of plaque rupture, biomechanical properties of atherosclerotic plaques have long been suspected to influence the probability of rupture [1,4,16]. Intra-plaque stress levels have been determined to differ between symptomatic and asymptomatic patients with carotid atherosclerosis [4], and between ruptured and non-ruptured coronary atherosclerotic lesions [1].
In this study, we performed 2D fluid-structure interaction simulations of an idealized carotid artery based on the geometry of a symptomatic patient. We investigated the impact of different degrees of luminal stenosis, fibrous cap thicknesses, lipid-rich necrotic core (LR-NC) size, and LR-NC position to determine their effect on plaque stress levels and possible risk of plaque rupture.
2. Methods
Informed written consent was obtained from a male patient (age 69) with a 70% degree of stenosis in the carotid artery, awaiting surgery for carotid atherosclerosis. The protocol was approved by the local ethics committee.
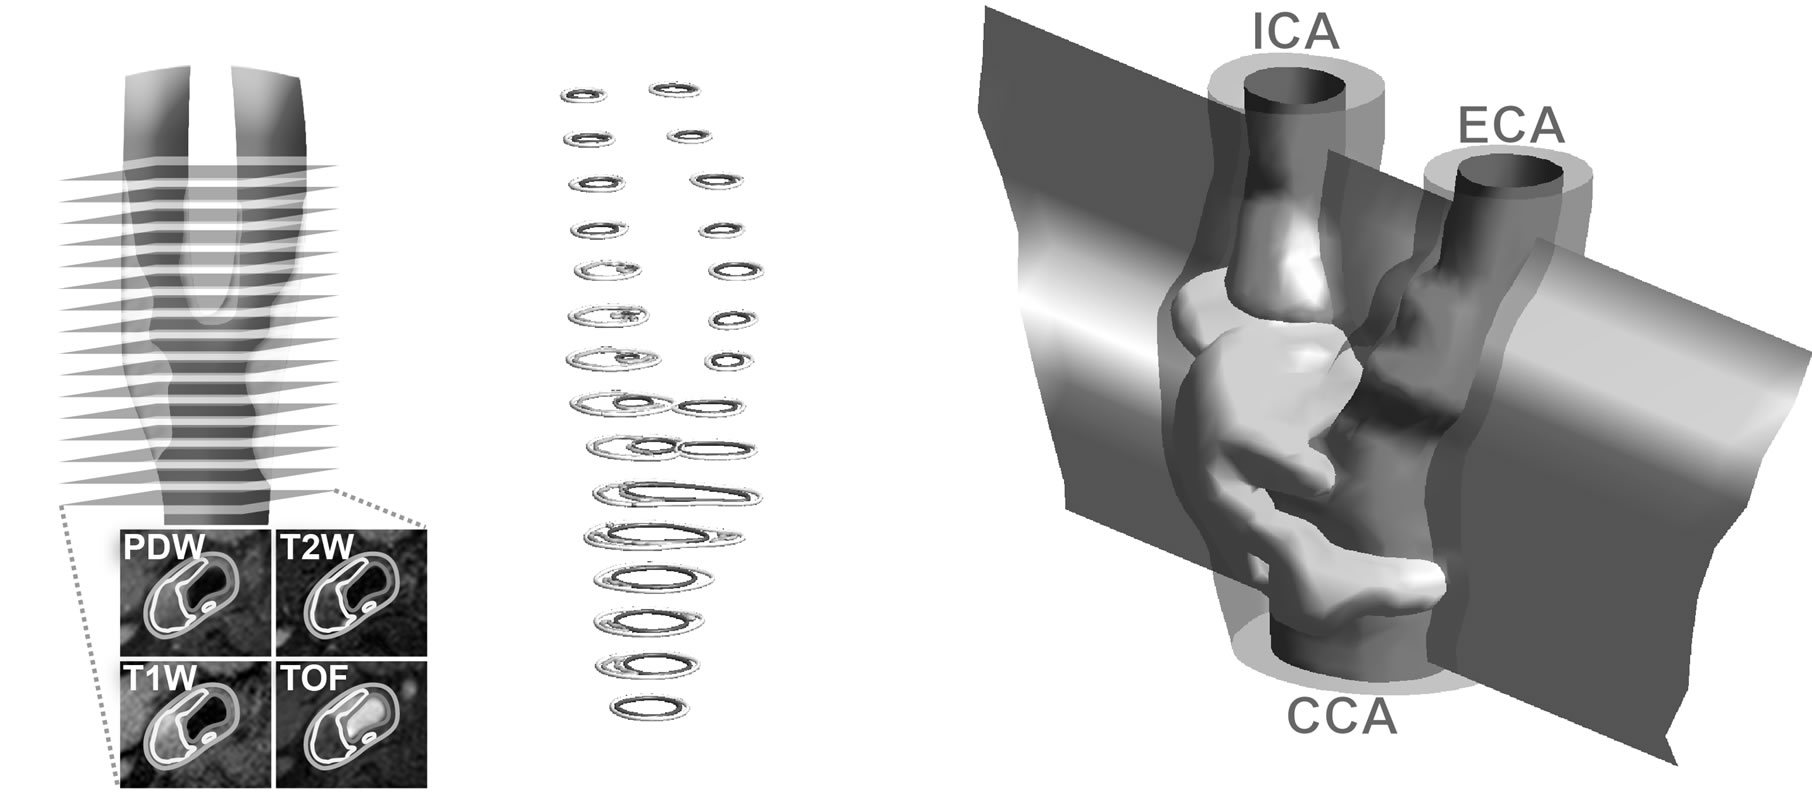
Using a previously published method [17], a longitudinal 2D model was generated of the patient’s carotid artery. In brief, the method uses a well-validated protocol with four magnetic resonance imaging (MRI) scans for segmenting plaque morphological components; lipid-rich necrotic core, fibrous cap, blood lumen, vessel wall, and calcifications (Figures 1(a) and (b)) [5]. A 3D shell model is constructed from the segmented outlines, each shell surrounding the individual plaque components (Figure 1(c)). The bloodstream is skeletonized and the skeletonization used for constructing a curved plane intersecting the center of the carotid artery throughout the model. Intersections between the curved plane and the iso-surface shells constitute the longitudinal 2D model (Figure 2).
In order to suppress local effects of uneven vessel wall borders, a simplified longitudinal model was created using the previously generated curves as guidelines (Figures 2(a) and (d). Cosine functions were used to generate the walls surrounding the plaque, initially calculated horizontally before being rotated to reflect the orientation of the in vivo plaque:
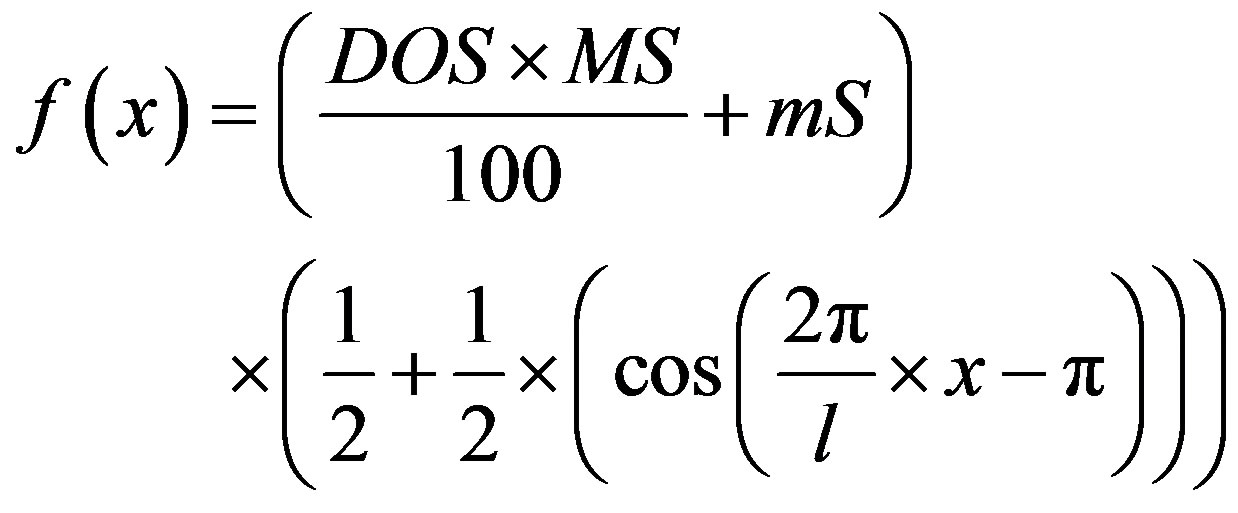 (1)
(1)
where f = horizontal plaque height, x = longitudinal position, DOS = degree of stenosis in percent, MS = amplitude of cosine function at 100% degree of stenosis, mS = amplitude of cosine function at 0% degree of stenosis (negative), and l = length of stenosis. Models with 50% - 95% degrees of stenosis, measured using the NASCET method [6], were created by varying the DOS parameter. Lipid-rich necrotic cores were generated as ellipsoids with increasing sizes (2 × 1 mm, 4 × 2 mm, and 6 × 3 mm) inside the plaque area at specified locations to generate models with proximal/distal LR-NC position and varying fibrous cap thicknesses (1.0, 0.5, 0.25, 0.1, and 0.05 mm). To minimize boundary effects, straight inand outlet sections 50 mm in length were created above and below the model. Finally, the entire model was embedded into a slab of surrounding tissue.
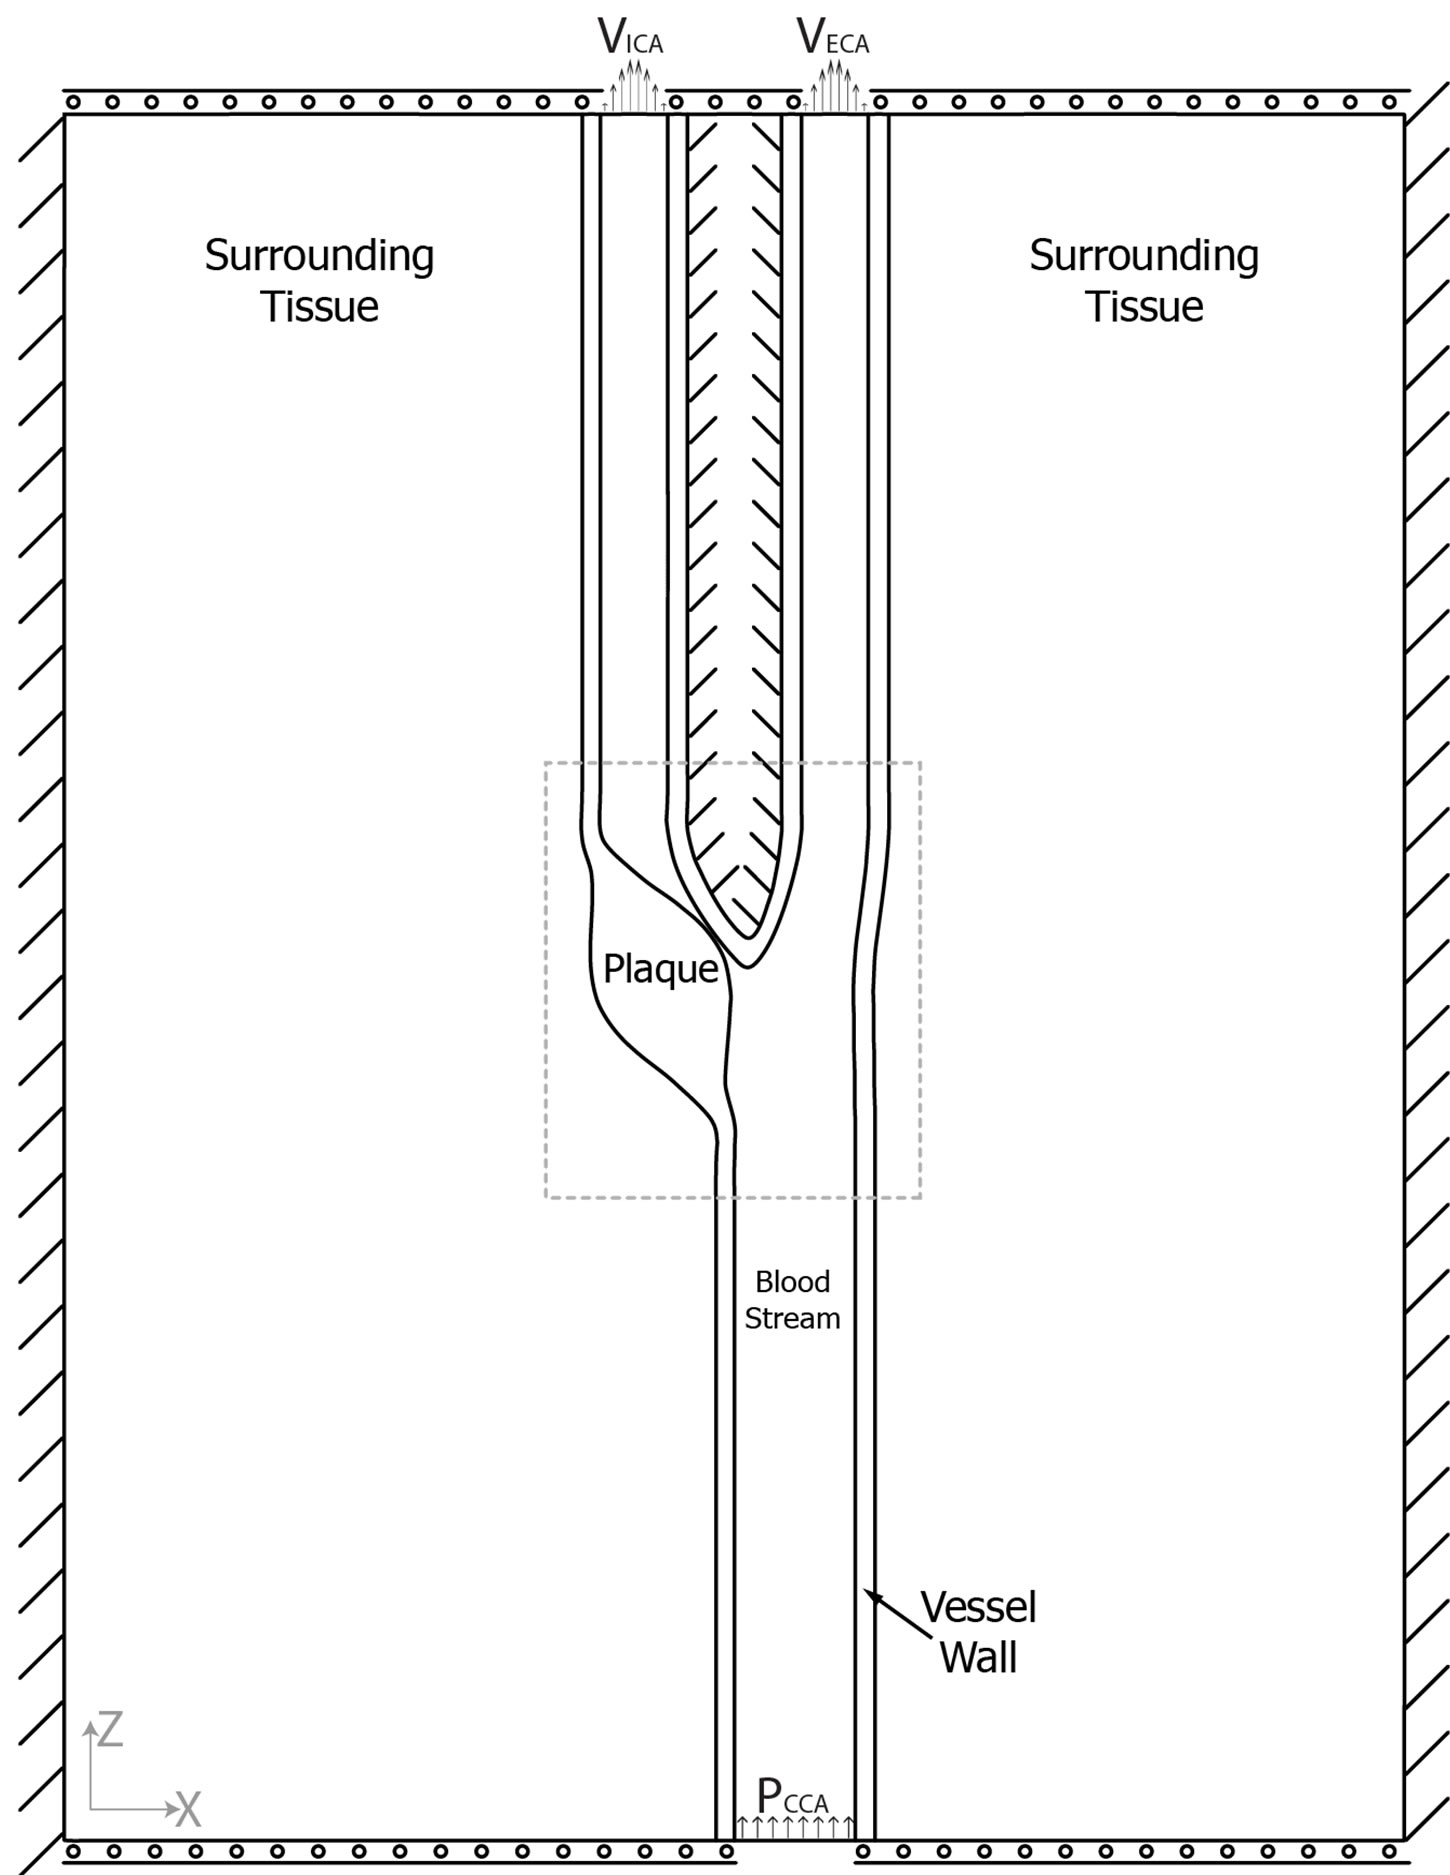
The sides of the model were constrained in all directions while top and bottom were allowed to move in the x-direction (Figure 2(a)). Fluid load was applied along the blood/vessel wall interface. To account for the nonlinear stress/strain dependency of human tissues, a NeoHookean hyper-elastic model with a non-linear stress-
 (a) (b) (c)
Figure 1. Sixteen MRI slices were scanned using four contrast weightings; PDW = proton density weighted image, T2W = T2 weighted image, T1W = T1 weighted image, TOF = Time of flight (a); This enabled segmentation into blood, vessel wall, and lipid-rich necrotic core, each slice constituting a single level of contours (b); Isosurfaces surrounding each plaque component were constructed and sliced with a transection plane going through the center of the blood-stream (c).
 (a)
(a) (b)
(b)
Figure 2. (a) Model overview with boundary conditions visualized. VICA/VECA = velocities at the internal/external carotid outlets, respectively. PCCA = Blood pressure at the common carotid inlet; (b) The original geometry created from MRI scans; (c) Longitudinal MRI scan of the modeled carotid artery; (d) Close-up of the plaque area (dotted square in A) with the simulated lipid pools visualized. Black lines = proximal position, grey lines = distal position.
strain relationship was used to specify the mechanical properties of the plaque components [17,18].
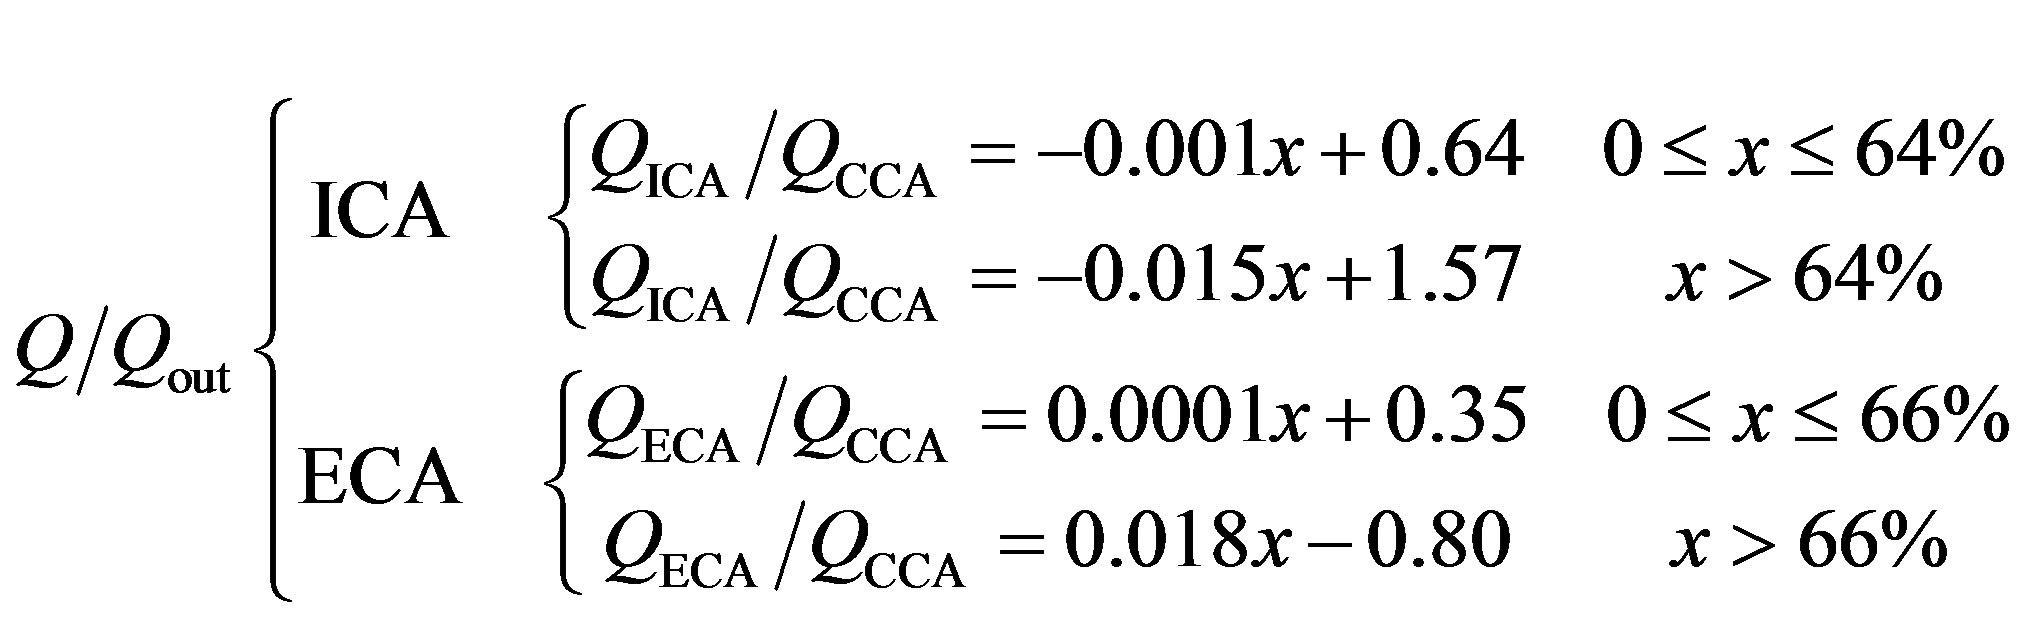
The peak systolic blood pressure of the patient (160 mm Hg) was prescribed at the inlet. The relationship between flow ratios of the external and internal carotids compared to the common carotid flow can be described using an empirical formula presented by Groen et al. [19] (see the Equation (2) below):
where Q/Qout is the outflow ratio, ICA/ECA/CCA are the internal/external/common carotid arteries, respectively, Q is the flow, and x is the degree of stenosis (%).
Using these calculated flow ratios, external and internal flows were calculated by multiplying the ratios with the patient’s common carotid flow measured two cm below the bifurcation using phase-contrast MRI. Finally, the flows were converted to average velocities by dividing with the area of the internal and external carotids under the assumption of circular outlets. The calculated average velocities were applied at the internal and external outlets (Figure 2(a)).
Initial pressure and velocities for the blood were set to 10% of the inlet blood pressure and internal outlet velocity. Although a simplification, blood was simulated as a Newtonian fluid with a constant viscosity. Due to the content of formed elements within the bloodstream shear thinning occurs in vivo and the viscosity is not constant. However, previous research [20] suggests that the use of Newtonian models for simulations of blood flow is reasonable in the carotid artery.
Fluid-structure interaction simulations were performed using COMSOL, a commercially available finite element solver (COMSOL 3.5a, COMSOL Inc, Stockholm, Sweden) coupled with Matlab® 2010a (The MathWorks Inc., Natick, MA, USA). An arbitrary Lagrangian-Eulerian (ALE) formulation was used to couple fluid flow to tissue deformations and vice versa [21]. Blood pressure and outlet velocities were ramped up to the final values in six steps using an increasing multiplication factor ranging from 0.1 to 1. Fluid velocities, plaque deformation, and internal principal stresses were calculated and analyzed in each simulation. The simulations were divided into two groups; one with a proximally placed LR-NC, and one with a distal core. Ninety simulations were conducted in each group, and linear regression was used to compare peak principal stresses in each group using SPSS 19.0.0 (IBM Corporation, Somer, NY, USA).
3. Results
Two examples of velocity fields, first principal stress distributions, and velocity streamlines are presented in Figure 3. A 90% degree of stenosis model with a proximal 6 × 3 mm LR-NC and minimal fibrous cap thickness of 0.2 mm yielded maximal principal stresses of 674.4 kPa occurring at the area of minimal fibrous cap thickness (Figure 3(a), red arrowhead). Immediately adjacent to the area with maximal first principal stresses equal to tensile stresses, was a pressure zone with negative first principal stresses of –101.4 kPa (Figure 3(a), white arrowhead).
A second model with 80% degree of stenosis, a distal 4 × 2 mm LR-NC, and minimal fibrous cap thickness of 0.2 mm is presented in Figure 3(b). The velocities in the internal carotid artery were higher in this model due to the lesser degree of stenosis, generating a large zone of recirculating blood above the plaque (Figure 3(b), yellow asterisk). Again, maximal (Figure 3(b), red arrowhead) and minimal (Figure 3(b), white arrowhead) first principal stresses were found to be adjacent and located at the area of minimal fibrous cap width, with a magnitude of 429.1 and −89.5 kPa, respectively.
Using multiple regression after log-transforming first principal stresses and fibrous cap width to improve normality, the combined effect of the degree of stenosis, fibrous cap thickness, and LR-NC size and position was assessed, yielding a combined R2-value of 0.89 indicating 89% of the variation in relative stress levels could be ascribed these variables, and that the combined influence was highly significant (p < 0.001). Individually, neither the degree of stenosis (p = 0.34) or LR-NC placement (p = 0.98) affected the relative first principal stresses significantly whereas both the LR-NC size (p < 0.001) and relative fibrous cap width (p < 0.001) had a significant impact on the relative first principal stresses.
Using standardized regression coefficients, the strength of the association between relative first principal stresses and each of the variables was assessed and is reported in Table 1. The standardization yields units in terms of standard deviations allowing comparisons of the ß estimates between the variables. As can be appreciated from Table 1, the fibrous cap width in particular had a substantial effect on first principal stress levels, LR-NC size a somewhat lower effect while LR-NC placement and degree of stenosis had a negligible and insignificant impact.
 (2)
(2)
 (a) (b)
Figure 3. Examples of results generated from the simulations. Arrowheads mark the location of maximal/minimal first principal stresses, red/white respectively. Insets depict areas of maximal/minimal stress levels. (a) Carotid with 90% stenosis, proximal 6 × 3 mm lipid pool, and minimal fibrous cap width of 0.2 mm; (b) Carotid with 80% stenosis, distal 4 × 2 mm lipid pool, and minimal fibrous cap width of 0.2 mm. A large zone of recirculating blood was present above the plaque (yellow asterisk).
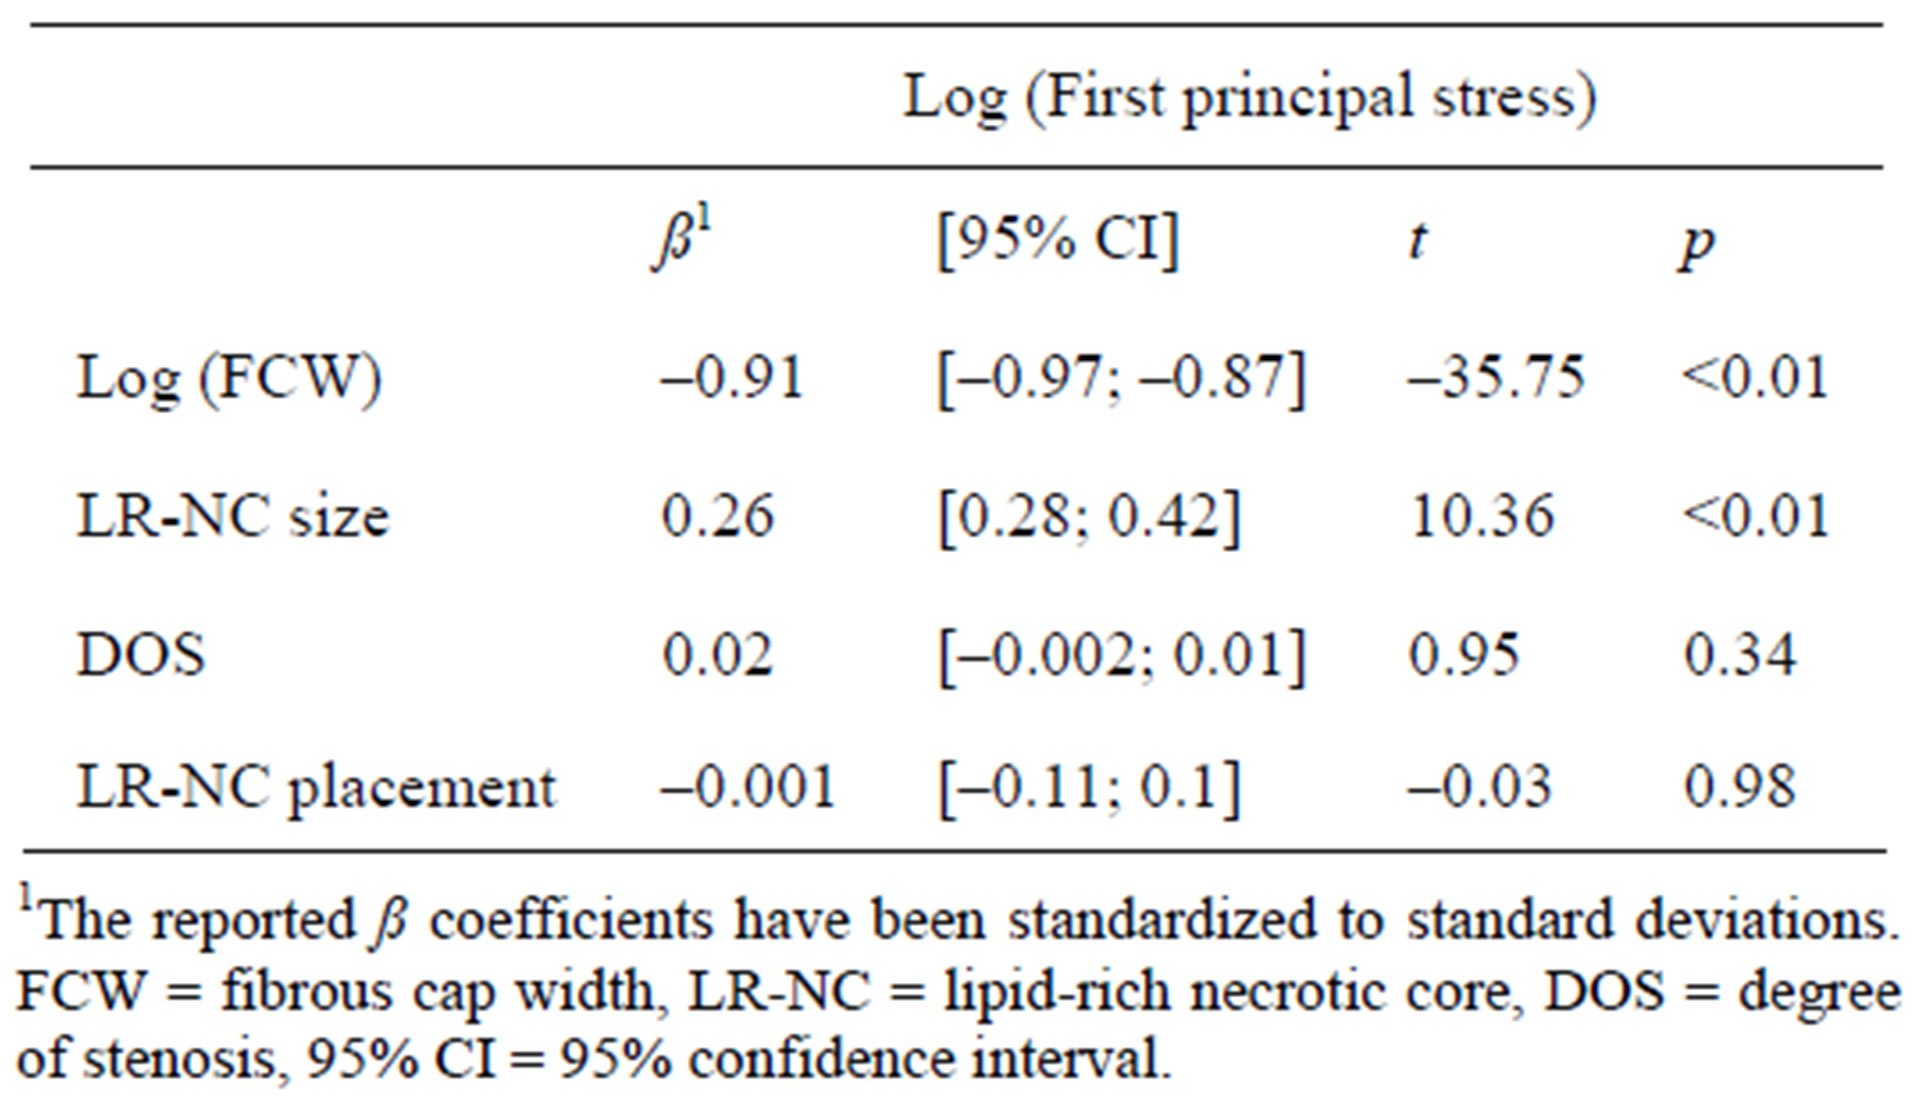
Table 1. Main findings of the multiple linear regression analysis.
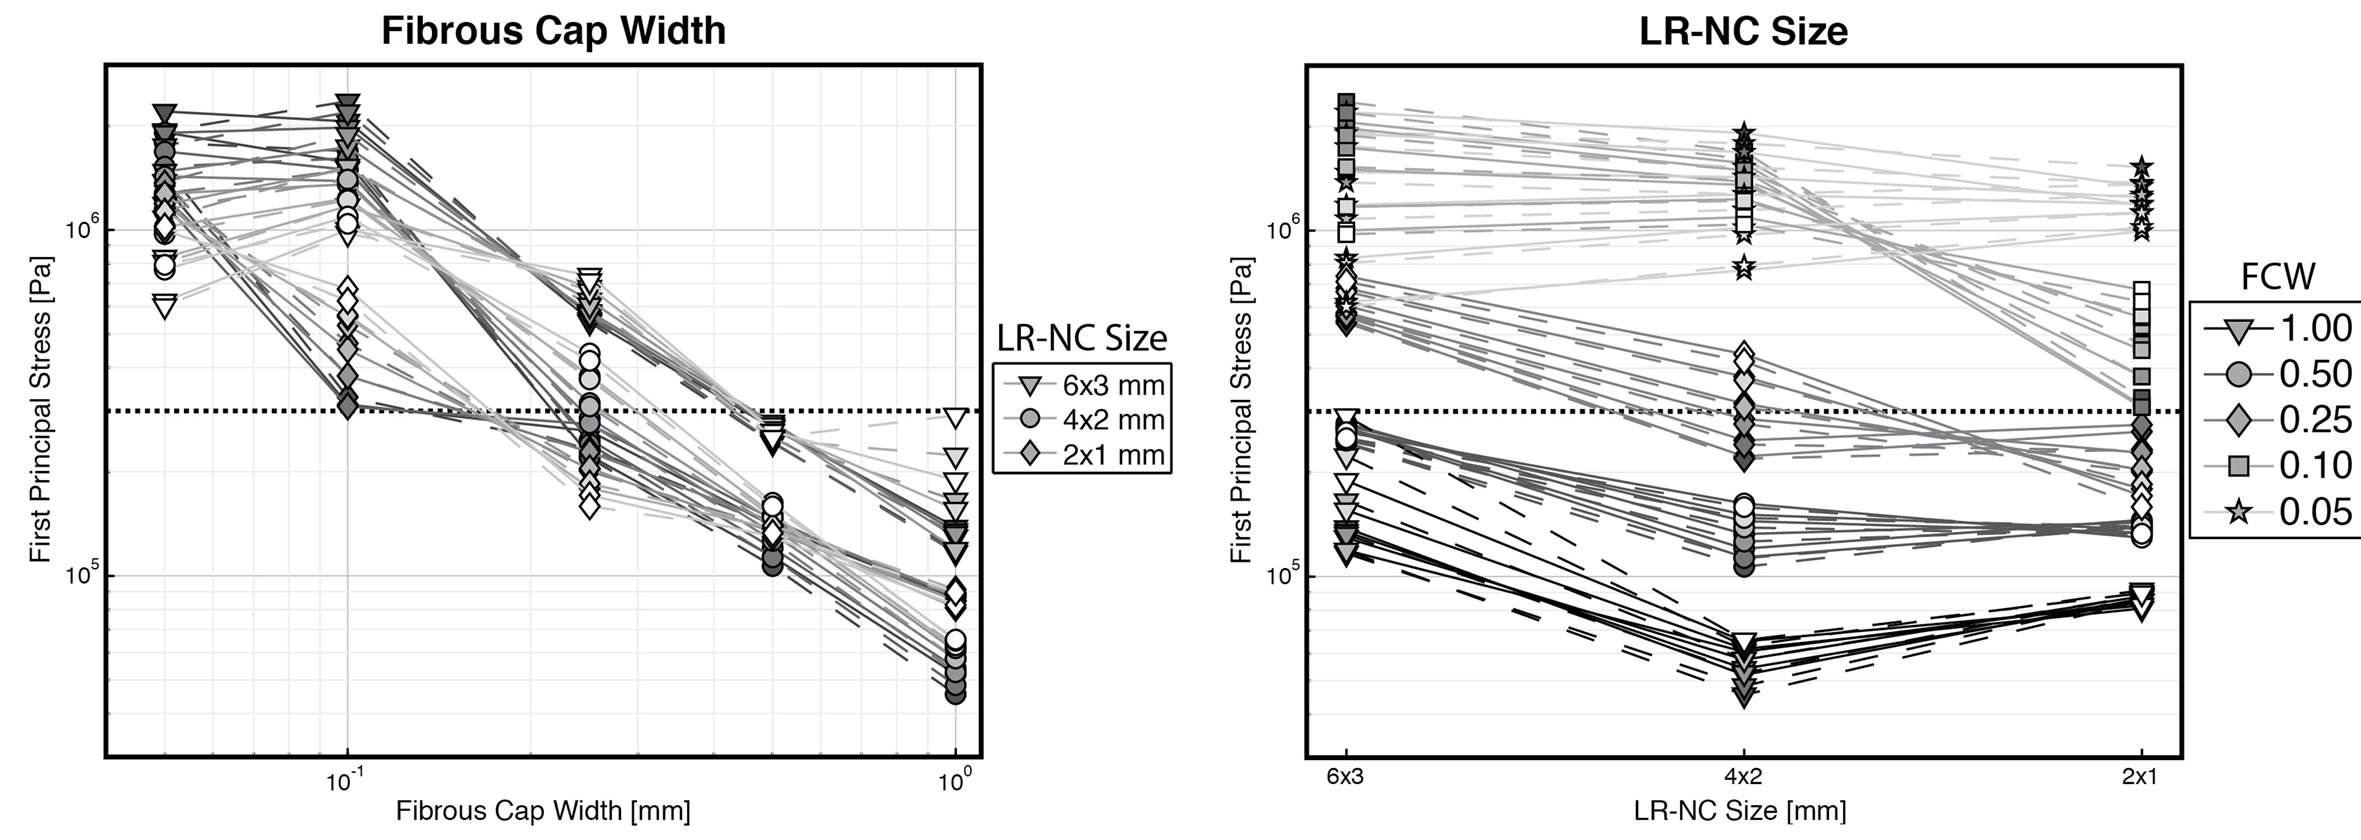
Plotting the first principal stresses as a function of each of the varying variables revealed interesting tendencies (Figure 4). The significant impact of the fibrous cap thickness is readily apparent from Figure 4(a). Using the previously reported critical plaque stress of 300 kPa [1] plotted as thick, dotted black lines, it can be seen, that the minimal fibrous cap thickness to show stresses in excess of this limit was ≈200 µm, corresponding very much to earlier publications using 200 µm as the cutoff limit for designating plaques at risk of rupture [22]. The point at which first principal stresses exceeded the rupture limit of 300 kPa was also dependent on the size of the LR-NC, with larger LR-NCs exceeding the limit at a thickness of ≈450 µm. In general, larger LR-NCs caused greater stresses than small LR-NC (Figure 4(b)). Thick fibrous caps above 0.5 mm in width never exceeded the stress limit, while thin fibrous caps with a thickness of 100 µm or below remained above the stress limit regardless of size. The effect of the degree of stenosis on first principal stress levels showed evidence of threshold behavior (Figure 4(c)), where the degree of stenosis had little to no effect on stress levels in caps thicker than 100 µm while thin caps (fibrous cap width ≤ 100 µm) yielded rising stresses with greater degrees of stenosis. Thus, the insignificant and limited correlation found between degree of stenosis and principal first stresses could be ascribed these opposite phenomena. Indeed, restricting the regression analysis to thin-capped atheromas with a fibrous cap width ≤ 100 µm yielded very different standardized regression coefficients: degree of stenosis (ß = 0.336, p = 0.001), LR-NC size (ß = 0.508, p < 0.001), and fibrous cap width (ß = –0.218, p = 0.022) were all significant, while LR-NC placement was highly insignificant (ß = 0.019, p = 0.839). The placement of the LR-NC did not impact first principal stresses at all, as evidenced from Figure 4(d).
 (a)
(a)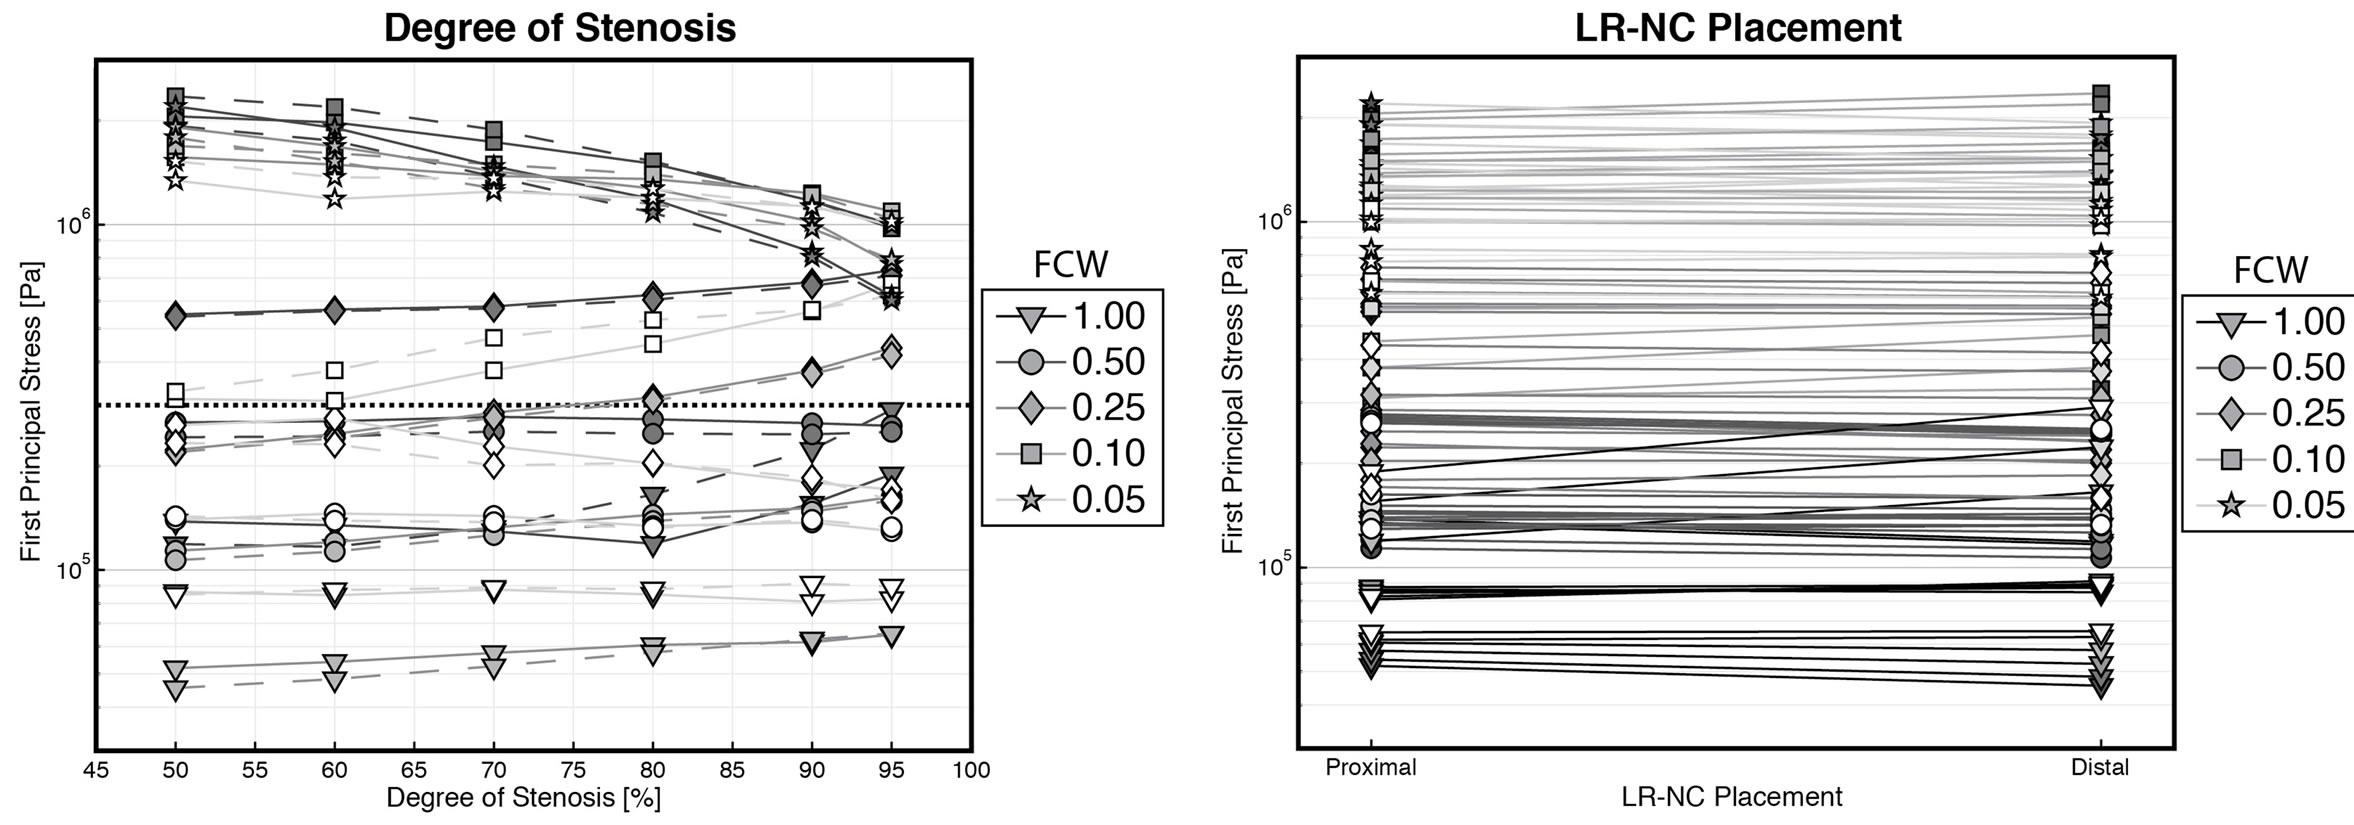 (b)
(b)
Figure 4. Plots displaying the relationship between each of the simulated variables and first principal stresses. Note the use of logarithmic scales for first principal stresses and fibrous cap widths. Full/dashed lines depict proximal/distal LR-NCs, respectively. FCW = fibrous cap width, LR-NC = lipid-rich necrotic core. (a) Fibrous cap width vs. stresses. Line/marker darkness reflects the degree of stenosis, with lighter line/markers reflecting large degrees of stenosis. Markers reflect LR-NC size; (b) LR-NC size vs. stresses. Line darkness reflect FCW, lighter lines = thin FCW. Marker darkness reflect the degree of stenosis, with lighter markers = large degrees of stenosis. Markers reflect FCW; (c) Degree of stenosis vs. stresses. Line/marker darkness reflect. The LR-NC size, with lighter line/markers depicting smaller LR-NCs. Markers reflect FCW; (d) LR-NC Placement vs. stresses. Line darkness reflect FCW, lighter lines = thin FCW. Marker darkness reflect the degree of stenosis, with lighter markers = large degrees of stenosis. Markers reflect FCW.
4. Discussion
Currently, carotid risk assessment is based on measuring the degree of stenosis to determine if carotid endarterectomy should be offered symptomatic patients [6,8,23]. However, there is growing evidence that morphological composition rather than degree of luminal stenosis may be the deciding factor in determining plaque vulnerability [24-26]. In particular, large LR-NCs with thin fibrous caps have been determined to be the hallmark of unstable plaques at high risk of rupture. Through the advent of high-resolution MR imaging combined with computational analysis, in vivo estimations of mechanical stresses in the fibrous cap have been enabled [4,16,27].
In the present study, we used an idealized bifurcation model based on geometry obtained from a patient awaiting carotid endarterectomy. Ellipsoidally shaped LR-NCs were used to create heterogeneous plaques with varying position of the LR-NC allowing for examinations of the effects of LR-NC size and position in addition to the effects of the degree of stenosis and fibrous cap width.
Links between stenosis severity, fibrous cap thickness, and mechanical stress levels have previously been reported by Li et al. [3]. The severe influence of fibrous cap thickness on first principal stresses was confirmed in the present study, whereas the significant impact of the degree of stenosis was lacking. However, a detailed analysis of the relationship between the degree of stenosis and first principal stresses (Figure 4(c)) revealed a threshold effect. Thin LR-NCs (thickness ≤ 100 µm) showed that first principal stresses did indeed rise with corresponding higher degrees of stenosis whereas thick LR-NCs showed constant/slight decrease in stress levels with higher degrees of stenosis. The lack of agreement between the results of Li et al. and our present study may stem from the difference in models; Li et al. used a straight tube with a constant flow whereas our model included a bifurcation and decreasing blood flows with increasing degrees of stenosis [19].
Plaque heterogeneity was shown to influence biomechanical stress levels, with larger LR-NC yielding greater stresses than smaller LR-NC (Figure 4(b)). This confirms previous findings [28,29], that atheromatous plaques are at higher risk of rupture than fibrous caps.
In an angiographic study of plaque ulceration, Lovett [30] determined plaque ulcerations to be asymmetrically distributed longitudinally with the majority occurring upstream to the plaque rather than downstream. To investigate if this phenomenon could be attributed to mechanical stress levels, symmetrical simulations were performed with LR-NCs placed proximally and distally inside the plaque (Figure 2(d)). However, no significant differences were found between models with proximal cores vs. distal cores, indeed the stress levels were virtually identical. In a previous study [17], we found the longitudinal distribution of maximal stresses and plaque ruptures to be asymmetrically distributed in a group of symptomatic patients, with the majority occurring proximally to the plaque in line with the findings of Lovett et al.
Previous studies have used principal stress levels in excess of 300 kPa to be predictive of plaques at high risk of rupture [1,3,4]. The choice of material model and parameters may substantially affect simulated stress levels. Care should thus be taken comparing absolute stress levels across different simulations employing different material models, and the choice of an absolute level at which the plaques are considered to be at risk of rupture may be problematic.
Currently, state-of-the-art MRI scans employ typical inplane spatial resolutions of 0.5 - 0.6 mm [5,7]. Stress levels increased dramatically with decreasing fibrous cap widths, particularly below 200 µm. Increasing spatial resolution to enable visualization of very thin fibrous caps could thus prove of vital importance. Moving towards scanners with higher field strengths [9] or switching from 2D to 3D acquisitions [11] may facilitate this.
5. Conclusion
In this study, we present the result of a systematic computational investigation using idealized carotid bifurcation geometries. Thin-capped plaques with large atheromas, known predictors of plaque vulnerability, were shown to exhibit the greatest mechanical stress levels. Thus, stress levels may reflect risk of rupture in patients with carotid atherosclerotic plaques.
6. Acknowledgements
We kindly thank William Kerwin and Chun Yuan of the Vascular Imaging Lab, University of Washington, Seattle, USA for the use of their in-house developed automated plaque segmentation software Cascade, used for segmenting the initial MRI-based model. The work was made possible with generousgrants from these foundations: Kong Christian X Fond, Fonden til Lægevidenskabens Fremme, Hjerteforeningen, Diabetesforeningen, Beckettfonden, Familien Hede Nielsens Fond, Snedkermester Sophus Jakobsen og hustru Astrid Jacobsens Fond, Tømmerhandler Johannes Fog’s Fond, Bangs Fond, Lundbeckfonden, Jørgen Møllers Fond, Directør Jacob Madsen & Hustru Olga Madsens Fond, Korningfonden, Karl G. Anders Fond, Civilingeniør Frode V. Nyegaard og Hustrus Fond, and Kontorchef Coles Frederiksen & Hustrus Fond. WYK was funded by the Novo Nordisk Foundation.
REFERENCES
- G. C. Cheng, H. M. Loree, R. D. Kamm, M. C. Fishbein, and R. T. Lee, “Distribution of Circumferential Stress in Ruptured and Stable Atherosclerotic Lesions, a Structural Analysis with Histopathological Correlation,” Circulation, Vol. 87, No. 4, 1993, pp. 1179-1187. doi:10.1161/01.CIR.87.4.1179
- D. Lloyd-Jones, R. J. Adams, T. M. Brown, M. Carnethon, S. Dai, et al., “Heart Disease and Stroke Statistics—2010 Update: A Report from the American Heart Association,” Circulation, Vol. 121, No. 7, 2010, pp. e46- e215. doi:10.1161/CIRCULATIONAHA.109.192667
- Z.-Y. Li, S. P. S. Howarth and J. H. Gillard, “How Critical Is Fibrous Cap Thickness to Carotid Plaque Stability? A Flow-Plaque Interaction Model,” Stroke, Vol. 37, No. 5, 2006, pp. 1195-1199. doi:10.1161/01.STR.0000217331.61083.3b
- Z.-Y. Li, S. P. S. Howarth, M. J. Graves, J. U-King-Im, et al., “Structural Analysis and Magnetic Resonance Imaging Predict Plaque Vulnerability: A Study Comparing Symptomatic and Asymptomatic Individuals,” Journal of Vascular Surgery, Vol. 45, No. 4, 2007, pp. 768-775. doi:10.1016/j.jvs.2006.12.065
- C. Yuan and W. S. Kerwin, “MRI of Atherosclerosis,” Journal of Magnetic Resonance Imaging, Vol. 19, No. 6, 2004, pp. 710-719. doi:10.1002/jmri.20070
- H. J. Barnett, D. W. Taylor, M. Eliasziw, A. J. Fox, G. G. Ferguson, et al., North American Symptomatic Carotid Endarterectomy Trial Collaborators, “Benefit of Carotid Endarterectomy in Patients with Symptomatic Moderate or Severe Stenosis,” The New England Journal of Medicine, Vol. 339, No. 20, 1998, pp. 1415-1425. doi:10.1056/NEJM199811123392002
- L. A. Crowe, J. Keegan, P. D. Gatehouse, R. H. Mohiaddin, A. Varghese, et al., “3D Volume-Selective Turbo Spin Echo for Carotid Artery Wall Imaging with Navigator Detection of Swallowing,” Journal of Magnetic Resonance Imaging, Vol. 22, No. 4, 2005, pp. 583-588. doi:10.1002/jmri.20424
- ECST, “Randomised Trial of Endarterectomy for Recently Symptomatic Carotid Stenosis: Final Results of the MRC European Carotid Surgery Trial (ECST),” Lancet, Vol. 351, No. 9113, 1998, pp. 1379-1387. doi:10.1016/S0140-6736(97)09292-1
- V. L. Yarnykh, M. Terashima, C. E. Hayes, A. Shimakawa, N. Takaya, et al., “Multicontrast Black-Blood MRI of Carotid Arteries: Comparison between 1.5 and 3 Tesla Magnetic Field Strengths,” Journal of Magnetic Resonance Imaging, Vol. 23, No. 5, 2006, pp. 691-698. doi:10.1002/jmri.20562
- M. Titi, C. George, D. Bhattacharya, A. Rahi, P. Woodhead, et al., “Comparison of Carotid Doppler Ultrasound and Computerised Tomographic Angiography in the Evaluation of Carotid Artery Stenosis,” Surgeon, Vol. 5, No. 3, 2007, pp. 132-136. doi:10.1016/S1479-666X(07)80039-4
- I. Koktzoglou and D. Li, “Submillimeter Isotropic Resolution Carotid Wall MRI with Swallowing Compensation: Imaging Results and Semiautomated Wall Morphometry,” Journal of Magnetic Resonance Imaging, Vol. 25, No. 4, 2007, pp. 815-823. doi:10.1002/jmri.20849
- S. Glagov, E. Weisenberg, C. K. Zarins, R. Stankunavicius and G. J. Kolettis, “Compensatory Enlargement of Human Atherosclerotic Coronary Arteries,” The New England Journal of Medicine, Vol. 316, No. 22, 1987, pp. 1371-1375. doi:10.1056/NEJM198705283162204
- M. Naghavi, P. Libby, E. Falk, S. Casscells, S. Litovsky, et al., “From Vulnerable Plaque to Vulnerable Patient: A Call for New Definitions and Risk Assessment Strategies: Part I,” Circulation, Vol. 108, No. 14, 2003, pp. 1664- 1672. doi:10.1161/01.CIR.0000087480.94275.97
- I. Sipahi, E. Tuzcu, K. Moon, S. Nicholls, P. Schoenhagen, et al., “Does the Extent and Direction of Arterial Remodeling Predict Subsequent Progression of Coronary Atherosclerosis? A Serial Intravascular Ultrasound Study,” Heart (British Cardiac Society), Vol. 94, No. 5, 2007, pp. 623-627.
- A. H. Chau, R. C. Chan, M. Shishkov, B. MacNeill, N. Iftimia, et al., “Mechanical Analysis of Atherosclerotic Plaques Based on Optical Coherence Tomography,” Annals of Biomedical Engineering, Vol. 32, No. 11, 2004, pp. 1494-1503. doi:10.1114/B:ABME.0000049034.75368.4a
- D. Tang, C. Yang, J. Zheng, P. K. Woodard, G. A. Sicard, et al., “3D MRI-Based Multicomponent FSI Models for Atherosclerotic Plaques,” Annals of Biomedical Engineering, Vol. 32, No. 7, 2004, pp. 947-960. doi:10.1023/B:ABME.0000032457.10191.e0
- S. A. Kock, J. V. Nygaard, N. Eldrup, E.-T. Fründ, A. Klaerke, et al., “Mechanical Stresses in Carotid Plaques Using MRI-Based Fluid-Structure Interaction Models,” Journal of Biomechanics, Vol. 41, No. 8, 2008, pp. 1651- 1658. doi:10.1016/j.jbiomech.2008.03.019
- S. A. Thrysøe, M. Oikawa, C. Yuan, N. Eldrup, A. Klaerke, et al., “Longitudinal Distribution of Mechanical Stresses in Carotid Plaques of Symptomatic Patients,” Stroke, Vol. 41, No. 5, 2010, pp. 1041-1043. doi:10.1161/STROKEAHA.109.571588
- H. C. Groen, L. Simons, Q. J. A. van den Bouwhuijsen, E. M. H. Bosboom, F. J. H. Gijsen, et al., “MRI-Based Quantification of Outflow Boundary Conditions for Computational Fluid Dynamics of Stenosed Human Carotid Arteries,” Journal of Biomechanics, Vol. 43, No. 12, 2010, pp. 2332-2338. doi:10.1016/j.jbiomech.2010.04.039
- S. Lee and D. Steinman, “On the Relative Importance of Rheology for Image-Based CFD Models of the Carotid Bifurcation,” Journal of Biomechanical Engineering, Vol. 129, No. 2, 2007, pp. 273-278. doi:10.1115/1.2540836
- J. Donea and S. Giuliani, “An Arbitrary Lagrangian-Eulerian Finite Element Method for Transient Dynamic Fluid-Structure Interactions,” Computer Methods in Applied Mechanics and Engineering, Vol. 33, No. 1-3, 1982, pp. 689-723. doi:10.1016/0045-7825(82)90128-1
- J. N. Redgrave, P. Gallagher, J. K. Lovett and P. M. Rothwell, “Critical Cap Thickness and Rupture in Symptomatic Carotid Plaques: The Oxford Plaque Study,” Stroke, Vol. 39, No. 6, 2008, pp. 1722-1729. doi:10.1161/STROKEAHA.107.507988
- P. M. Rothwell, M. Eliasziw, S. A. Gutnikov, A. J. Fox, D. W. Taylor, et al., “Analysis of Pooled Data from the Randomised Controlled Trials of Endarterectomy for Symptomatic Carotid Stenosis,” Lancet, Vol. 361, No. 9352, 2003, pp. 107-116. doi:10.1016/S0140-6736(03)12228-3
- R. Virmani, F. Kolodgie, A. Burke, A. Finn, H. Gold, et al., “Atherosclerotic Plaque Progression and Vulnerability to Rupture: Angiogenesis as a Source of Intraplaque Hemorrhage,” Arteriosclerosis, Thrombosis, and Vascular Biology, Vol. 25, No. 10, 2005, pp. 2054-2061. doi:10.1161/01.ATV.0000178991.71605.18
- M. Gronholdt, S. Ager-Pedersen and E. Falk, “Coronary Atherosclerosis: Determinants of Plaque Rupture,” European Heart Journal, Vol. 19, Suppl. C, 1998, pp. C24- C29.
- E. Falk, “Why Do Plaques Rupture?” Circulation, Vol. 86, No. 6, 1992, pp. III30-III42.
- S. Z. Zhao, B. Ariff, Q. Long, A. D. Hughes, S. A. Thom, et al., “Inter-Individual Variations in Wall Shear Stress and Mechanical Stress Distributions at the Carotid Artery Bifurcation of Healthy Humans,” Journal of Biomechanics, Vol. 35, No. 10, 2002, pp. 1367-1377. doi:10.1016/S0021-9290(02)00185-9
- A. Fernandez-Ortiz, J. J. Badimon, E. Falk, V. Fuster, B. Meyer, et al., “Characterization of the Relative Thrombogenicity of Atherosclerotic Plaque Components: Implications for Consequences of Plaque Rupture,” Journal of the American College of Cardiology, Vol. 23, No. 7, 1994, pp. 1562-1569. doi:10.1016/0735-1097(94)90657-2
- G. Avril, M. Batt, R. Guidoin, M. Marois, R. HassenKhodja, et al., “Carotid Endarterectomy Plaques: Correlations of Clinical and Anatomic Findings,” Annals of Vascular Surgery, Vol. 5, No. 1, 1991, pp. 50-54. doi:10.1007/BF02021778
- J. K. Lovett and P. M. Rothwell, “Site of Carotid Plaque Ulceration in Relation to Direction of Blood Flow: An Angiographic and Pathological Study,” Cerebrovascular Diseases, Vol. 16, No. 4, 2003, pp. 369-375. doi:10.1159/000072559