World Journal of Mechanics
Vol. 1 No. 4 (2011) , Article ID: 7129 , 5 pages DOI:10.4236/wjm.2011.14026
Determination of the Onset of Mechanical Destruction of Silver Azide Crystals Initiated by a Laser Pulse
Department of solid state chemistry, Kemerovo State University, Kemerovo, Russia
E-mail: kriger@kemsu.ru
Received May 15, 2011; revised June 10, 2011; accepted June 28, 2011
Keywords: azide silver, explosion decomposition, onset of mechanical destruction, luminescence kinetics
ABSTRACT
The onset of the silver azide sample destruction was experimentally determined. Three independent methods were used—comparative investigation of the explosive luminescence from all the experimental area and from the laser action area, investigation of conductivity and acoustic system response. It was shown that the sample destruction and the products emission begins in 20 - 50 nsec after the initiation pulse peak.
1. Introduction
Investigation results of the kinetic regularities of the azide heavy metal (AHM) monocrystals and pressed pellet explosive decomposition initiated by the pulse irradiation have been published in [1-3]. Correct results explanations and mechanism determination (there are two classes of the decomposition mechanism—thermal explosion mechanism [1] and chain mechanism [4]) cannot be done without the determination of the phase transition moment and its correspondence with the luminescent kinetics. According to this, explosive decomposition of filiform and macrocrystal azide silver (SA) initiated by picosecond neodymium—laser pulse was investigated [2]. Absorption and luminescence spectra were got with time high-resolution. Based on this data the authors concluded that the products emission begins in ~3.5 mcsec after the initiation process [2,3]. This time was related to the “preexplosion stage”. Till this stage duration “preexplosion conductivity” and “preexplosion luminescent” are observed [2]. At the same time these authors in later work [5] estimate the “preexplosion stage” duration as 70 nsec (i.e. in 50 times less than the previous estimation [2,3]).
Polycrystalline azide silver and lead explosive decomposition initiated by the nanosecond duration pulse laser irradiation was made in [1]. According to this work luminescent and sample distraction appears at the same time and due only to the products dispersion.
In spite of large number of experimental results, the duration of decomposition process in solid phase could not be considered as an exactly known value. Besides duration of the decomposition process in solid phase and the sample changes during this time are the most important characteristics for the reaction mechanism determination and the explosive process character.
The object of this work is to determine the onset moment of the mechanical destruction of azide silver crystals under the action of pulse laser irradiation by using several methods.
2. Experimental Technique
For the experiments silver azide filiform and macrocrystals with characteristic sizes 10 × 0.2 × 0.05 mm and 0.5 × 0.4 × 0.4 mm, respectively, were used. The synthesis technique is described in [6].
Experimental setup is described in [1]. The source of optical radiation was a single-mode single-frequency Neodymium laser (λ = 1060 nm). The maximum laser radiation energy was 20 J, and the half-height pulse duration was 30 nsec. Luminescence was detected by two H6779-01 photoelectron multipliers (PMT). The first PMT detected explosive luminescence in the spectral region of 500 nm - 600 nm from the laser irradiation zone—a zone PMT (the recording technique is described in [1]). The second PMT was mounted by a conventional method and detected the luminescence of the entire volume of the experimental cell in the same spectral region (panoramic PMT). The signal synchronization method concerned on metal film evaporation is described in [1]. Information on the kinetic parameters of the explosive process was sent to a LeCroy digital four-beam storage oscillograph and then to a computer. The time resolution of the PMT, the signal digitization frequency and time resolution of the oscillograph was 1 nsec.
The onset of the sample failure and expansion of explosion products was determined using the following techniques.
1) Integrated explosion process luminescent investigation. Detection of the luminescence kinetics was made by the zone PMT and panoramic PMT in the same spectral range (500 nm - 600 nm). A comparison of signals from both of PMT s makes it possible to single out the luminescence part appurtenant to the reaction products get out from the range of detection by the zone PMT. In experiment SA macrocrystals were used. Their sizes were smaller than the diameter of the initiating laser beam (Figure 1(a)). To obtain the difference, the detected luminescence signals were normalized by the maximum and the signal of the panoramic PMT was shifted relative to the zone PMT so that the leading edges of both signals coincided. The difference signal was calculated by the relation
where I1(t) is the normalized signal of the zone PMT, I2(t) is the normalized signal of the panoramic PMT, and ts is the shift time.
The same signal difference investigations made in different spectra parts (500 nm - 600 nm and 800 nm - 900 nm) make it possible to determine the moment of the explosion spectrum change.
2) Investigation of current pulse signals in contact less mode gives direct information on the expansion of the reaction products, which is an ionized gas. Conductivity was studied using filiform SA crystals. The sample and electrodes arrangement is shown schematically in Figure 1(b). A description of the measuring device working in the switch mode is given in [1]. This device allows determining the time of failure of the sample [1] and estimating the explosive reaction products velocity.
This device, as opposed to the device described in [5], does not allow investigating the reaction products movements in case of the large dispersion destination. However, own to the sample is placed between two contacts the current intensity practically does not depend on the interelectrode distance. This fact reduces the error of onset moment signal determination.
In [7] there was announcement about the electrons emission effect, which is observed in case of the reaction was carried out in the degasified chamber. To exclude the effect all experiments to determinate products conductivity were carried out on air.
3) The onset of mechanical failure of the sample can also be estimated by studying the signal of the acoustic sensor which detects the pressure pulse arising from explosive decomposition. The sensor calibrated in the range of loading times studied had a sensitivity of about 0.15 V/bar and a time resolution of 5 nsec [1]. Acoustic signals were studied using filiform and macrocrystalline SA samples.
It has been shown [2] that, near the initiation threshold, the explosive decomposition have a local nature, and if the energy density exceeds the critical value by a factor of two or more, the initiation becomes almost homogeneous. Therefore, in all experiments performed, the energy density of the initiating pulse exceeded the critical value by more than a factor of two.
3. Results and Discussion
Figure 1 shows a typical oscillogram of the signals of the initiating pulse, the luminescence detected by the panoramic PMT (2), zone PMT (3), and their difference in the spectral area 500 - 600 nm. The size of the laser beam exceeded the size of the sample. As it follows from Figure 2, the difference of the signals appears near the maximum of the luminescence signal from the irradiation zone and the first maximum of the luminescence signal detected by the panoramic PMT. The value of the synchronization time, estimated as a shift time, coincides to 5 nsec with the value defined by the metal film evaporation. It means that the processes appurtenant to the front of panoramic and zone PMT are the same, and the method is correct. The absolute maximum of the signals different coincides with the panoramic PMT second maximum location. The last one is associated to the interaction of the expanding explosion products with air and the support [1].
It must be mentioned that only the panoramic PMT and zone PMT signal comparison allows to definitely separate process of the reaction development in solid state
Figure 1. Scheme of initiation. (a) for two PMTs signals comparison; (b) for the current signal investigation.
from the expanding explosion products process. On the panoramic PMT signal (see curve 2 figure 2) two maxima (correspond to the different processes) or three maxima could be distinguished. Authors [2,3], who first used this signal registration device, defined either a few maxima or the plateau on the experimental curve.
Figure 3 shows signals of zone PMT in the 500 - 600 nm and 800 - 900 nm spectral areas (3 and 4 respectively), and their difference (5). The values of the synchronization time, estimated by the signals subtract, and from the model experiment (lead film evaporation [4]) coincides to 5 nsec. According to the comparative investigation of signals of zone PMT in different spectral areas shows that they practically coincide till the signals’ maximum. After the maximum is reached the signal in the area of 500 - 600 nm falls down faster than the signal in the area of 800 - 900 nm (figure 3). In some experiments on the back front appears a local maximum (figure 4), practically
Figure 2. Luminescentce kinetics in relative units. 1-laser pulse, 2-panoramic PMT (500 nm - 600 nm), 3-zone PMT (500 nm - 600 nm), 4-their difference.
Figure 3. Luminescence kinetics in relative units. 1-laser pulse, 2-zone PMT (500 nm - 600 nm), 3-zone PMT (800 nm - 900 nm), 4-their difference.
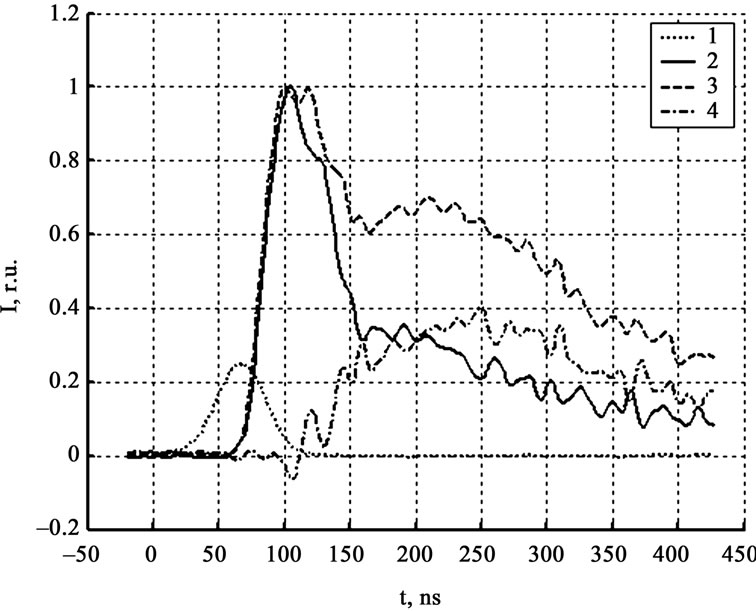
Figure 4. Luminescence kinetics in relative units. 1-laser pulse, 2-zone PMT (500 nm - 600 nm), 3-zone PMT (800 nm - 900 nm), 4-their difference.
not existed in the signal curve in the area of 500 - 600 nm. All mentioned facts prove that the luminescent spectrum changes during the decomposition reaction. There are two obvious reasons—first related to the temperature growth, second is own to the transition from the reaction luminescent to the gaseous products luminescent.
According to the experimental data processing for 40 SA crystals the difference between signals in mentioned spectral areas and between signals of panoramic and zone PMT appears simultaneously after the zone PMT maximum and first panoramic PMT maximum. Absolute maximum of difference signal, as a rule, coincides with the second panoramic PMT maximum; the last one is associated to the interaction of the expanding explosion products with air and the support. Thereby the spectrum changes are simultaneous to the sample distraction and the hot gaseous reaction products formation.
Figure 5 gives the results of luminescence measurements and the conductivity signal of explosive decomposition products at the least gap between the crystal and contacts, not exceeding 20 μm. From the results of initiation of ten crystals in this series of experiments, it was found that the current signal rise falls in the region of the maximum of the signal detected by the zone PMT. As the gap arise the time lag between the current signal and the maximum of the signal detected by the zone PMT increase (see Figure 6). Figure 7 gives the experientially derived dependence of current signal position (relative to the luminescent curve maximum got from the initiation zone) on the interelectrode distance. The dependence was approximated by the equation for the particle moving in the viscous medium:
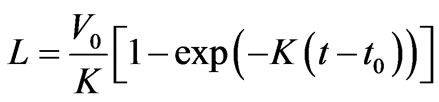
where the expanding explosion products parameters are – V0 = (1.1 ± 0.3) km/s the initial expanding products velocity, κ = (2.3 ± 0.2)·106 s–1 resistance coefficient, t0 = (0.02 ± 0.01) mcs—difference between the expanding products onset moment and the moment of the luminescent curve maximum got from the initiation zone. This values means that the products dispersion begins in 20 nsec after the moment of the luminescent curve maximum got from the initiation zone, and coincides with the arising of the panoramic and zone PMT difference, and the zone PMTs in two spectral areas difference.
Pressure pulse, arising inside the AS sample, was detected by the acoustic sensor. The processing of 150 oscillograms showed that the moment of the signal rise (after the shifting on the delay time) at the average is after the luminescent curve zone maximum and after the first panoramic PMT maximum. The pressure pulse arising, leading to the crystal failure and products dispersion,
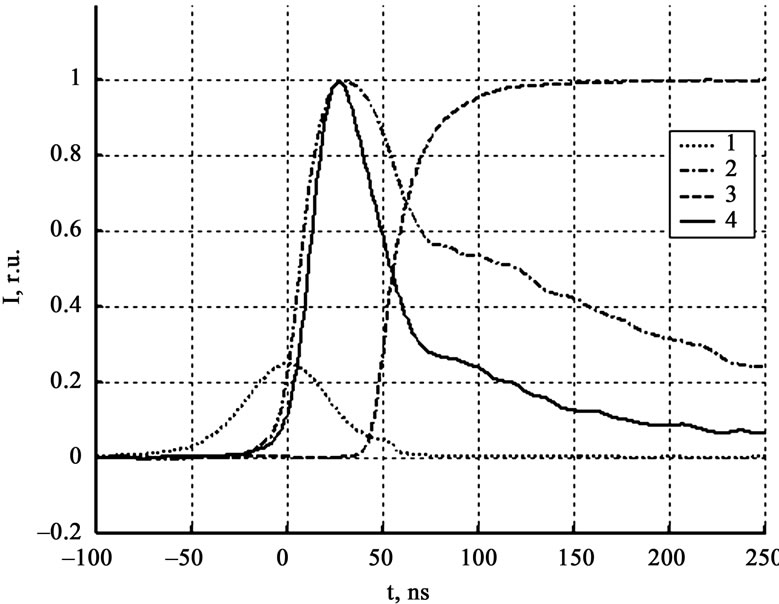
Figure 5. Luminescence and current kinetics in relative units for the minimal interelectrode distance. 1 – laser pulse, 2 – zone PMT (800 nm – 900 nm), 3 – current, 4 – zone PMT (500 nm – 600 nm).
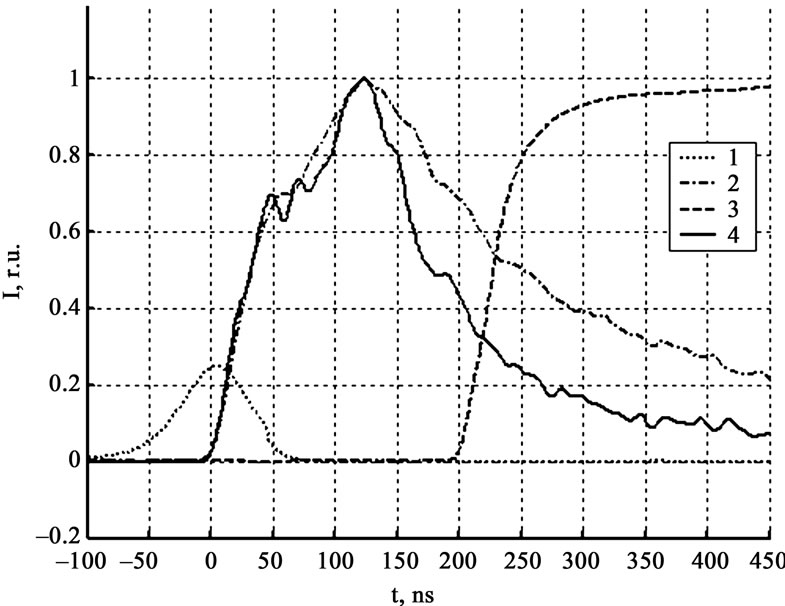
Figure 6. Luminescence and current kinetics in relative units for the interelectrode distance 100 μm. 1 – laser pulse, 2 – zone PMT (800 nm – 900 nm), 3 – current, 4 – zone PMT (500 nm – 600 nm).
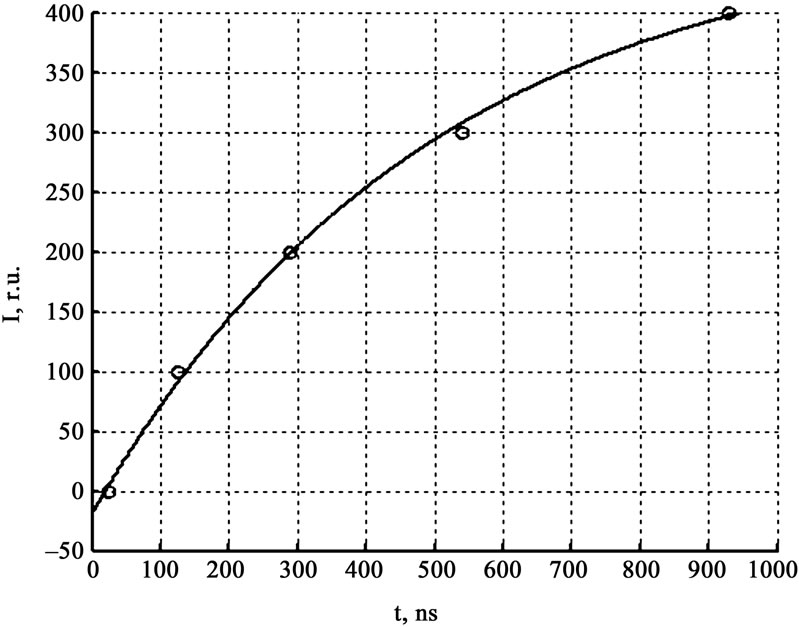
Figure 7. The dependence of current signal position (relative to the luminescent curve maximum got from the initiation zone) on the interelectrode distance.
is practically simultaneously with the second panoramic PMT maximum, which is associated with the expanding explosion products with air and the support.
The experimental data of the onset of the products dispersion in AS mono crystals, got in the present work, does not correspond with data presented in the work [1] for the pressed poly AS and lead azide crystals initiation. It seems that this difference is caused by the inhomogen- eous absorption in the pressed pellet, which leads to the point reaction initiation. Breaking point of pellet is lower than the same value for mono crystal that is why the sample distraction takes place long before the reaction points overlap when the integral burning - out range is small. So using of poly crystal leads to the products dispersion at the stage of the luminescent intensity got from the initiation zone growth, as it was observed in work [1].
The stage of the explosive decomposition in the solid phase till the mechanical destruction lasts about 50 nsec. This time is near to the same value in work [5], but in two range smaller than “preexplosive stage” duration got in [2,3] (about 3 mcs). Luminescent observed before the sample failure (see figure 1) is owning to the decompo- sition process going in the solid phase and can be used for the reaction mechanism identification.
4. Conclusions
According to the experimental data obtained by the three independent methods the mechanical destruction moment of the SA crystal is coincides with the back-front of the luminescent curve got from the initiation zone. This moment is simultaneous with the moment of the luminescent maximum, the last one owning to the expanding explosion products with air and the support, and with the time of the luminescent spectrum changes. Thereby experimentally shown that the AS crystal luminesces before the expanding explosion products. This fact was prejudiced in work [1]. The interval of this luminescent duration is about 50 nsec, this time is considerably shorter than the “preexplosion stage” (about 3 mcs) in [2]. Results obtained are a forcible argument in favour of the chain character of the decomposition reaction in AHM. They are also necessary for the branch - chain solid state reaction kinetic model elaboration and for the development of the absolutely new methods of the sensitivity control to the different nature exposure of the initial explosives and compositions on their basis.
5. Acknowledgements
Authors express thanks to V. P. Tsipilev for the assistance in realization of experiments, to N. M. Fedorova for samples preparation. The work is supported by the RFBR grant (No.11-03-00897).
REFERENCES
- V. I. Korepanov, V. M. Lisitsyn, V. I. Oleshko and V. P. Tsipilev, “Kinetics and Mechanism of Explosive Decomposition of Heavy Metal Azides,” Combustion, Explosion, and Shock Waves, Vol. 42, No. 1, 2006, pp. 94-106. doi:org/10.1007/s10573-006-0012-z
- E. D. Aluker, B. P. Aduev, A. G. Krechetov, A. Yu. Mitrofanov and Yu. A. Zakharov, “Early Stages of Explosive Decomposition of Energetic Materials,” Focus on Combustion Research, Nova Publishers, New York, 2006, pp. 55-88.
- B. P. Aduev, E. D. Aluker, A. G. Krechetov and Yu. P. Sakharchuk, “Explosive luminescence of silver azide,” Journal of Experimental and Theoretical Physics Letters, Vol. 24, No. 16, 1998, p. 31. doi:org/10.1134/1.567503
- V. G. Kriger, A. V. Kalenskii, A. A. Zvekov, M. V. Anan’eva and A. P. Borovikova, “A Diffusion Model of Chain-Branching Reaction of the Explosive Decomposition of Heavy Metal Azides,” Russian Journal of Physical Chemistry B, Vol. 3, No. 4, 2009, pp. 636-640. doi:org/10.1134/S1990793109040198
- E. D. Aluker, A. G. Krechetov, A. Yu. Mitrofanov and A. S. Pashpekin, “Expansion of Explosion Products of Silver Azide,” Russian Journal of Physical Chemistry B, Vol. 1, No. 6, 2007, pp. 570-572. doi:org/10.1134/S1990793107060097
- F. I. Ivanov, L. B. Zuev, M. A. Lukin and V. D. Maltsev, “On the Filiform Azide Silver and Azide Lead Crystals Growth,” Crystalography Reports, vol. 28, 1988, pp. 194-195.
- E. D. Aluker, A. G. Krechetov, A. Yu. Mitrofanov, A. S. Pashpekin and G. V. Artamonov, “Emission of Electrons from Silver Azide at the Preexplosion Stage,” Russian Journal of Physical Chemistry B, Vol. 2, No. 5, 2008, pp 720-721.