World Journal of Condensed Matter Physics
Vol.3 No.1(2013), Article ID:28298,5 pages DOI:10.4236/wjcmp.2013.31005
High-Pressure Raman Study on Anglesite*
![]()
1General Education Center, National Chia-Yi University, Chiayi, Taiwan; 2Department of Creative Fashion Design and Management, Chung-Chou University of Science and Technology, Yenlin, Taiwan; 3Department of Earth Science, National Cheng-Kung University, Tainan City, Taiwan.
Email: peilun@mail.ncyu.edu.tw
Received October 27th, 2012; revised December 3rd, 2012; accepted December 19th, 2012
Keywords: Anglesite; High-Pressure; Raman Spectroscopy; Electronegativity
ABSTRACT
High-pressure Raman spectroscopic experiments of anglesite, PbSO4, were carried out in a diamond anvil cell up to about 35 GPa at room temperature. Two stages of changes in the pattern of wavenumber-versus-pressure plot were observed in most of the vibrational modes. The first stage of change is the kink in the slope of wavenumber-versus-pressure plot at about 14 GPa, indicating a change in the force constant of modes. Further compression up to 21 GPa causes the splitting in the S-O stretching modes, representing the distortion of SO4 tetrahedron. The behavior of transition observed in PbSO4 is similar to that of BaSO4 as well as those found in the solid solution series of BaSO4-SrSO4. Transitions taking place at higher pressure for anglesite is due to the relatively greater value of electronegativity for Pb2+, as compared with M2+ in other complex compounds of similar structure.
1. Introduction
High-pressure research in Earth sciences has been focused on silicate minerals that are directly relevant to the Earth’s interior and much less attention has been paid to other rock-forming minerals. However, recent investigations on some sulfates [1-3] and hydroxides [4,5] had provided interesting observations for the understanding of the behaviors of OH groups in hydrous minerals as well as the structural changes on sulfates under highpressure.
High-pressure study on sulfates is important because sulfates have analogous structure as olivine but with much greater compressibility. It is comprehensible that highpressure study on the distortion of SO4 tetrahedron and the lattice stability of sulfates may have direct implications on the seemly stiffer iso-structural silicates.
The minerals with a structure of barite-type, such as barite (BaSO4), anglesite (PbSO4), and celestite (SrSO4), are some of the most widely distributed sulfates in the world. The structure of barite was reported as orthorhombic system with space group Pbnm [6]. In our previous investigation, we found that BaSO4 shows anisotropic compressibility along three crystallographic axes with c being the most compressible axis [2]. A phase transformation at 10 GPa for barite was also reported [3]. Anglesite, PbSO4, has the same structure as barite and forms complete solid solution with barite in the BaSO4- PbSO4 series [7,8]. Previous investigation on another Barelated solid solution, BaSO4-SrSO4 series, reveals that similar phase transitions occur in members of this series and the pressures at which transitions take place increases with the decrease in the size of M2+ cations [9,10].
Since the two M2+ cations, Ba2+ and Pb2+, have very different chemical and physical behaviors, such as electronegativity and electron configuration etc., it is interesting to conduct high-pressure investigation on anglesite for the understanding of the effect of the cation exchange in the lattice dynamics of the analogous BaSO4 structure.
2. Experimental Methods
Raman scattering method was applied to the study of the behaviors of anglesite at high-pressure. The experimental details are described as follows.
Crystals of synthetic anglesite [11] were ground to fine powder and used as the starting material. The sample was first examined by the Raman spectroscopy for its identity [12]. A disk of T301 stainless steel with an original thickness of 250 μm was used as gasket in the high-pressure work. The gasket was compressed between the diamond anvils to make an indentation on which a hole of 150 μm was drilled for the sample chamber. After the chamber was loaded with sample, it was then filled with a 4:1 methanol-ethanol mixture as a pressure-transmitting medium and then gradually compressed to high-pressure. Ruby fluorescence method was used for pressure measurement [13] after each pressure increments. In each pressure measurement, we measured more than three ruby grains to estimate the pressure distribution of the compressed sample.
A Renishaw 2000 type spectroscopy was used in the Raman spectroscopic study. An Ar-ion laser beam (514.5 nm) was used as an excitation source. The laser light (about 5 μm in diameter) was focused on the sample in the diamond cell and back-scattered Raman signals were collected by the CCD (charge-coupled device) detector. The power for the laser source used was 100 to 500 mW and recording time for each Raman spectrum was 20 to 60 seconds. Pressure was recorded before and after each Raman spectrum was collected. Both loading and unloading processes were conducted. The uncertainties in pressure and wavenumber readings are 0.5 GPa and 1 cm−1, respectively.
3. Results
Some of the representative Raman spectra of anglesite taken during the loading and unloading processes of the experiment are shown in Figure 1. The Raman ν1 (nondegenerate symmetric stretching mode at 978 cm−1), ν2 (doubly degenerate symmetric bending mode at 439, 450 cm−1), ν3 (triply degenerate asymmetric stretching mode at 1064, 1157 cm−1) and ν4 (triply degenerate asymmetric bending mode at 606, 616, 642 cm−1) of anglesite are observed at the ambient conditions in this study. This is in excellent agreement with that reported in the literature. [10,11] Griffith [12] reported that anglesite exhibited more than nine relatively intense Raman bands at the ambient conditions (ν3 mode (1057, 1068, 1162 cm−1)). However, several Raman modes are not observed in this measurement. The reason for this is probably due to a considerable mixing of the translational and rotational bands which were not easily resolved in the anglesite crystal [14].
The frequencies of Raman modes are found to increase, but their intensity becomes weaker with increasing pressure. Most Raman bands of anglesite remain quite sharp at all pressures. It is found that the ν1 mode splits into two recognizable peaks when the pressure exceeds 21 GPa, and the intensity of the new peak becomes stronger with increasing pressure. The ν3b mode also splits into two peaks when the pressure exceeds 21 GPa, but it is too weak to be defined. No sign of splitting is detected for the ν2 and ν4 mode throughout the entire pressure range up to 35 GPa.
The variations of the frequency with respect to pressure for all the observable Raman bands of anglesite are plotted in Figure 2. Interesting phenomena are observed
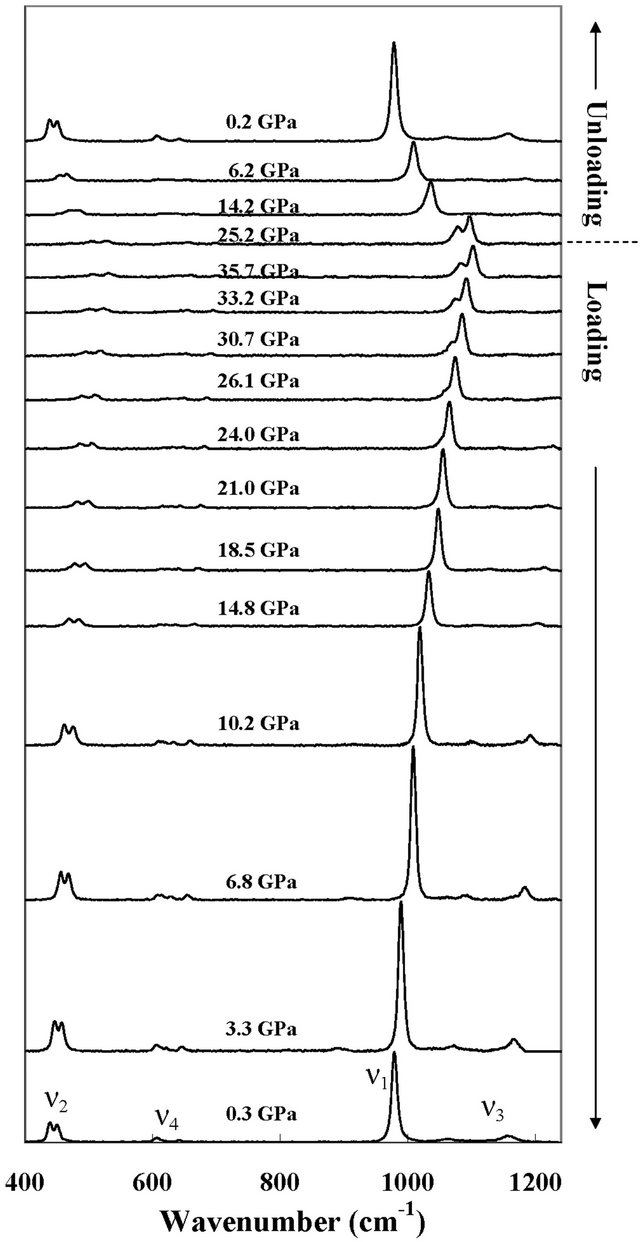
Figure 1. A series of Raman spectra of anglesite shows the effect of pressure on the four Raman modes. The ν1 mode is the most intense Raman mode of anglesite. The anglesite phase was recovered during the unloading process.
as well as the splitting of stretching modes of S-O. In Figure 2, it is noted that all Raman bands are seen to vary linearly with pressure up to about 14 GPa. With further compression, apparent kinks or discontinuities in the wavenumber-versus-pressure plot are detected for almost all modes.
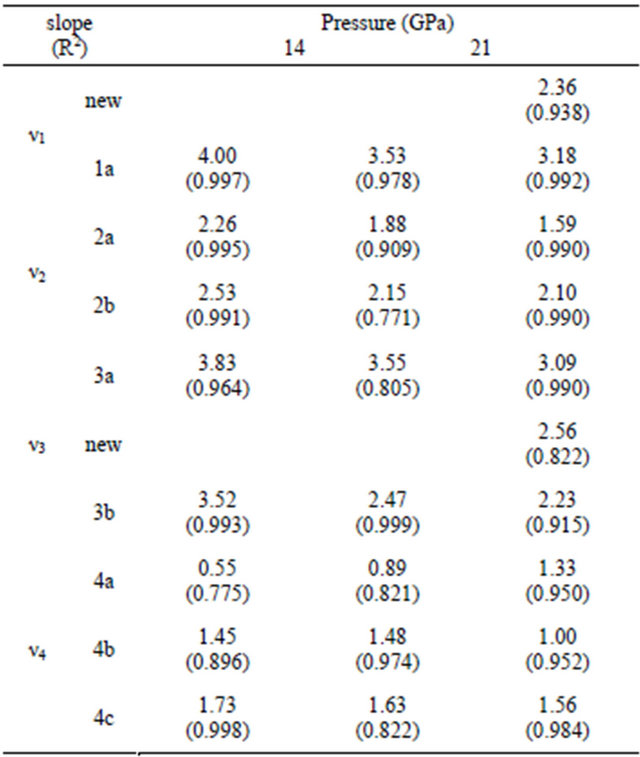
The changes in the slope (dν/dP) of each Raman mode of anglesite with pressure are listed in Table 1. The S-O stretching modes, ν3 and ν1, show two discontinuities during compression at 14 and 21 GPa. Above 21 GPa, in addition to the kink in the slope (dν/dP), new mode also appears in both of ν3 and ν1. The kinks in the slope of ν2 modes and ν4 modes, though to a much less magnitude,
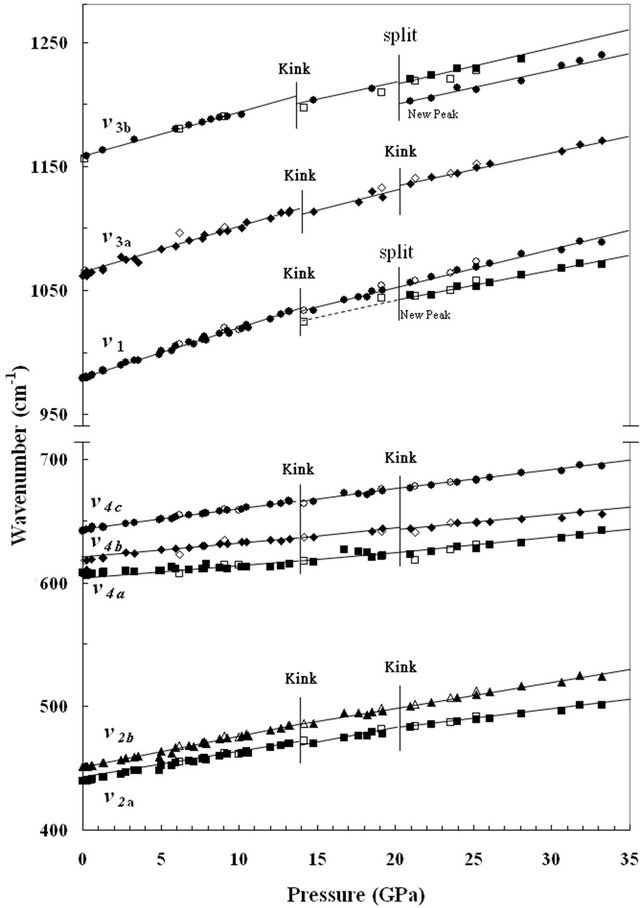
Figure 2. A plot shows the shifts of the wavenumber of each Raman mode of anglesite as a function of pressure. Data for loading process are shown as solid symbols and those for unloading process as open symbols. Two stages of change in the slope of each mode as well as the change in the number of modes can be observed. The “kink” at which a discontinuity in the slope of wavenumber vs. pressure plot is seen for each mode at 14 GPa. The solid lines are the eyeball linear fit of the data (note the difference in the scale on the vertical-axis of the pattern).
also can be detected at 14 GPa and 21 GPa (Figure 2). The appearance of the kinks for all modes at 14 GPa and 21 GPa is interpreted as the changes in the force constants of the S-O vibration bands while the splitting of ν1 and ν3b above 21 GPa represents the onset of the distortion of SO4 tetrahedra. The additional vibrational modes that show up at high-pressure persist during the unloading process until about 10 GPa where all modes are converted to the original phase.
4. Discussion
In the structure of anglesite, each sulfur atom is surrounded by four oxygen atoms and forms an SO4 tetrahedron while each lead atom coordinates with 12 oxygens. Among the 12 oxygen atoms, 11 atoms shared with the nearest six neighboring SO4 tetrahedra and the twelfth
Table 1. The variations of the slope (dν/dP, cm−1/GPa) of each Raman mode in anglesite.
oxygen associates with another SO4 tetrahedron. In other words, each Pb2+ is coordinated with 12 oxygen ions to form seven different SO4 groups [6]. The Raman modes observed in this study are all assigned to the stretching and bending of the S-O modes. These S-O modes are nevertheless affected by the relative changes of Pb-O distance during the compression process. When anglesite is compressed, the change in the bond distance between Pb-O would response more to the compression force than that between S-O in the SO4 tetrahedron due to the fact that PbO12 polyhedra are more compressible than SO4 tetrahedron. Therefore, the bonding distances between Pb and O tend to decrease more than those between S and O during initial stage of compression process. However, when PbO12 polyhedra are compressed further, the Pb-O distances gradually decrease and their bonding strengths increase in the meantime. As a consequence, the force constants of various band of S-O in SO4 tetrahedra will also change since their bonding oxygens are sharing with Pb in PbO12 polyhedra. The discontinuity in the slope dν/dP for various Raman modes at 14 GPa signifies that the PbO12 polyhedra are compressed to the extend that their average Pb-O distance reaches a critical state as to cause a sudden change in the bonding forces of various S-O bonds. The change in the force constant among various S-O bands in SO4 tetrahedra result in the deviation of compression data from the normal compression curve above 14 GPa.
Althought there are changes in the force constant in various S-O bonds, the SO4 tetrahedra in the lattice remain undistorted until they are compressed up to 21 GPa where additional modes appear in the stretching bands (Figure 2), accompanying the slight but noticeable change in the slope of all S-O modes (Table 1). These phenomena are attributed to the distortion of SO4 tetrahedra as their bonding oxygens are further bonded with Pb of PbO12 polyhedra as more and more pressure is applied. The distortion of SO4 tetrahedra persists up to 35 GPa in this experiment. The distortion of SO4 tetrahedra as well as the change in the force constants of various S-O bonds is, nevertheless, reversible that the wavenumbers of all vibration modes follow the trend of compression process during the unloading process.
Barite, celestite and anglesite all have the same structure with different M2+ cations (Table 2). It is interesting to note that similar changes in the vibrational modes are observed among these compounds under high-pressure [3, 9; also see Table 2]. The variations of the frequency with respect to pressure for Raman ν1 mode of barite, celestite and anglesite are plotted in Figure 3. From Figure 3, we know the pressures at which the kinks in slope as well as the split of SO4 tetrahedra take place are different in those minerals. The pressure at which the first kink takes place is 8, 10 and 14 GPa for barite, celestite and anglesite, respectively. The pressure at which the second kink takes place is 17, 18 and 21 GPa for barite, celestite and anglesite, respectively.
As we noted in Table 2 that these compounds have similar M-O bonding lengths and S-O bonding force constants and, therefore, it is not surprising that they behave similarly under high pressure. Chen et al. [10] reported that 2 stages of changes in Raman modes occur at high pressure in the BaSO4-SrSO4 solid solution series. The compound with larger cation tends to undergo structural modifications at a pressure lower than that with smaller cation. Since the size of Ba2+ is larger than Sr2+ and Pb2+, the transitions take place in BaSO4 are at pressures lower than those in SrSO4 and PbSO4. Howeverthe fact that the pressures at which transitions occur in SrSO4 are lower than those in PbSO4 is not accounted for by the effect of cation size since the size of Pb2+ is larger than Sr2+ that the transitions in PbSO4 should be expected to take place at pressures lower than those in SrSO4. Apparently, factors that cause the transitions in PbSO4 at pressures higher than those in SrSO4 other than the difference in size are needed.
Miyake et al. [15] reported that the electronegativity of a metal and the Coulombic force between cation and oxygen may modify the symmetry of the SO4 tetrahedron. For instance, the cation-oxygen bonding length in PbSO4 is shorter than BaSO4 due to their difference in electronegativity of M2+. Though the size of Pb2+ is smaller than that of Sr2+, the electronegativity of Pb2+ is much larger than Sr2+ (Table 2). Higher value in electronegativity fro a cation implies that it tends to form stronger bond with anions such as oxygen. Therefore, the bonding force of Pb-O in PbO12 polyhedra is higher than that of Sr-O in SrO12 polyhedra at the ambient conditions. The PbO12 polyhedra in PbSO4 are more difficult to compress and the effect on the changes of force constants in S-O bonds would be expected to occur at pressure much higher than those in SrSO4. That explains why the kinks and splitting in SO4 stretching modes in PbSO4 take place at pressure higher than those in SrSO4.
5. Conclusion
Raman spectroscopic observation on PbSO4 at high-pressure up to 35 GPa shows two stages of changes in the pattern of wavenumber-versus-pressure plot in most of the vibrational modes. The first stage of change is the kink in the slope of wavenumber-versus-pressure plot at about 14 GPa, indicating a change in the force constant of modes. Further compression up to 21 GPa causes the splitting in the S-O stretching modes, representing the distortion of SO4 tetrahedron. Similar changes of Raman modes in PbSO4 are present in members of the solid solution series of BaSO4-SrSO4. Transitions taking place at
Table 2. Some characterized parameters of barite, celestite and anglesite.

#Jacobsen et al. (1998) [16]. *Miyake et al. (1978) [15].
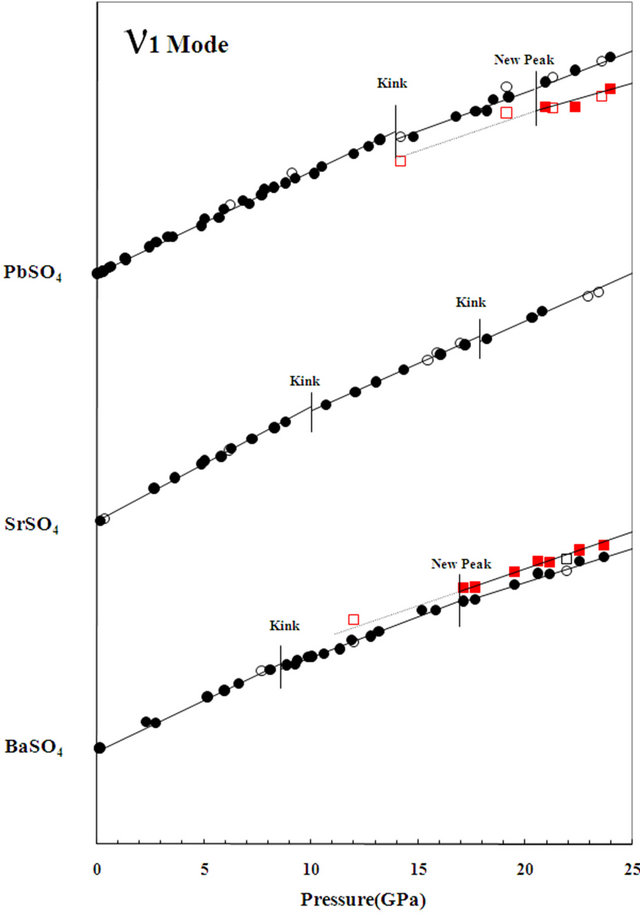
Figure 3. A plot shows the shifts of the wavenumber of Raman ν1 mode of PbSO4, SrSO4 and BaSO4 as a function of pressure.
higher pressure for PbSO4 is due to the relatively greater value of electronegativity for Pb2+, as compared with M2+ in other complex compounds of similar structure.
REFERENCES
- E. Huang, J. Xu, J. F. Lin and J. Hu, “Pressure-Induced Phase Transitions in Gypsum,” High Pressure Research, Vol. 17, No. 1, 2000, pp. 57-75. doi:10.1080/08957950008200306
- P. L. Lee, E. Huang and S. C. Yu, “Phase Diagram and Equations of State of Barite, BaSO4,” High Pressure Research, Vol. 21, No. 2, 2001, pp. 67-77. doi:10.1080/08957950108201005
- P. L. Lee, E. Huang and S. C. Yu, “High-Pressure Raman and X-Ray Studies of Barite, BaSO4,” High Pressure Research, Vol. 23, No. 4, 2003, pp. 439-450. doi:10.1080/0895795031000115439
- E. Huang, R. J. Chen, A. Li, T. Yamanaka and J. Xu, “High Pressure Phase Transition in Al (OH)3: Raman and X-Ray Observations,” Geophysical Research Letters, Vol. 23, No. 22, 1996, pp. 3083-3086. doi:10.1029/96GL03023
- E. Huang, J. F. Lin, J. Xu, T. Huang, Y. C. Jean and H. S. Sheu, “Compression Studies of Gibbsite and Its High-Pressure Polymorph,” Physics and Chemistry of Minerals, Vol. 26, No. 7, 1999, pp. 576-583. doi:10.1007/s002690050221
- R. W. James and W. A. Wood, “The Crystal Structure of Barite, Celestite and Anglesite,” Proceedings of the Royal Society, Vol. 109A, No. 752, 1925, pp. 598-620.
- J. S. Lee and S. C. Yu, “A Study of Hokutolite Synthesis and Its Mineralogical Implications to Natural Occurrences,” Journal of the Geological Society of China, Vol. 39, No. 3, 1996, pp. 223-234.
- B. Takano, M. Yanagisawa and K. Watanuki, “Structure Gap in BaSO4-PbSO4 Solid Solution Series,” Mineralogical Journal, Vol. 6, No. 1, 1969, pp. 159-171.
- Y. H. Chen, E. Huang, S. C. Yu and P. L. Lee, “Raman Spectroscopy and X-Ray Diffraction Studies on Celestite,” Physica B: Condensed Matter, Vol. 405, No. 20, 2010, pp. 4386-4388.
- Y. H. Chen, E. Huang and S. C. Yu, “High-Pressure Raman Study on the BaSO4-SrSO4 Series,” Solid State Communications, Vol. 149, No. 45-46, 2009, pp. 2050- 2052. doi:10.1016/j.ssc.2009.08.023
- H. R. Wang, “The Study on the Flux Growth Method of Hokutolite Crystals,” Master’s Thesis, National Chen-Kung University, Tainan, 1998, p. 59.
- W. P. Griffith, “Raman Spectroscopy of Minerals,” Nature, Vol. 224, No. 5216, 1969, pp. 264-266.
- H. K. Mao, J. Xu and P. M. Bell, “Calibration of the Ruby Pressure Gauge to 800 Kbar under Quasi-Hydrostatic Conditions,” Journal of Geophysical Research, Vol. 91, No. 135, 1986, pp. 4673-4676.
- P. Dawson, M. M. Hargreave and G. R. Wilkinson, “Polarized IR. Reflection, Absorption and Laser Raman Studies on a Single Crystal of BaSO4,” Spectrochimica Acta, Vol. 33A, No. 2, 1977, pp. 83-93.
- M. Miyake, I. Minato, H. Morikawa and S. I. Iwai, “Crystal Structures and Sulphate Constants of Barite, Celestite, and Anglesite,” American Mineralogist, Vol. 63, No. 5-6, 1978, pp. 506-510.
- S. D. Jacobsen, J. R. Smyth, R. J. Swope and R. T. Downs, “Rigid-Body Character of the SO4 Groups in Celestite, Anglesite and Barite,” Canadian Mineral, Vol. 36, No. 4, 1998, pp. 1053-1060.
NOTES
*This project was supported by the National Science Council (NSC 98-2918-I-415-001).