Atmospheric and Climate Sciences
Vol.4 No.3(2014), Article
ID:48112,10
pages
DOI:10.4236/acs.2014.43039
Climate Change, Variability and Rainfall Probability for Crop Planning in Few Districts of Central India
Suchit Kumar Rai*, Sunil Kumar, Arvind Kumar Rai, Satyapriya, Dana Ram Palsaniya
Indian Grassland and Fodder Research Institute, Jhansi (UP)-284003, India
Email: *suchitrai67@yahoo.co.in
Copyright © 2014 by authors and Scientific Research Publishing Inc.
This work is licensed under the Creative Commons Attribution International License (CC BY).
http://creativecommons.org/licenses/by/4.0/


Received 11 April 2014; revised 10 May 2014; accepted 5 June 2014
ABSTRACT
Trend and climate change were studied in annual rainfall data for the period of 62 years (1949- 2010) of Sagar and 65 years (1945-2010) of Damoh districts of Bundelkhand region of central India. The analysis of weekly rainfall probability was also carried out at both the locations for field operations and crop planning in rainfed agricultural system for improving the farmer’s livelihood. Mean annual rainfall was 1233.8 mm with 32.6% variability for Sagar and 1225.1 mm with 30.3% variability for Damoh region. Sagar and Damoh region exhibited significant decreasing trend in the total amount of annual rainfall in the last 15 years (1996 to 2010). Also, both locations showed significant long-term decreasing trend in annual rainfall. Climate of both the regions have changed as in the recent 15 years annual rainfall had decreased by 156.4 and 310.7 mm at Sagar and Damoh from their long period average (LPA), respectively. The Initial and conditional rainfall probability analysis at Damoh reinforced that Initial probabilities {P (W)} of getting 10 mm rainfall per week was 76% during 25th (18-24 June) SMW. Thus, the seed bed preparation could be initiated during this week. Initial as well as conditional probability of wet week followed by wet week {P(W/W} of getting 20 mm rainfall was more than 80% during 27th SMW (2-7 July) in Sagar district. Therefore, this week is most suitable for sowing operation in this district.
Keywords:Climate Change, Rainfall Trend, Initial and Conditional Rainfall Probability and Crop Planning

1. Introduction
Climate from geological epoch has been changing with time and it is reasonable to assume that it will change. Recently, the severe drought conditions have disrupted human societies in Bundelkhand region of central India and got the attention of India on reality of climate variability and its significance. The information on annual and seasonal rainfall of a region is useful to design water harvesting structure for agricultural operations, field preparation, seeding, irrigation, fertilizer application and overall in field of crop planning [1] [2] . Climatic variability, particularly rainfall is the major factor influencing the agricultural productivity and sustainability in the tropics [3] . Around 60% of the Indian agriculture is rain-dependent, distress-prone and vulnerable to climate. Constant increase in green house gas concentrations, since pre-industrial times, has led to positive radiative forcing of the climate, tending to warm the surface. The fourth assessment report of IPCC confirmed the rise in atmospheric temperature by 0.74˚C over the last 100 years and projected a temperature increase of 1.8˚C to 4˚C by 2100 [4] . There is also a global trend for increased frequency of drought as well as heavy precipitation events, posing potential threat to ecosystem especially agricultural production and productivity [5] [6] . Recent studies indicate that increase in temperature with rainfall uncertainties may lead to loss of 10% - 40% crop production in India due to its large population and limited resources [7] -[9] . Uncertainties and seasonal migrations have been further compounded due to high frequency of the extreme rainfall and weather events like droughts due to global warming [10] . Historically, Bundelkhand region of Central India used to have one drought in 16 years in 19th century which increased by three times during the period 1968 to 2000 and in last 10 years, region have witnessed five drought years [11] . Several studies have been undertaken in India to assess the rainfall variability. Blandford [12] was the first meteorologist to made extensive studies on Indian rainfall. Parthasarthy and Mooley [13] for Karnataka and Dhar [14] for Tamilnadu have found the significant evidence for the presence of different cycles ranging from 2 years to short periods in the rainfall series of different regions of India. Detailed analysis of long-period rainfall data over different sub divisions of India and also over India as a whole does not indicate any long-term climatic change, but only indicate year-to-year random fluctuations during 100 years (1871-1978). Also, some significant cycles of 2 (quasi-biennial) - 15 years periods were noted only in some regions of India [15] [16] . Annual rainfall along with a five-year moving average showed that trend was alternatively increasing and decreasing in nature consisting of a period of five or six years at Pusa, Bihar, India [17] . It showed long-term increasing trend with a rate of 1.98 mm per year. Also, in another districts of Bihar i.e., Madhepura, a significant long-term increasing trend was noticed in annual rainfall series with a rate of 13.8 mm/year [18] . Both the locations under study are categorized as rainfed regions with low, erratic and uncertain rainfall pattern with frequent dry spells during the monsoon season. Hence, cropping in monsoon season is tricky with very high risk of crop failure due to early withdrawal of monsoon. The current changing climatic scenarios are projected to have a major impact on the rainfall pattern and its intensity which would directly affect the ecosystem, agricultural production practices, water resource management and the crop planning [11] . The rainfed agro-ecology is characterized as vulnerable for agricultural operations which revolve around moisture availability due to rainfall pattern, amount, intensity and its uses for crop production [19] . In most of studies the workers have suggested the cropping pattern considering the rainfall amount at different probability levels [20] -[22] . Taking into account these climatic and probability factor, the current study was conducted at two rainfed districts of Bundelkhand region namely Sagar and Damoh for interlinking the rainfall probability and intensity factor with the crop planning pattern in the region.
2. Materials and Methods
Weekly rainfall data for the period 1949 or 1945 to 2010 i.e., for 62/66 years pertaining to Sagar (23˚5'N, 78˚5'E, 594 m msl), and Damoh (25˚5'N, 79˚29'E, 595 m msl), respectively were obtained from India Meteorological Department (IMD), Pune, India. Weekly, annual and seasonal rainfall distribution patterns were critically examined and analyzed adopting procedure suggested by Panse and Sukhatme [23] . In order to apply appropriate statistical test, the frequency distribution of annual and seasonal rainfall series have been tested for normality by Fisher’s statistics. The annual rainfall series of both locations were divided in three sub-periods i.e., I sub-period (1945/41-1970), II sub-period (1971-1995) and III sub-period (1996-2010). The sub-period averages were compared with long period average using Cramer’s test ( ) [24] , to apply Cramers’s test (
 ), let
  and S be defined respectively as the mean and standard deviation of the entire record of N values.

Then computed,  ,
,


Now, let  be defined as the mean of the sub-period of n values,

Defining:

We computed:

The statistic  is distributed as “Student’s” t with
  degrees of freedom.
Trends were examined using Mann-Kendall rank statistic (t), Spearman rank statistic (rs) and Gaussian low-pass [24] . Before computing Mann-Kendall rank statistic (t), the series xi were replaced by their ranks ki such that each term was assigned a number ranging from 1 to N that reflects its magnitude relative to the magnitude of all other terms. Then statistic P for the series was computed, which is accomplished as follows. Count up the number of later terms whose values exceed k1, and denote this number by n1. Then compare the value of the second term that exceed k2, and denote this by n2. Continue this procedure for each term of the ki series with XN−1 and its corresponding number nN−1, then P is given by the sum:

where, as:

Spearman rank statistic (rs): The calculation rs requires that the series xi under investigation first be transformed to its rank ki as described above. The each term of rank series ki should be subtracted by i to compute di (where “i” ranges from 1 to N).

Then compute, 

where, as:

For N larger than 8, the value of rs can be tested for significance by solving for “t” with the equation given below and comparing this with probability points of student’s t-distribution for ( ) degrees of freedom.
t = 
An initial and conditional probability of weekly rainfall at different threshold limits (10, 20 and 40 mm) were computed using first order Markov chain process [25] . Expected amount of rainfall at a given probability level was computed using Weibull’s distribution [26] as given below

where, Pr is the plotting percentage, N is the total numbers of years and “m” is the rank of observed values of weekly rainfall, when rainfall in descending order of magnitude.
3. Results and Discussion
3.1. Mean and Variability in Annual and Seasonal Rainfall
The mean annual rainfalls for both the locations are more than 1200 mm with a standard deviation (SD) of more than 371 mm and coefficient of variation (CV) of more than 30.3%. The coefficient of variation indicates that the rainfall was highly variable at these two locations. The average annual rainfall varied from 491.7 mm (1981) to 2167.1 (1991) and 234.8 (1989) to 2387.3 mm (1956) at Sagar and Damoh, respectively (Table 1).
The annual and monsoon (23rd - 39th SMW) rainfall series were normally distributed. About 90% of annual rainfall is received from the southwest monsoon during monsoon season. Average rainfall during the monsoon season is 1104.5 mm and varied from 440.6 to 1896.3 mm with SD of 320 mm at Sagar. The annual rainfall contribution was 2.5%, 4.4% and 3.5% to the pre-monsoon (10th - 22nd SMW), post monsoon (42nd - 50th SMW) and winter (51st - 9th SMW) season rainfall, respectively. The CV (more than 100%) indicated that the rainfalls during these seasons are highly variable. The rainfall ranged from zero to 201.5 mm, zero to 246.0 mm and zero to 196.2 mm for respective seasons, respectively. Coefficient of skewness and coefficient of kurtosis showed that rainfall series in all the three seasons were not normally distributed. At Damoh, similar pattern of rainfall during monsoon season was observed as at Sagar.
In monsoon season, the highest (1953.4 mm) and lowest (219 mm) rainfall was recorded during the year 1956 and 1989, respectively (Table 1). The potential evapo-transpiration was estimated to be 1457.2 mm and 1476.7 mm for Sagar and Damoh, respectively indicating annual water deficit by 658.8 mm and 634.9 mm for respective locations. Fisher statistics (g1/SE(g1) and g2/SE(g2)) were computed to test the normality at 95% level of significance. It is evident from the Table 1 that the frequency of rainfall series during post monsoon, pre-monsoon and winter season were not normally distributed except annual and monsoon season at both the locations. The mean seasonal rainfall varied from 30.5 to 54.4 mm with high degree of variability, since the CV is more than 100%.
3.2. Climate Change and Trend Analysis
3.2.1 Comparisons of Short Period Average Rainfall with the Long Period Average Rainfall
The average of these sub-periods along with Crammer’s tk test is given in Table2 The average annual rainfall during the periods 1949-1970 and 1971 to 1995 was 1237.4 and 1185.2 mm and was not significantly (P < 0.05)

Table 1. Statistical parameters of annual and seasonal rainfall in Sagar & Damoh districts of central India.
*Frequency distribution rainfall series are not normal at 95% level, %C: Contribution in annual rainfall (%), CS: Coefficient of skewness, CK: Coefficient kurtosis, g1/SE(g1) and g2/SE(g2): Fisher statistics.
Table 2. Annual rainfall during different period at Sagar & Damoh locations of Central India.
*, ** Significant at 5 and 1% probability level.
differed from the long period average (LPA) of 1233.8 mm. However, the average annual rainfall (1077.4 mm) during the recent period (1995-2010) was significantly (P < 0.05) lower than the LPA at Sagar. Rainfall had decreased by 156.4 mm during the recent period as compared to LPA. At Damoh, the I sub-period (1945-1970) average (1307.7 mm) was higher and differ significantly from their long period average (1225.1 mm). However, the II sub-period rainfall did not differ significantly (Table 2) from its LPA. As the recent sub-period III is concerned, the average annual rainfall (914.4) was significantly different from its LPA, and rainfall had decreased significantly by 310.7 mm. Thus, it is clear that the climate of both the regions have changed with greater magnitude at Damoh as compared to Sagar.
3.2.2. Low Pass Filter
To understand the nature of trend, the annual series was subjected to “Gaussion low pass filter” (GLPF) analysis i.e., a 9-point Gaussian low pass filter/weights (WMO, 1966) was used to give a smoothed curve [27] [28] . The smoothed time series curve was drawn of the time series in addition to the trend line of original series. The low pass filters for annual rainfall series for both the locations are shown in Figure 1 and Figure 2. GLPF curves indicated that the trend in annual rainfall series was not linear but oscillatory in nature consisting for a period of 3 to 11 years for both the locations (Figure 1 and Figure 2). An increasing trend was noticed from year 1945 to 1961, whereas the rainfall during the period from 1962 to 1966 showed decreasing trend at Sagar (Figure 1). Thereafter, 1999 onward LPF showed a significant decreasing trend in the annual rainfall series. Linear trend was computed using regression over GLPF over the two locations showed that the annual rainfall had decreased by 213.9 and 274.3 mm over the period 62 and 66 years at Sagar and Damoh, respectively. The rate of decrease in annual rainfall series per year was higher (6.8 mm/year) at Damoh as compared to Sagar (5.23 mm/year) Also, regression analysis showed a significant decreasing trend (Y = −42.3x + 1363.2, R2 = 40.0%) in annual rainfall series during the recent sub-period (1995-2010) with a rate of 42.3 mm/year. Similarly, at Damoh annual rainfall series exhibited significantly decreasing trend (Y = −24.941x + 1139.5 R2 = 16.6%) during the recent period (1995-2010) with a rate of 24.9 mm/year. However the magnitude of decrease at Damoh was lower than Sagar.
3.2.3. Trend Analysis Using Mann-Kendall Rank and Spearman Rank Statistics
The Mann-Kendal rank (t) and Spearman Rank Statistics (rs) revealed a significant (P < 0.05) decreasing trend in annual and kharif (26th - 41st SMW) (Table 3). At Sagar, rabi (42nd - 15th SMW) season rainfall showed slight decreasing trend but not statistically significant. However, rabi season rainfall at Damoh showed a significant decreasing trend.
4. Rainfall Probability for Crop Planning
4.1. Initial and Conditional Rainfall Probability Analysis
The initial rainfall probability {P (W)} of getting 10 mm rainfall per week was 67% and 69% during 25th and 26th SMW, respectively at Sagar district (Figure 3) and hence, field preparation should be done during this period. The initial as well as conditional probability of wet week followed by wet week {P (W/W)} of getting 20 mm rainfall was more than 80% in 27th SMW. Therefore, this week is more suitable for sowing of crops. The top dressing of urea may be done during 32nd SMW as the {P (W/W)} of getting 20 mm rainfall during this period is more than 95% (Figure 3). Similarly, the conditional probability of dry followed by dry {P (D/D)} of getting 10 mm rainfall is 78% in 35th (27 August-2 September) SMW (Figure not shown), and hence, pesticides may be sprayed to control insects, pests and diseases in all the affected crops. This period is also suitable for carrying out inter-cultural operations in the crops.
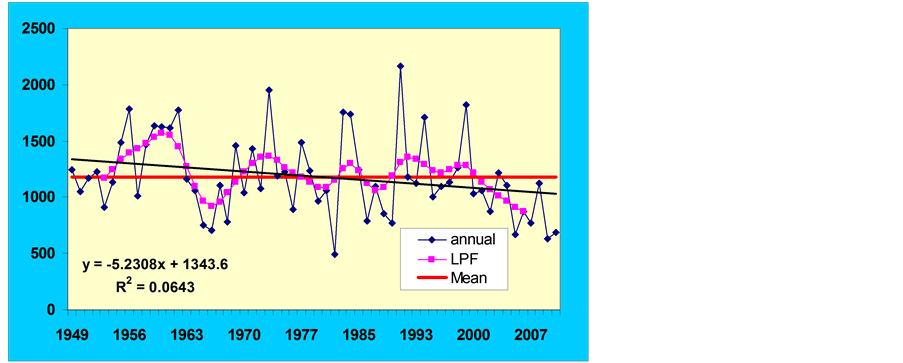
Figure 1. Gaussian low pass filter curves of annual rainfall at Sagar.
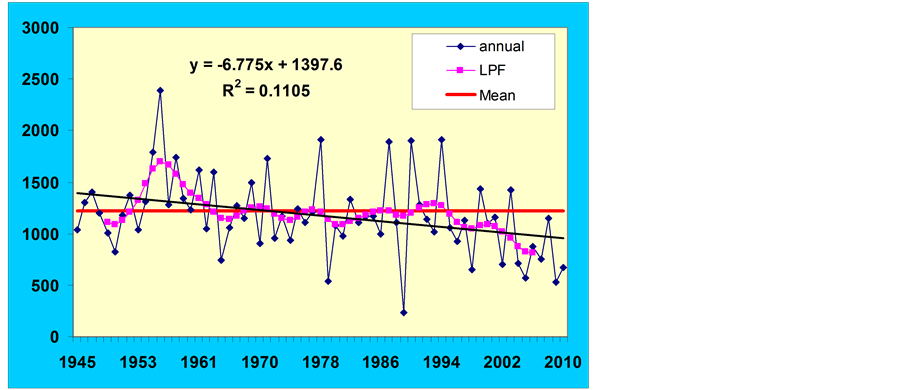
Figure 2. Gaussian low pass filter curves of annual rainfall at Damoh.
Table 3. Mann-Kendal rank (t) and Spearman Rank Statistics (rs) of annual and seasonal rainfall.
*, Significant at 5% probability level.
The initial and conditional rainfall probability analysis at Damoh revealed that initial probabilities {P (W)} of getting 10 mm rainfall per week was 76% during 25th (18-24 June) SMW (Figure 4). Thus, the seed bed preparation could be initiated during 25th SMW, since an amount of 10 mm rainfall per week can be taken as the minimum requirement for seedbed preparation and even sowing in already tilled fields for rainfed kharif crops. However, sowing can be done during 26th SMW as the conditional probability of wet week followed by wet week of getting 20 mm rainfall was 76% - 94% during 26th - 27th SMW. More than 50% probability of 20 mm rainfall during a week is considered as the wet week and is ideal for the crop sowing operation [22] . The {P (W/W)} of 40 mm rainfall during 27th to 37th (10-16 September) SMW was ranged between 56% to 80% (Figure 4), hence, proper drainage provisions should be made in deep and medium black soils. The top dressing of


Figure 3. Initial and conditional probabilities of weekly rainfall at different threshold limits at Sagar.
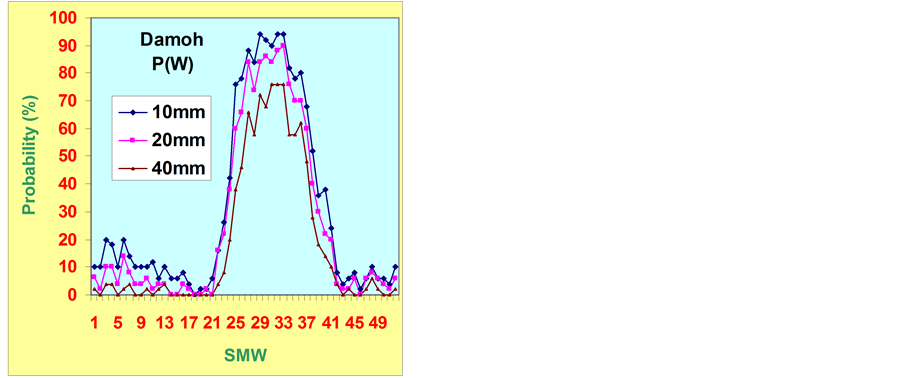
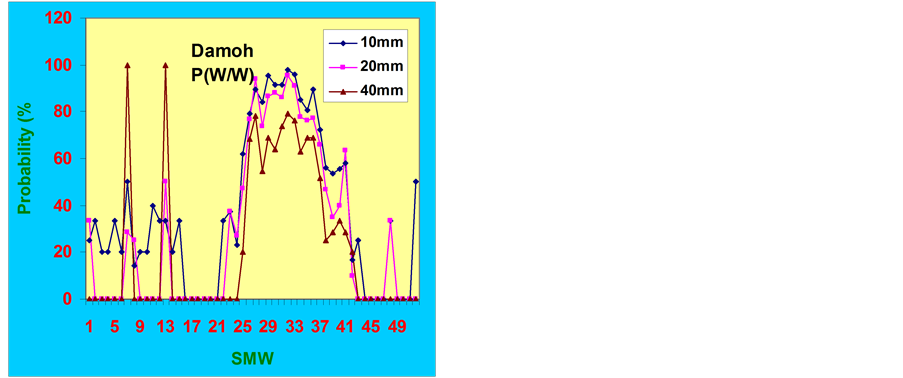
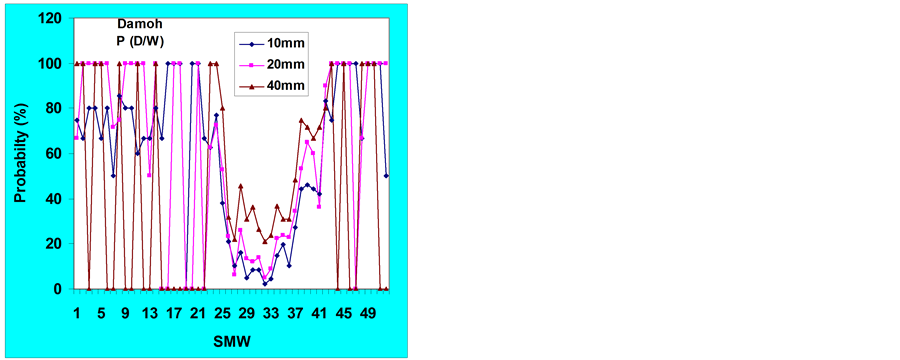

Figure 4. Initial and conditional probabilities of weekly rainfall at different threshold limits at Damoh.
urea may be done during 32nd (6-12 August) and 33rd (13-19 August) SMW as the {P (W/W)} of getting 20 mm rainfall during this period is more than 90% [29] . Similarly, the conditional probability of dry followed by dry {P (D/D)} of getting 10 mm rainfall is 67% and 83% in 34th (20-26 September) and 39th (24-30 September) SMW, respectively, and hence, pesticides may be sprayed to control insects, pests and diseases in all the affected crops. Since the conditional probability of getting 10 mm rainfall is less than 20% during the crop season, therefore, intercultural operations may be planned as and when sunny days appears for 2 - 3 days.
The chances of taking rainfed rabi crops are more at Sagar in comparison to Damoh as the conditional probability of wet followed by wet is more than 60% during second week of January. However, at both the locations with the advancement of time, probability of getting rainfall is reducing and it was recorded that from 38th (17- 23 September) SMW, the initial probability of getting rainfall of 20 mm reduced to 40%, clearly indicating that supplemental irrigation is required for long duration varieties. The study also shows long-term rainfall probability studies may be important parameters for varietal selection to achieve assured production in a particular region. Short duration varieties of rainfed crops should be selected in the above mentioned regions, where, rainfall starts receding within 38th SMW. Therefore, ICRISAT bred chickpea cultivars, such as, ICCV-96029 (matures within 75 days), ICCV-2 and ICCV-93929 (both matures within 85 days) and IARI bred mustard cultivars like Pusa Agrani, Pusa Mahak, Pusa Tarak, Pusa Mustard 25 and Pusa Mustard 27 (all maturing between 100 - 110 days) should be selected for this region so that terminal droughts may be escaped.
4.2. Expected Rainfall Amount and Sustainable Crop Production Strategies
The minimum weekly rainfall amount expected at 60%, 70% and 80% probability level is presented in Table 4 for both locations along with their weekly long-term mean. As discussed above rainfall at 80% probability is assured rainfall and at 50% probability is the median limit for taking risk. At Sagar, the probability of more than 10 mm from 26th SMW is above 80%, and farmers can initiate their field preparation operations from 26th week and in subsequent weeks i.e., 27th (July 2-8) onwards probability of receiving more the 20 mm rainfall is more than 70%, which is ideal week for sowing of kharif crops in the region. The 30th and 31st SMW are also ideal time for the crop fertilization based upon the rainfall pattern and intensity. At Damoh, the expected amount of rainfall is 16 mm at 70% probability level during 25th SMW, sowing of kharif crops can be initiated for early duration crop varieties. Proper drainage network is essential for black soil dominant Damoh district as the expected amount of rainfall at 70% probability level is more than 60 mm during 30th to 33rd SMW. Long duration crop varieties can be taken at Damoh in comparison to Sagar as the rainy days are two week more at Damoh. Moreover, chances of taking double cropping are also more at Damoh by taking short duration crop varieties during kharif and early sowing of rabi crops.
Table 4. Expected weekly rainfall amount at different probability levels.
At both the location, rainfall in the range of 18.9 to 79.2 mm is expected from 26th to 37th week (June 18-September 16). Overall expected rainfall days are more than 84 at both the locations suggesting that medium duration varieties of various crops can be ideal in the region. However, at Damoh the expected amount of rainfall at 70% probability level was 16 mm during 25th ( June 18-24) SMW, suggesting that sowing can be done one week prior in comparison to Sagar. The intermittent rains of more than 20 mm rainfall was also expected at 70% level during 36th to 37th SMW, but thereafter probability of getting even 20 mm rainfall per week is not 70%, suggested that long duration varieties may be more suitable with supplemental irrigation.
The prevalent kharif season crops of the region include green gram, black gram, sorghum and maize depending upon the soil type. In view of the above studies, it is suggested that the kharif rainfed crops such as groundnut, black gram, green gram and sesamum should be sown during 27th SMW in both Sagar and Damoh region. The ideal combination of crops of the regions can be sorghum for the grain purpose intercropped with cowpea for the fodder purpose. Livestock integrated with the agricultural/food production systems is the cornerstone for rural economy of the farmers, therefore, the current suggested cropping systems integrating food-fodder system with rainfall probabilities may fetch an additional green fodder of 150 - 200 q·ha−1 to the farmers apart from the sorghum grain yield and improve their livelihood. Therefore, overall the current study reveals that past rainfall record analysis may be a handy tool for future rainfall probability projections, which alternatively can be of immense importance in the crop and other field operation planning in rainfed agricultural system as well as improving their livelihood.
5. Conclusion
The overall mean annual rainfall was 1233.8 mm with 32.6% variability for Sagar and 1225.1 mm with 30.3% variability for Damoh region. Mann-Kendall rank and spearman rank statistics revealed that there is a significant long-term decreasing trend in annual, kharif and rabi season rainfall at both locations. However, in the past 15 years (1996 to 2010), both regions exhibited significant decreasing trend in total amount of annual rainfall. Climate of both the regions has changed as in the recent 15 years annual rainfall has decreased by 156.4 and 310.7 mm at Sagar and Damoh from their long period average. Therefore, overall the current study reveals that past rainfall record analysis may be a handy tool for future rainfall probability projections, which alternatively can be of immense importance in the crop and other field operation planning in rainfed agricultural system as well as in improving their livelihood.
References
- Sharma, H.C., Chauhan, H.S. and Ram, S. (1979) Probability Analysis of Rainfall for Crop Planning. Journalof Agricultural Engineering, 16, 934.
- Kar, G. (2002) Rainfall Probability Analysis for Sustainable Production Strategies in Coastel Orissa. Journal of Agrometerology, 4, 181-185.
- Virmani, S.M. (1994) Climatic Resources Characterization in Stressed Tropical Environments: Constraints and Opportunities for Sustainable Agriculture. In: Virmani, S.M., Katyal, J.C., Swaran, H.E. and Abrol, I.P., Eds., Stressed Ecosystems and Sustainable Agriculture. Oxford and IBH Publishing Co. Pvt. Limited, New Delhi, 149-160.
- IPCC (2007) Climate Change 2007: The Physical Science Basis, Summary for Policymakers. Intergovernmental Panel on Climate Change.
- Cooper, P., Rao, K.P.C., Singh, P., Dimes, J., Traore, P.S., Rao, K., Dixit, P. and Twommlow, S.J. (2009) Farming with Current and Future Climatic Risk: Advancing a “Hypothesis of Hope” for Rainfed Agriculture in the Semiarid Tropics. Journal of SAT Agricultural Research, 7, 1-19.
- Watson, R., Zinyowera, M. and Moss, R. (1996) Climate Change 1995—Impacts, Adaptation and Mitigation of Climate Change. Contribution of Working Group II to the Second Assessment Report of the IPCC, Cambridge University Press, Cambridge.
- Fischer, G., Shah, M. and Velthuizen, H.V. (2002) Climate Change and Agricultural Vulnerability. International Institute for Applied Systems Analysis, Luxenberg.
- Parry, M.L., Rosenzeig, C., Iglesias, A., Livemore, M. and Fischer, G. (2004) Effects of Climate Change on Global Food Production under SRES Emissions and Socio-economic Scenarios. Global Environmental Change, 14, 53-67. http://dx.doi.org/10.1016/j.gloenvcha.2003.10.008
- Rosenzeig, C. and Parry, M.L. (1994) Potential Impacts of Climate Change on World Food Supply. Nature, 367, 133-138. http://dx.doi.org/10.1038/367133a0
- Aggarwal, P.K. (2008) Global Climate Change and Indian Agriculture: Impacts, Adaptation and Mitigation. Indian Journal of Agricultural Science, 78, 911-919.
- Rai, S.K., Behari, P., Satyapriya, A., Rai, K. and Agrawal, R.K. (2012) Long Term Trends in Rainfall and Its Probability for Crop Planning in Two Districts of Bundelkhand Region. Journal of Agro Meteorology, 14, 74-78.
- Blandford, H.F. (1886) Rainfall of India. Monsoon Monograph—India Meteorological Department, No. 3, 658.
- Parthasarathy, B. and Mooly, D.A. (1981) Hundered Years Karanataka Rainfall. R-30, Indian Institute of Tropical Meteorology, Technical Bulletien, No. 19, Pune, India.
- Dhar, O.N., Rakhecha, P.R. and Kulkarni, A.K. (1982) Trends and Fluctuations of Seasonal and Annual Rainfall of Tamilnadu. Proceedings of Indian Academic of Sciences (Earth and Planet Science), 91, 97-104.
- Sarkar, R.P. and Thapliyal, V. (1988) Climatic Change and Variability. Mausam, 39, 127-138.
- Lal, B., Duggal, Y.M. and Ram, P. (1992) Trends and Periodicities of Monsoon and Annual Rainfall of Districts of Haryana State and Delhi. Mausam, 43, 127-142.
- Singh, K.A., Sikka, A.K. and Rai, S.K. (2008) Rainfall Distribution Pattern and Its Implications for Crop Planning at Pusa in Bihar. Journal of Agrometeorology, 10, 198-203.
- Rai, S.K. and Singh, K.A. (2009) Rainfall Variability and Probability for Crop Planning at Madepura in Bihar. Journal of Agrometeorology, 11, 42-46.
- Deka, R.L. and Nath, K.K. (2000) Rainfall Analysis for Rainfed Crop Planning in the Upper Brahmaputra Valley Zone of Assam. Journal of Agrometeorology, 2, 47-53.
- Hundal, S.S. and Kaur, P. (2002) Annual and Seasonal Climatic Variability at Different Location of Punjab State. Journal of Agrometeorology, 4, 113-125.
- Ahmed, P., Deka, R.L., Baruah, B.P. and Nath, K.K. (2009) Rainfall Based Crop Planning in the Barak Valley Zone of Assam. Journal of Agrometeorology, 11, 192-195.
- Ravindrababu, B.T., Rajegowda, M.B., Janardhanagowda, N.A. and Girish, J. (2010) Weekly, Monthly and Seasonal Rainfall at Bengaluru in Karnataka. Journal of Agrometeorology, 12, 263-265.
- Panse, V.G. and Sukhatme, P.V. (1985) Statistical Methods for Agriculture Workers. ICAR, New Delhi, 14-33.
- WMO (1966) WMO Technical Note 79. WMO No. 195, TP-10, Geneva.
- Robertson, G.W. (1976) Dry and Wet Spells. UNDP/FAO, Ton Razak Agric. Res. Center, Tekam, Malaysia Project Field Report, Agrometeorological, A-6, Sungh, 15.
- Chow, V.T. (1964) Statistical and Probability Analysis of Hydrological Data. In: Chow, V.T., Ed., Hand Book of Applied Hydrology, McGraw Hill, New Yok, 81-97.
- Hingane, L.S., Rupakumar, K. and Ramanamurthy, B.V. (1985) Long-Term Trends of Surface Air Temperature in India. Journal of Climatolology, 5, 521-528.
http://dx.doi.org/10.1002/joc.3370050505 - Rupakumar, K. and Hingane, L.S. (1988) Long-Term Variations of Surface Air Temperatures at Major Industrial Cities of India. Climatic Change, 13, 287-307. http://dx.doi.org/10.1007/BF00139811
- Reddy, J. (1993) Agroclimatic/Agrometeorological Techniques: As Applicable to Dry-Land Agriculture in Developing Countries. Jeevan Charitable Trust, Secundarabad, 61.
NOTES

*Corresponding author.