Atmospheric and Climate Sciences
Vol.3 No.1(2013), Article ID:27559,10 pages DOI:10.4236/acs.2013.31005
Climate Change Associated with Global Teleconnections, Volcanic Eruptions, and the Arctic’s Snow-Ice Albedo in Godthab, Greenland
Department of Geography, University of Winnipeg, Winnipeg, Canada
Email: *J.binyamin@uwinnipeg.ca
Received September 20, 2012; revised October 22, 2012; accepted November 1, 2012
Keywords: Godthab (Greenland); Climate Modes; Teleconnections; Climate Change; Climate Variability; ENSO; NAO; AO; PNA
ABSTRACT
To study the impact of climate change on Godthab (Greenland), temperature and precipitation gathered from the Global Historical Climatology Network (GHCN) were analyzed for patterns within 1866-2011. Both temperature and precipitation have experienced an overall increase throughout the past 146 years. Precipitation, however, has experienced a declining trend since 1985. North Atlantic Oscillation (NAO) and Arctic Oscillation (AO) indices showed strong correlations with average annual temperature (R = −0.6) and smaller correlations with annual total precipitation (R = −0.2). There are moderate correlations between temperature, precipitation, and Southern-Oscillation Index (SOI). The positive phases of Pacific-North American (PNA) led to increased winter and spring precipitation. The climate mode’s influential strength on Godthab’s temperature and precipitation, vary seasonally. In contrast with global average temperatures, Greenland has not experienced a continual warming trend since the 1950s; 30- and 10-year trends show a cooling period between 1965 and 1995. From 1866 to 2011, Godthab’s average annual temperature has increased by 1.9˚C, and is anticipated to continue to warm in accordance with the global warming trend and the Arctic’s associated feedback mechanisms.
1. Introduction
Climate change, as defined by the Intergovernmental Panel on Climate Change (IPCC), is any change in the climate over time, whether due to natural variability or as a result of human activity [1]. The Arctic is viewed as an amplifier of climate change because of the feedback effects associated with its high albedo of snow and ice, low precipitation, and low temperatures. Not only is the Arctic’s climate change amplified, it also experiences an early-onset of climate change symptoms [2]. The observed climate changes experienced by Greenland, located in the high Arctic, will offer great insight into the extent of global warming thus far. The study is especially important because the effects of climate modes, volcanic eruptions, and human activities can have large impacts on Godthab’s annual and seasonal temperature and precipitation, which in turn can impact ice sheet extents and sea level rise. Greenland is 82 percent covered by ice; therefore, a long warming period could initiate significant melting and conclude with significant sea-level rise [3].
High latitude climates, like Godthab’s, experience long periods of continuous sunlight in the summer and a period of perpetual darkness in winter. High latitudes are very reflective due to the high albedo of their predominant ice and snow cover. By reflecting its limited solar radiation back into space, the land and water surfaces retain their cold temperatures. The ice-albedo feedback is the most significant positive feedback influencing polar regions, and is thought to have been the cause for the recent, large changes observed within the Arctic [2,4]. A slight increase in temperature within the Arctic can setoff a pattern of events leading to continual decrease in snow and sea-ice, and continual increase in temperature. By increasing the regional temperature, and melting snow and sea-ice, the ground’s albedo is decreased, and is better able to absorb solar radiation and further warm the Arctic climate.
Precipitation is greatly influenced by a region’s temperature because air at cold temperatures has a reduced water capacity; therefore, Polar Regions receive limited precipitation. Godthab’s limited precipitation exemplifies this high latitude relationship. The lowest global precipitation occurs within the plateau of Antarctica and in the central area of Greenland [2], which is proximal to Godthab.
Another determinant of climate change is aerosols. The Arctic is especially susceptible to the effects of aerosols in the atmosphere; mid-latitude aerosols are transported pole-ward from source regions. Aerosols from anthropogenic processes and volcanoes are the most influential on the climate. The two aerosols emitted by volcanoes that have greatest impact significance on Greenland are dust and gaseous sulphur (SO2). Sulphur from volcanoes, depending on the eruptive strength of a volcano, can inject their aerosols past the troposphere and into the stratosphere where they have a longer residence time, and can be dispersed further. The Volcanic Explosive Index (VEI) is used to quantify a volcano’s intensity between one and six. A mid-latitude volcano, with a high VEI, can cause significant cooling for years after an eruption. This cooling phenomenon is strongest in the winter season [5].
Section 2 describes the study site. Sections 3 and 4 outline the climatology for the two periods (1866-2011) and (1985-2011). Section 5, presents the climate modes and their effect on temperature and precipitation of Godthab. Section 6 finishes with discussion and conclusions.
2. Study Site
Godthab (locally known as Nuuk) is located within the subarctic along the west-coast of Greenland at 64˚20'39'' North (latitude), 51˚34' West (longitude), and an elevation of 70 m above sea-level. Godthab is the capital of Greenland. Based on its location proximal to the Icelandic low, the North Atlantic Oscillation (NAO) and Arctic Oscillation (AO) are anticipated to play a significant climatic role. Due to the high latitude of Godthab, all climate considerations must account for the seasonal fluctuation of insolation. Godthab is located within a subarctic to arctic climate; cool summers and cold winters.
3. Climatology (1866-2011)
3.1. Temperature
The annual average temperature of Godthab has increased by 1.9˚C and had a mean temperature of −1.3˚C over the past 146 years, from 1866 to 2011 (Figure 1). It shows a moderate temperature trend with a correlation coefficient of 0.3. After a large volcanic eruption, such as in 1883, 1912, 1980, and 1991, Godthab continually experienced a cooling period that lasted up to three years. The greatest cooling periods occurred in the early 1880s, early 1980s, and early 1990s, after either a single volcano
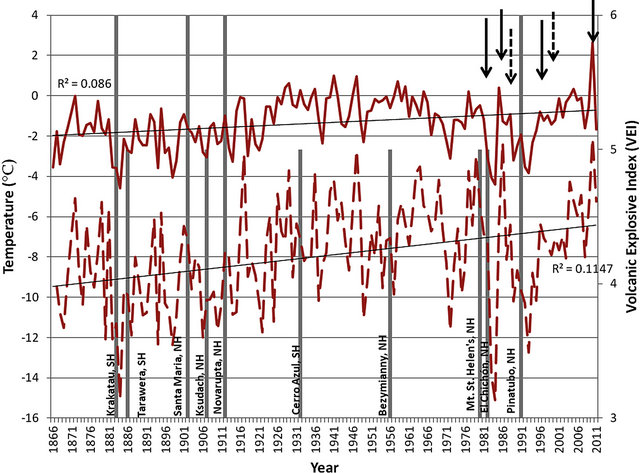
Figure 1. Annual average (solid line) and average winter (dotted line) temperatures from 1866-2011, with notes of significant volcanic eruptions (over VEI 5), and arrows noting years of big ENSO events. Solid arrows are El Niño events (1982/83, 1986/87, 1997/98, and 2010), and the dashed arrows are La Niña events (1988/89 and 1998/99). The effects of volcanic eruptions, reducing the temperature in subsequent years, can be clearly seen; 1883’s Krakatau (Indonesia), 1886’s Mount Tarawera (New Zealand), 1902’s Santa Maria (Guatemala), 1907’s Ksudach (Russia), 1912’s Novarupta (Alaska, US), 1932’s Cerro Azul (Chile), 1956’s Bezymianny (Russia), 1980’s Mount St. Helen’s (Washington, US), 1982’s El Chichón (Mexico), and 1991’s Pinatubo (Philippines).
with a VEI of 6, or multiple volcanoes with a VEI of 5+ (Figure 1). The annual temperature range was 29.6˚C during the 146 years, with the maximum temperature in 1936 (9.8˚C) and minimum temperature in 1984 (−19.6˚C). Interestingly, in contrast with the trends of many North American cities, Godthab has not experienced most of their significant warming recently; in fact, the majority of their warmest years are prior to 1986 (Figure 1). The only exception was 2010, with an average annual temperature of 2.6˚C, earning the year a position as the hottest annual average on record, and also as one of the top three hottest years for all seasons (Table 1). Two large warming periods occurred since 1866, they were 1919- 1937 and 1993-2010. Both warming periods coincide with periods of large (VEC = 6) volcanic eruption absence [5,6].
Figure 2 shows the temperature fluctuations experienced in Godthab for the 10-year averages. Unlike many northern hemisphere cities that have experienced a steady temperature increase in the past century, Godthab’s climate experienced a drop in temperature between 1966 and 1995. The declining period, and the significantly lower temperatures from the mid-1980s until the mid1990s are illustrated in Figures 1 and 2. Further research was required into climate modes to determine the reasoning for this temperature anomaly.
3.2. Precipitation
The annual total precipitation has increased by 109 mm and has a mean annual of 605 mm throughout the 138 year period from 1874 until 2011 (Figure 3). It shows a small precipitation trend with a correlation coefficient of 0.2. Godthab have experienced an annual precipitation range of 908 mm, with the minimum precipitation in 1948 (238 mm) and maximum precipitation in 1983 (1146 mm).
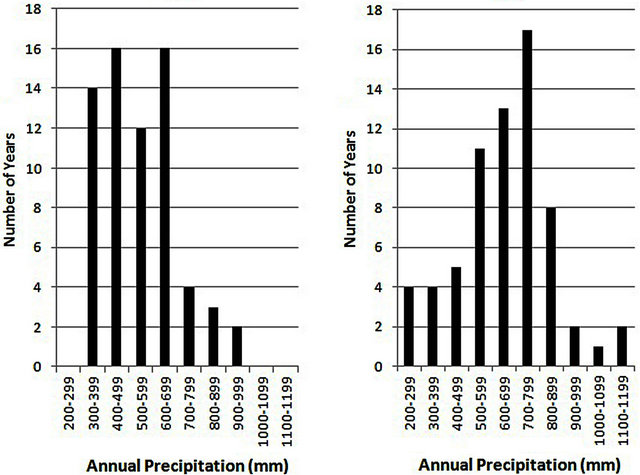
The seasonal precipitation observed in Figure 4 notes a strong coupling between the precipitation of winter and spring, and the precipitation of summer and autumn. Winter and spring’s seasonal precipitation is increasing at a greater rate than summer and autumn with correlation coefficient of 0.4 and 0.1, respectively. Figure 5 provides a clear display of the increasing frequency of more extreme rainfall events in the past 70 years (1945- 2011). During 17 of the 70 years Godthab experienced larger rainfall amounts (700 - 799 mm). The temperature
Table 1. Ranking the coldest and warmest years for Godthab, Greenland (1900-2011).
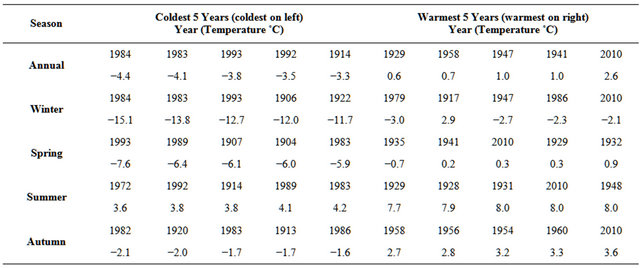
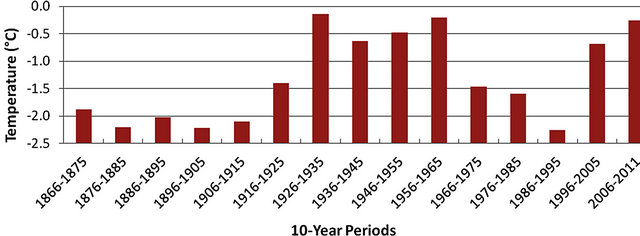
Figure 2. 10-year average temperatures at Godthab, Greenland (1866-2011).
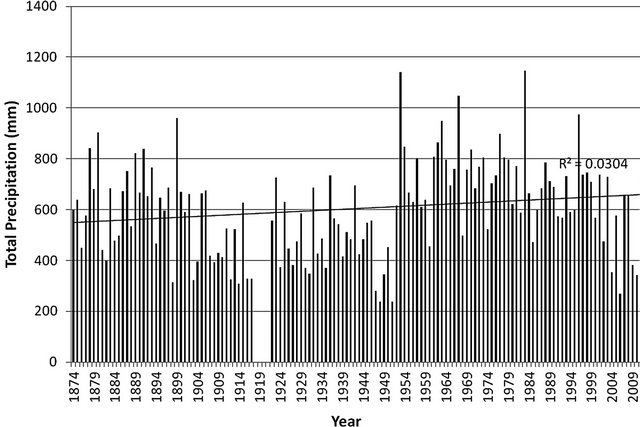
Figure 3. Total annual precipitation in Godthab, Greenland (1874-2011). Data are incomplete for 1918, 1919, 1920, and 1921, therefore, these years are omitted.
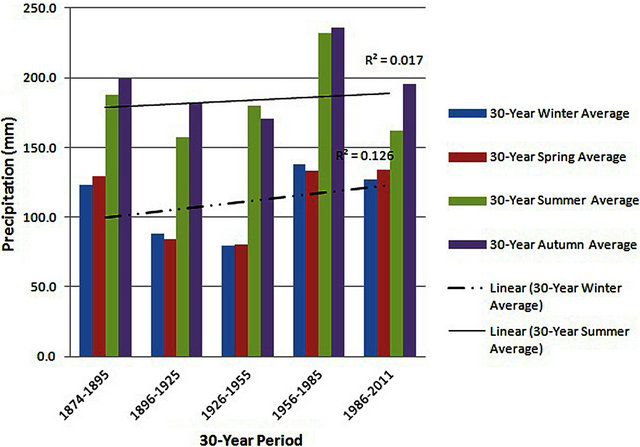
Figure 4. 30-year average total seasonal precipitation within Godthab, Greenland (1874-2011). Data are incomplete for 1918, 1919, 1920, and 1921, therefore, these years are omitted.
averages over the 10-year period has been increasing at a greater rate than precipitation with a correlation coefficient of 0.5 and 0.2, respectively (Figure 6). Temperature and precipitation share an inverse correlation of −0.2; when temperature increases the precipitation tends to decrease, and vice versa.
4. Climatology (1985-2011)
4.1. Temperature and Precipitation
Figure 6 also shows that during the most recent 30 years, the temperature has increased, and precipitation has decreased significantly. Although this follows their inverse relationship appropriately, it is a concerning trend (Figure 7). Temperature and precipitation’s inverse relationship has increased within the past 25 years to a correlation coefficient of −0.7 (1985-2011), compared to −0.2 (1866-2011). The linear rate of incline has increased to a correlation coefficient of 0.5 for the temperature and −0.3 for the precipitation. The annual temperature increase was also evident within each season. From 1985 until 2011 the seasonal temperatures have increased at a greater rate than the annual average. The summer season has had the greatest increase, from a correlation coefficient of 0.1 (1866-2001) to 0.6 (1985-2011).
By continuing Figure 7’s trendline, it is clear that if this
 (a) (b)
Figure 5. Comparison between the distributions of annual rainfall events within Godthab, Greenland: (a) first 70 years (1874-1944); and (b) most recent 70 years (1945-2011). Data are incomplete for 1918, 1919, 1920, and 1921, therefore, these years are omitted.
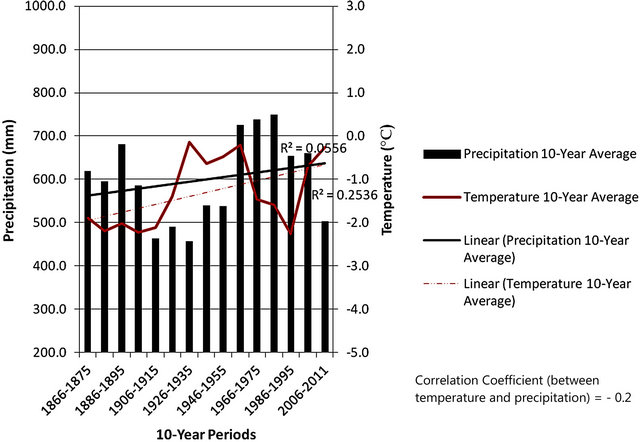
Figure 6. Comparison of 10-year average annual precipitation and temperature for Godthab, Greenland (1866-2011). Linear lines represent the linear trend of temperature (red) and precipitation (black).
pattern continues for the next 90 years, by the year 2100 the temperature will have soared to above 6˚C and the precipitation will have declined to below 0 mm (Figure 8). Due to the effect of the positive ice-albedo feedback processes and the large increase in global temperature experienced over the past 50 years [1], this pattern is a valid concern.
4.2. Rate of Ice Sheet Melt
Greenland’s temperature has great influence over the formation and melting of ice sheets. The IPCC [1] reported that the Greenland ice sheet’s rate of contribution to sea level rise has increased from 0.05 ± 0.12 (1961- 2003) to 0.21 ± 0.07 (1993-2003) millimeters (mm) per
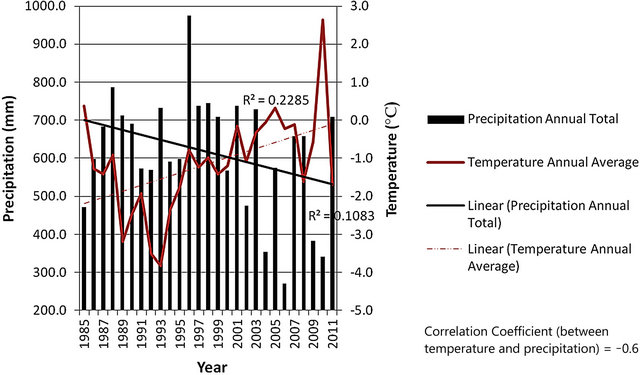
Figure 7. Comparison of 10-year average annual precipitation and temperature for Godthab, Greenland (1985-2011). Linear lines represent the linear trend of temperature (red) and precipitation (black).
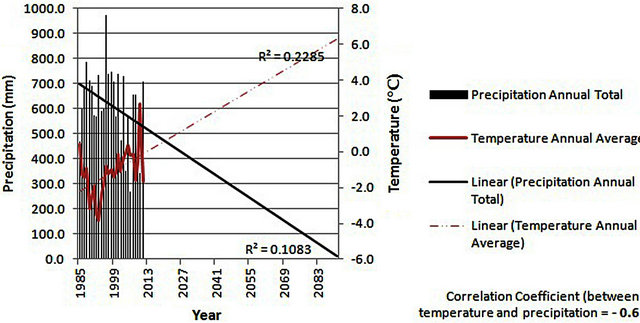
Figure 8. Prediction of 10-year average annual precipitation and temperature comparison for Godthab, Greenland (1985- 2100). Linear lines represent the linear trend of temperature (red) and precipitation (black). Linear trendline forecast extended 90 years from Figure 7.
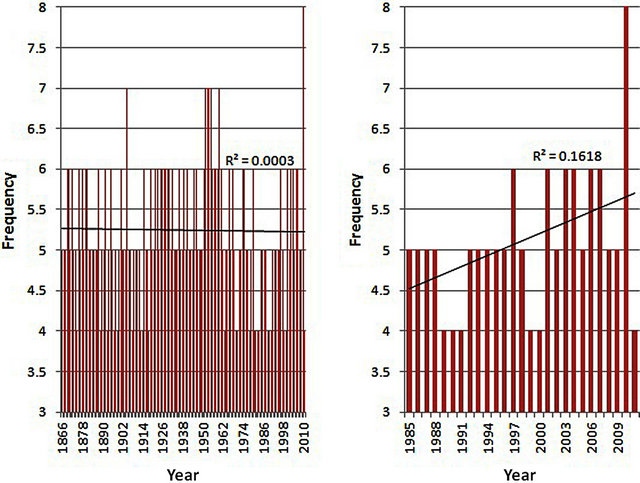
year. This increase corresponds with the increase in the frequency of months per year with temperatures over 0˚C (Figure 9). From 1866 until 2011, the frequency of months over 0˚C, remained fairly constant at just above 5 months per year (Figure 9(a)). As of 1985, when the overall temperature trend appears to increase, the frequency started to increase as well (Figure 9(b)). 2010 was an extremely warm year, and Godthab experienced 8 months with temperatures over 0˚C.
If the average number of months per year with temperatures above freezing increases, then the annual ice formation will start later in the year, and will begin to melt earlier. As well, the sea ice extent will begin to decrease as the positive ice-albedo feedback mechanism warms the arctic. A dramatic sea level rise is anticipated if the global ice sheets, glaciers, and ice caps begin to melt due to climate change. The National Snow and Ice Data Center [7] reveals the declining arctic sea ice extent from 1979 to 2012, and shows that the average monthly arctic sea ice extent decreased by 3% per decade. These finding are consistent with the findings of this paper.
5. Climate Modes
5.1. North Atlantic Oscillation (NAO)
The NAO measures the “strength of the Icelandic low and the Azores [Bermuda] high, and the westerly winds between them, mainly in winter” [1]. Since 1821, NAO index is ranged from +6.7 to −6.1 and the annual average NAO is 0.11, which is slightly positive, but near neutral. NAO indices were obtained from Jones [8]. NAO in positive phase produced cold temperatures, and in negative phase caused mild temperatures (Figure 10). The NAO cycle is approximately 30 years long, and this is confirmed by the three NAO phases since 1890. Between 1884 and 1928 NAO was in a positive phase, between 1929 and 1968 NAO was in a negative phase, and between 1969 and 1995 NAO was in another positive phase.
 (a) (b)
Figure 9. Comparison between the frequencies of months per year with temperatures over 0˚C within Godthab, Greenland: (a) full data duration (1866-2011); and (b) most recent 26 years (1985-2011).
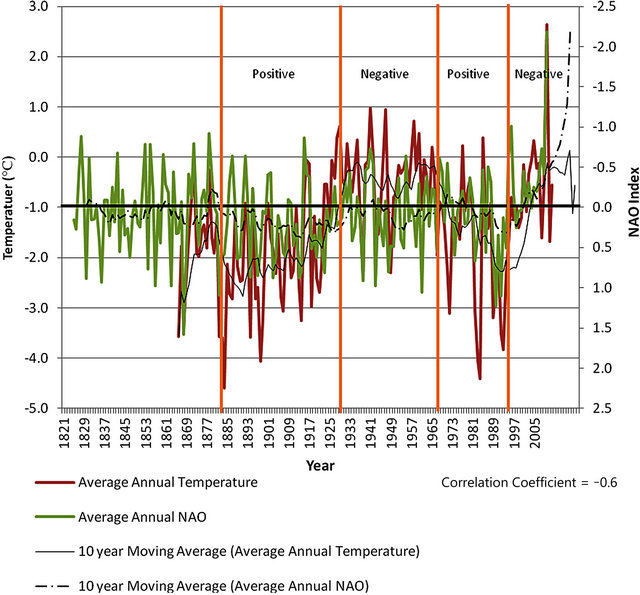
Figure 10. Average annual temperature and North Atlantic Oscillation (NAO) index data for Godthab, Greenland (1821- 2011). NAO periods were distinguished: positive NAO 1884-1928, negative NAO 1929-1968, positive NAO 1969-1995, and negative NAO 1996-2011. Data are incomplete for 1821 1822, 1823, 1824, and 2011, therefore, these years are omitted.
Since 1996, we have been in another negative phase. During both NAO negative phases, Godthab experienced its greatest warming periods. The correlation between Godthab’s temperatures and NAO index is a strong inverse relationship of −0.6 which means during the positive phase the temperature was much colder than normal and the opposite during the negative phase. The impact of NAO phase is most evident during the winter season. Average winter temperature and NAO indices have a correlation coefficient of −0.7, and average winter precipitation and NAO have a correlation coefficient of −0.2. The positive phase of NAO produced drier conditions and the negative phase formed slightly more moisture than normal.
5.2. Arctic Oscillation (AO)
AO index is a measure of the pressure changes between polar lows and central Atlantic highs. Since 1950, AO has ranged from +3.5 to −4.3 and the annual average is −0.14, which is slightly negative, but near neutral. AO index data were retrieved from the National Weather Service Climate Prediction Center (NWSCPC) [9]. NAO and AO showed similar climate patterns during the positive and negative phases with a strong correlation coefficient between annual temperature and AO (−0.6).Winter AO index and total winter precipitation share a correlation coefficient of −0.2 (figure not shown). Due to the strong coupling of NAO and AO, Greenland is increasingly susceptible to large scale climate changes, because both climate modes occur in unison, and can therefore intensify their effects. This is evident within the cooling phenomenon between 1986 and 1995, when both NAO and AO were within large positive phases.
5.3. Pacific-North American (PNA)
PNA index is a measure of the average standardized monthly 700 mb flow pattern over the eastern Pacific and North America between the Aleutian Islands, the southwestern Canadian Rockies, and the southeastern US Gulf Coast [1]. Since 1950, PNA has ranged from +2.7 to −3.1 and the annual average PNA is 0.04, which is slightly positive, but incredibly close to neutral. PNA data were retrieved from NWSCPC [10]. The data showed a moderate correlation between the average annual PNA index and Godthab’s climate. The influence of the PNA is most evident within Godthab’s winter and spring precipitation. The winter PNA has a correlation coefficient of 0.3 with Godthab’s spring precipitation, and 0.2 with winter precipitation (figure not shown). In accordance with this data, when the PNA index is positive during the winter, Godthab is moderately inclined to have increased precipitation within the winter and spring of that year.
5.4. El Niño-Southern Oscillation (ENSO)
ENSO is a global-scale climate mode that involves a strong relationship between the Pacific Ocean and the atmosphere. ENSO is measured by calculating the Southern Oscillation Index (SOI) using the difference in sealevel pressure (SLP) between Tahiti and Darwin, Australia. There are three phases to ENSO: El Niño (negative phase), neutral phase, and La Niña (positive phase). The changes in SLP play a vital role in temperature, precipitation, strength of easterly trade winds, cyclone formation, ocean level, thermocline level, and oceanic upwelling. Since 1866, SOI has ranged from +4.1 to −10 and the annual average SOI is −0.13, which is slightly negative, but close to neutral. SOI data were obtained from the University of East Anglia [11].
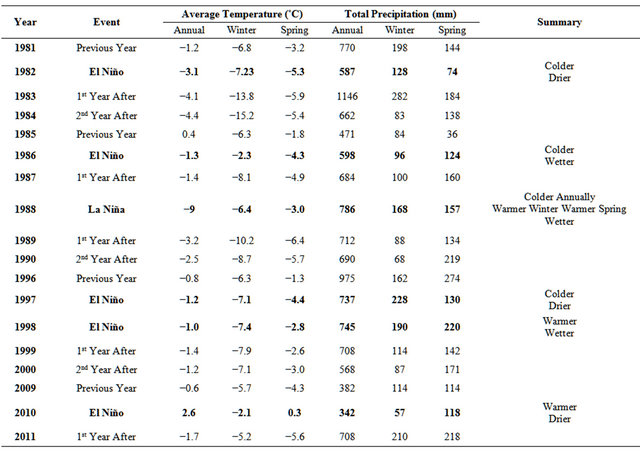
Despite the distance from Godthab, the ENSO interaction between Tahiti and Darwin plays a role on its climate. From 1866-2011 the correlation coefficient between average annual SOI and temperature, and SOI and precipitation, were −0.2 and 0.1, respectively. However, from 1985-2011 the strength of correlation between temperature, precipitation and SOI has increased and became positive with values 0.5 and 0.4, respectively. Table 2 shows the effect of ENSO on average annual and seasonal temperatures, and total annual and seasonal precipitation in Godthab. The winter and spring seasons are the only two seasons noted, because it is between the months of January and April when ENSO is most important. Using Table 2, and the recent strong, positive correlation between SOI and Godthab’s climate, the following generalizations were made: during a strong negative year, El Niño produced a colder and slightly drier climate, and during a strong positive year, La Niña produced a warmer and slightly wetter climate. Following an El Niño event in 1982/83, the region experienced colder than normal winter temperatures in 1983 and 1984, the 1st and 2nd coldest winter temperatures on record. Northern hemispheric volcanic activity in 1980 and 1982 also contributed to these unusually low winter temperatures. Following a major La Niña event (1988/89), the region experienced an unusually cold spring in 1989 and 1990, 2nd and 8th coldest spring temperatures on record, respectively.
6. Discussion and Conclusions
Godthab’s climate is based on climate modes, volcanic activity, anthropogenic activity facilitating climate change, and the magnification of these events in a region vulnerable to ice-albedo feedback mechanisms. Due to the number of variables and their complex relationships, the predictability of Godthab’s climate is complex. Throughout the course of this study we analyzed NAO, AO, PNA, ENSO, Pacific Decadal Oscillation (PDO), and Antarctic
Table 2. The effect of ENSO on average annual and seasonal temperatures, and total annual and seasonal precipitation in Godthab, Greenland (1981-2011).
Oscillation (AAO); both PDO and AAO were deemed insignificant (<0.05 correlation coefficient) based on climate analysis, and therefore were not included in this report. It is clear that NAO and AO are strongly coupled with temperature and precipitation, specifically its winter temperatures. The positive phase of NAO and AO produced colder temperatures (correlation coefficient of −0.6) and drier conditions (average winter precipitation and NAO have a correlation coefficient of −0.2). In comparison, the negative phase of NAO and AO created mild temperatures and slightly more precipitation than normal. SOI had a moderate influence on Godthab’s climate. During El Niño events (negative SOI values), the winter and spring seasons became colder and slightly drier than normal years, and during La Niña (positive SOI values), the winter and spring seasons were warmer and slightly wetter than normal years. During 1866-2011 the correlation coefficient between average annual SOI and temperature, and SOI and precipitation, were −0.2 and 0.1, respectively. However, during 1985-2011 the strength of correlation between temperature, precipitation and SOI increased and became positive with values 0.5 and 0.4, respectively. The variables influencing temperature also influence precipitation, because Godthab’s temperature is strongly and inversely coupled with its precipitation (especially in the latest 25 years). PNA and winter precipitation are also coupled; during the positive phase of PNA, the precipitation increased within the winter and spring of that year. The winter PNA had a correlation coefficient of 0.3 with Godthab’s spring precipitation, and 0.2 with winter precipitation.
Many of the large temperature change events can be explained with a combination of climate mode events and volcanic activity. For example, the short cooling period from 1983 to 1984 was consequential of an El Niño period and the two northern hemisphere volcanic eruptions in 1980 and 1982, and the large cooling from 1986 to 1995 was resultant of the coupling of very large NAO and AO positive phases.
Although short-term variability should be limited when assessing the correlation between climate modes and Godthab’s climate, there is conclusive evidence within the NAO, AO, and SOI, that great changes have occurred in their linkages since 1985. NAO, AO, and SOI have increased their correlation with temperature and precipitation. Whether this is associated with anthropogenic forcing, or an associated phenomenon of the Arctic’s early magnification of climate change, remains unknown. The decreasing ice-albedo, due to increased ice-sheet melt and late summer open water area, has the potential to impact larger northern hemisphere atmospheric and oceanic circulation. Therefore, as climate change causes further warming in Greenland, the entire northern hemisphere’s teleconnection relationships may be altered in consequence. Future research should focus on the dynamics of climate change effects on ice sheet extent and sea level rise due to climatic feedbacks.
REFERENCES
- IPCC, “Climate Change 2007: The Physical Science Basis,” WGI Fourth Assessment Report, Intergovernmental Panel on Climate Change (IPCC), Geneva, 2007.
- J. E. Overland and M. Wang, “Large-Scale Atmospheric Circulation Changes Are Associated with the Recent Loss of Arctic Sea Ice,” Tellus, Vol. 62A, No. 1, 2010, pp. 1-9.
- J. E. Box, “Survey of Greenland Instrumental Temperature Records: 1873-2001,” International Journal of Climatology, Vol. 22, No. 15, 2002, pp.1829-1847. doi:10.1002/joc.852
- J. Turner and G. J. Marshall, “Climate Change in the Polar Regions,” Cambridge University Press, New York, Cambridge, 2001.
- J. E. Box, L. Yang, D. H. Bromwich and L. Bai, “Greenland Ice Sheet Surface Air Temperature Variability: 1840- 2007,” Journal of Climate, Vol. 22, No. 14, 2008, pp. 4029-4049. doi:10.1175/2009JCLI2816.1
- K. R. Briffa, P. D. Jones, F. H. Schweingruber and T. J. Osborn, “Influence of Volcanic Eruptions on Northern Hemisphere Summer Temperature over the Past 600 Years,” Letters to Nature, Vol. 393, No. 6684, 1996, pp. 450-455. doi:10.1038/30943
- National Snow and Ice Data Center (NSIDC), 2012. http://nsidc.org/arcticseaicenews/files/2012/03/Figure3.png.Retrieved March 8th, 2012.
- P. Jones, “Monthly NAO Index,” 2012. http://www.cru.uea.ac.uk/~timo/datapages/naoi.htm
- National Weather Service—Climate Prediction Center, “Monthly AO Index,” NOAA, 2012. http://www.cpc.ncep.noaa.gov/products/precip/CWlink/daily_ao_index/monthly.ao.in dex.b50.current.ascii.table
- National Weather Service—Climate Prediction Center, “Monthly PNA Index,” NOAA, 2012. http://www.cpc.ncep.noaa.gov/products/precip/CWlink/pna/norm.pna.monthly.b5001.current.ascii.table
- University of East Anglia, “Monthly SOI,” Climatic Research Unity of University of East Anglia, 2012. http://www.cru.uea.ac.uk/cru/data/soi/soi.dat
NOTES
*Corresponding author.