Atmospheric and Climate Sciences
Vol. 2 No. 1 (2012) , Article ID: 17125 , 9 pages DOI:10.4236/acs.2012.21005
Projected Future Wind Speed and Wind Power Density Trends over the Western US High Plains
1Department of Geography and Environmental Sustainability, University of Oklahoma, Norman, USA
2Oklahoma Wind Power Initiative, University of Oklahoma, Norman, USA
3School of Meteorology, University of Oklahoma, Norman, USA
4Department of Geography, Oklahoma State University, Stillwater, USA
Email: jgreene@ou.edu
Received August 8, 2011; revised October 2, 2011; accepted November 1, 2011
Keywords: Wind Climatology; Renewable Energy; Climatic Variability
ABSTRACT
This manuscript presents the results of research on future changes in wind speed and wind power density across the western US High Plains in an area known for its high wind energy resources. Many current policies and economic analyses involving the rapidly expanding wind energy industry have assumed a constant or near constant wind resource. However, any future change in wind speeds will result in changes in the reliability of wind power as an energy resource. This paper uses current data (1970-2000) and future model output (2040-2070) to analyze decadal and seasonal changes in wind speed across the study area. In addition, estimated hub height wind power densities have been analyzed. Results show projections of a slight overall decreasing wind power in the future across the region. The greatest magnitude changes are estimated to be in the seasonal trends with the most substantial decreases occurring in winter and spring. As climate changes and warms overall, there will be shifts in the temperature gradients and the synoptic storm tracks that drive wind speeds. Thus, it is theorized that the wind speeds will be the result of an earlier transition to, and longer duration of, a calmer summertime pattern. This longer duration of a summertime pattern will lead to the decreased wind speeds and lower wind power output identified in this research. This decrease needs to be factored in for any estimates of the long-term costs and benefits of wind farms in the area.
1. Introduction
With the growing need for different forms of energy outside of fossil fuels, it must be recognized that renewable energy resources will be more commonly used in the future. Unlike fossil fuels, however, renewable energy is closely affected by current environmental conditions. Solar energy, for example, is affected by the amount of sunlight or cloud cover in an area. Wind energy, of course, is susceptible to variations in wind speed. Wind statistics such as mean wind speed and gustiness are affected on a wide range of time scales. This can pose a problem for decision makers on the siting of new wind farms, as well as pose challenges to utility wind power users. Many wind power simulations and projections, such as the US Department of Energy’s 20% wind power plan by 2030, assume a constant or near constant wind resource in the future [1]. However, as this paper shows, wind velocities vary, and will continue to vary and change in the future.
This paper examines potential changes in wind velocities that could affect the wind power industry by comparing projected wind speed patterns from 2040-2070 and comparing them to historical data from 1970-2000. It is hypothesized that wind speeds will experience change in the future. This is because near surface wind speeds are linked to the location of temperature gradients, which will change as the planet warms. This paper examines these changes across the western high plains of the United States in an area known to be a prime location for wind farms. The effect of any wind speed changes in the amount of potential power generated by wind turbines is also investigated. Any change in near surface wind speed will cause an even greater change in wind power potential as the energy created by a turbine is proportional to the cube of the wind speed.
2. Background
Several recent studies have examined the impact of estimated future change in wind speeds (below is a brief summary-see [2-4] for detailed reviews). For exampleSailor et al. [5] researched potential climate change impacts on the wind energy industry for the Pacific Northwest. They found little to no consensus with respect to monthly wind speed changes between four General Circulation Models (GCM) models. However, there was agreement from all four of the GCM models that wind speeds will decrease throughout the year. This is especially true for the summer, where they found a 40% decrease on average in the wind power output throughout the region.
Breslow and Sailor [6] also examined potential changes across the US. They suggest that the majority of the U.S. will experience 1.4% to 4.5% decreases in wind speeds over the next 100 years. As with Sailor et al. [5], there was some inconsistency in the models examined. For example, for summer and fall, the Canadian Climate Center model suggested up to a 1 m/s or 15% decrease in wind speeds by the year 2075. This 15% wind speed decrease would have a potential reduction of 30% to 40% in the wind power output. However, the UK Hadley model showed no large or consistent change in the areas studied in the paper.
Other studies have attempted to use nested downscaling methods of determining future wind climate. Segal et al. [7] used a regional climate model (RegCM2) that had a horizontal grid resolution of 52 km nested within a UK Hadley GCM model. The results showed most of the country will experience some wind power seasonal decreases on the average of 10% - 20%. The most notable decrease occurred during summer along the costal areas of California with decreases around 30%. Other areas with significant areas of projected decreased wind power density included the north central United States. Many locations across the southern plains were found to have no significant changes. Only isolated areas of small increases were found across the northwest and far southern United States [7].
Across many locations across the United States, the overall yearly production of wind power occurs in just a few months of the year [2]. Many studies have looked at seasonal wind speed variability by looking at different large scale circulation patterns such as the positive and negative phases of the El Nino/Southern Oscillation Index [8,9], while others have researched more mesoscale patterns such as the low level jet during the spring months across the central plains states [10]. Across a large portion of the US, including the central plains states, wind power is at its peak during winter due to stronger pressure gradients associated with powerful weather systems and the changing location of the jet stream. The areas with the greatest increase in winter wind speeds are across the northern plains and midwest and throughout the northeast. In summer, the wind is mainly driven by smaller or mesoscale process such as topography or a nocturnal low level jet.
Any major shift in typical synoptic weather patterns will affect the wind industry. The majority of the studies discussed above project a slight decrease in wind speeds. However, there remain many uncertainties, such as low model resolution, model disagreement, and changing climate modeling technology. Under a warmer climate it is hypothesized that there will be a shift in wind speed patterns as winds are strongest where a large thermal gradient exists. With continued warming, the thermal gradient may shift further poleward, thus influencing the location and magnitude of wind speeds across the US Great Plains.
3. Data and Methodology
This paper examines the potential change in near surface wind speed and wind power densities across an area of the Central High Plains of the United States. The area of study is located in a region that is known to have some of the highest wind energy potential in the country. The area includes eastern Colorado, western Kansas, and western Nebraska. For this investigation, two sets of data from the North American Regional Climate Change Assessment Program (NARCCAP) will be used [11]. One set of data simulates past climate from 1970 through 2000. The other dataset predicts future climate from 2040 through 2070 based on the International Panel on Climate Change (IPCC) emissions Scenario A2 [12]. NARCCAP data is useful as it simulates climate at high resolutions needed for regional climate studies. NARCCAP looks to solve the uncertainties of regional scale future climate projections and produce higher resolution climate data than is currently available. The higher resolution modes are created by using regional climate models that are nested within the large-scale general circulation models forced with the A2 emission scenario [13]. Output from NARCCAP is climate data at 50 km grid resolution and three-hour temporal resolution across the study area (Figure 1). Each grid point represents the center latitude and longitude of the grid box.
As is the case with most wind speed datasets, the NARCCAP data do not exhibit a normal distribution and are right skewed. For this reason, the median is the better measure of central tendency and will be used to identify and describe any changes instead of the mean. Once all the medians were calculated for each set of data (monthly, seasonal, etc.) the percent change equation was used to determine the direction (negative or positive) of the trend as well as magnitude. The percent change equation is shown in Equation (1):
 (1)
(1)
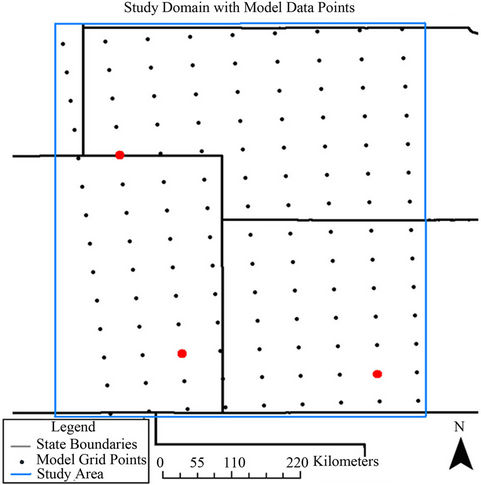
Figure 1. Study domain with the NARCCAP grid points.
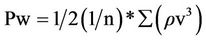
One focus of this paper is how a changing wind climate may affect the wind power industry. A certain change in the wind speed does not necessarily illustrate how much change there may be in wind power. Much of the previous research thusfar has examined changes or trends in wind speed. Turning these trends into values that will have meaning to utility companies and policy makers is important. Thus, wind power density analysis, in addition to wind speed, will be shown. The wind power density equation is a useful way to evaluate a wind resource at a given site. Wind power density is measured in watts per square meter and is calculated using the following equation [14]:
 (2)
(2)
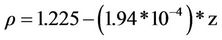
where Pw is in watts per square meter, is the power of the wind, v is the wind speed, while ρ is the density of air, and n is the number of observations in the dataset. Density of air is a function of elevation. Using the common sea surface air density of 1.225 kg/m3 is not appropriate for this study as most of the area is well above sea level. An average elevation of 900m was chosen for the entire study area. Using the equation [14]:
 (3)
(3)
the density of the air for the region will be an estimated 1.118 kg/m3, slightly lower than at sea level, which will decrease the overall the wind power density.
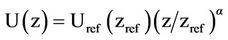
For a better understanding in trends in the amount of power output, the NARCCAP data must be vertically extrapolated to hub height. The NARCCAP wind speed data is at 10 meters. This paper assumes hub height to be at 80 meters, typical of large utility wind farms. The power law will be used for this extrapolation [15]:
 (4)
(4)
where α is the power law index, and its value is based on the roughness of the surrounding terrain [16]. As the only available data is at one height (10 m) this project will use the “1/7 power law” where α will be estimated to be 1/7 [17], Uref is the reference wind speed at 10 meters (zref), and z is the desired height of 80 meters. It should be noted that this is an estimate, and there have been observed values of α measuring 0.15 to 0.25, which are higher than the 1/7 power law, at thirteen tall towers across the plains states [18]. With this in mind, this height extrapolation from 10 meters to 80 meters may be a slight underestimate for the study area, but will still give a good idea of the trends across the area. After extrapolating the NARCCAP data to 80 meter hub heights, wind power densities (Equation (2)) are calculated for the grid points and changes are analyzed. Three different model grid points were chosen for further analysis as they were relatively close to large utility wind farms currently in use. These points are shown in Figure 1. The three points are the following: 1) located 10 miles north of the Colorado Green wind farm, which is 10 miles south of Lamar, CO which has a 162 MW capacity, 2) a data point located 4 miles north of Logan/Peetz Table wind farm that has a 174 MW capacity and approximately 10 miles northeast of Peetz Table and Spring Canyon, which has a combined 700 MW of capacity, and 3) a data point in southwest Kansas near the Gray County wind farm with a 112 MW capacity.
4. Results and Discussion
This section investigates the projected difference in 10 meter wind speed and wind power densities for the NARCCAP time slice from the 2040-2070 compared to the data from 1970-2000. Any changes during this timeframe will be very important as there will likely be a much greater reliance on wind energy for electricity production in the future [1].
4.1. 1970-2000 to 2040-2070 Comparison
Analysis was first performed to compare the historic and future NARCCAP datasets. Figure 2 shows the percent change in median wind speed between the two datasets. There was little change in 10 meter wind speeds across the study area; however, there was a southeast to northwest gradient in the direction of the change in median wind speed. The majority of the region saw increases or decreases of less than 1% in median wind speed between the two time periods. Areas across south central Kansas are predicted to have 2% to 3% increases, while areas across central Colorado are predicted to have 1% to 2% decreases.
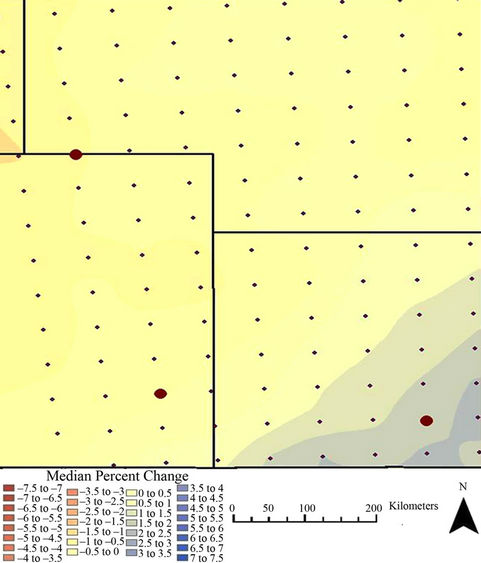
Figure 2. 1970-2000 to 2040-2070 percent change in 10 meter wind speeds.
The seasonal difference between the two datasets are seen in Figure 3, and quantified for the three wind farms described above in Table 1. During winter, the entire region will see a decrease of at least 3% and these decreases became greater further west with decreases of nearly 5% closer to the front range of the Rocky Mountains. During summer across the southeastern portion of the study area 4% to 5% increases are projected. During summer wind speeds are typically much weaker than other seasons so this percent increase may seem significant; however, when looking at wind power production it is not. Smaller changes were noted during spring and fall.
The overall changes become more apparent when looking at wind power density between the two timeslices (Figure 4). Wind power density at 80 meter was computed using the equations described above. Wind power density changes vary from 6 to 7 percent decreases in the far northwest portion of the study area to a 5 to 6 percent increase across the southeast portions of the region. Explanations for these decreasing values with further westward extent could be delayed development of storm systems due to baroclinic zones setting up further east. Another possibility is less winter precipitation or snowpack over the Rocky Mountains and southwest United States. With jet stream patterns developing due to temperature gradients, and with mountain snowpack playing a big role in these temperature gradients, more ridging could be possible across the western portion of the study area in the future [19]. The increases in the southeast portion

Figure 3. Seasonal change in median wind speed between 1970-2000 and 2040-2070.

Table 1. Percent change in overall and seasonal median wind speeds between past and future datasets at three studied wind farms.
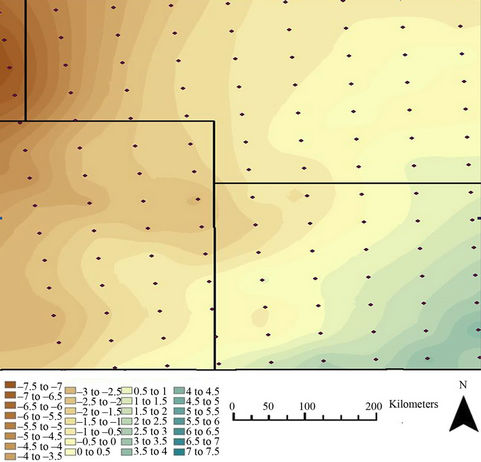
Figure 4. 1970-2000 to 2040-2070 percent change in wind power density.
of the study area were mainly found during summer. This could possibly be due to an earlier transition to a fall weather pattern with more storm systems developing across the central plains later in the summer in the future.
Table 2 shows a comparison of the two datasets in terms of the monthly percent change for each month from the first decade from each dataset (e.g., the 1970s and 2040s) to the last (e.g., the 1990s and 2060s) for the Gray County, Kansas wind farm. It can be seen that there are slightly less positive values in the future (2040-2070) dataset than the past as in the future dataset only 8.3% of the months show a 10% to 20% positive changes and only 2.1% are in the 20% to 30% range compared to 17.1% and 4.5% in the past dataset. Both datasets have similar amounts for negative outliers. There are slightly more negative months in the future dataset as well, as the past had 46.4% of the months having a negative trend compared to 60.3% of the months seeing negative trends in the future dataset.
4.2. Wind Speed Trends from 2040-2070
It can also be useful to examine the variability within the future dataset itself to see if there will be any notable or significant projected variability in the future. The most notable overall trends in 10 meter wind speed from 2040-2070 in the NARCCAP future scenario data occur over eastern Colorado and southwest Kansas. Figure 5 shows the percent change in median wind speeds from the 2040s to the 2060s, with decreasing median wind speeds ranging from 0.5% to 2.5%, across a large portion of the study area. Table 3 shows the median wind speed for each of the three future decades for the locations near the studied wind farms. There is a slow decreasing trend for all of the future decades from the 2040s to 2060s for the three wind farms with the exception of a small increase from the 2050s to 2060s at the Gray County, KS wind farm.
Table 4 shows the percent change in median wind speed for each season at the three studied wind farms. Winter and spring, the seasons with the greatest wind power production, are predicted to see decreases for all three wind farms with the greatest decreases of nearly 5% at the Colorado Green wind farm in winter and the
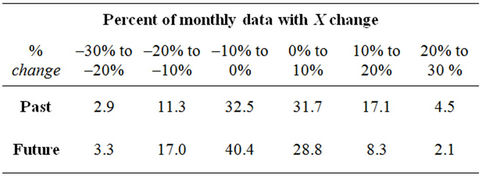
Table 2. Percent of the monthly change distribution for the Gray County, Kansas wind farm for the past and future NARCCAP data sets.
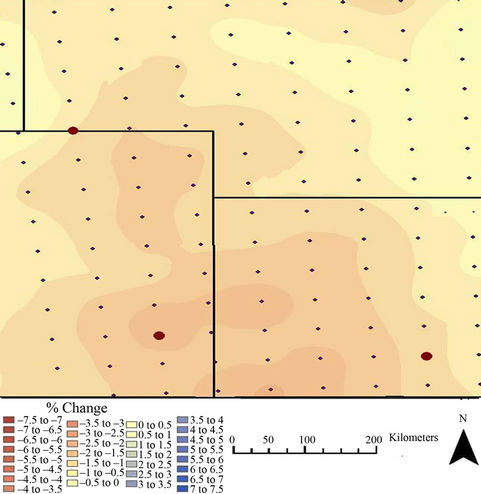
Figure 5. Percent change in median wind speed, 2070-2040.

Table 3. Median wind speed (m/s) at the three wind farms for the 3 decades in the future.

Table 4. Percent change in seasonal median wind velocity for each studied wind farm.
Gray county, Kansas wind farm in spring. Summer and fall will see less substantial changes with differing increasing or decreasing median values for the different wind farms.
Figure 6 shows the spatial pattern of percent change in median wind speeds during winter and spring. Much of southeast Colorado and southwest Kansas are predicted to have greater than 4% decreases with areas of 5% decreases in southeast Colorado. The northern half of the study area is predicted to experience decreases of about
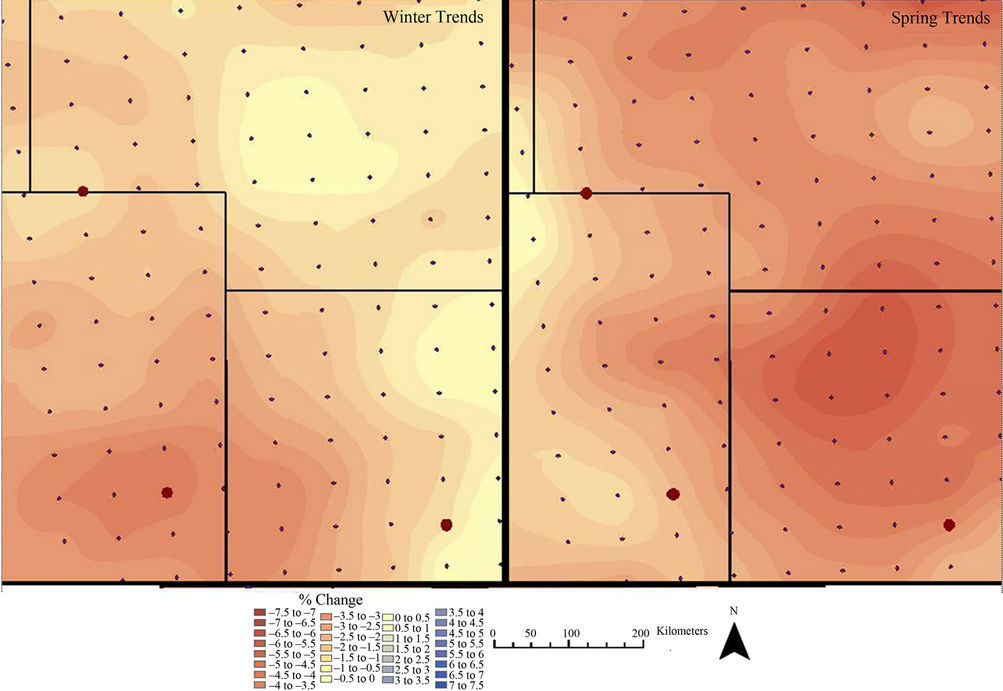
Figure 6. 2040s to 2060s percent change in winter and spring median wind speed.
1.5% to 2%. These decreases could be due to strong synoptic weather systems and their associated strong fronts not making as far of a southern track as in previous decades. Another potential reason is a more rapid transition to spring time weather patterns where the jet stream track shifts slightly further north during the early spring months [20].
The greatest magnitude trends found in the future time slice from 2040 to 2070 occur in spring and are shown in Figure 6. The areas most affected by decreasing wind speeds are projected to be over the northeastern portion of the study area where greater than 6% decreases in median wind speed are predicted for spring. Lesser decreases of approximately 2% are projected in areas closer to the Rocky Mountains and the two Colorado wind farms. The larger springtime decreases are likely due to the jet stream shifting further north during the late spring. Typically, the jet stream shifts to the north and ridging associated with weaker wind speeds occur across the area beginning in June [20]. This transition to a summertime weather pattern will likely occur earlier in the season due to more rapid warming across the plains states associated with an overall warmer climate.
Monthly analysis was performed for the Gray County, Kansas wind farm to examine more specific trends. Figure 7 shows the percent change in median wind speed from 2040 through 2070. This figure compares each month starting in January 2050 to the median of the 2040s to determine any overall pattern to the change. There is not a consistent change throughout the period as some months are predicted to see increases or decreases when compared to the 2040s. However, there is an overall pattern of declining monthly values through the time period.
Of the 239 months analyzed, 146 showed a decrease when compared to the 2040s medians, while only 93 showed an increase. Even though there were little consistent trends in the overall dataset, the month of May was found to have a much more significant and reoccurring trend. Figure 8 shows the percent change values for the month of May when compared to the medians of the 2040s (e.g., the 10 Mays during that timeframe). In only two of the years did May have a higher median than the median value from the 2040s. The month of May can be considered to be a transitional month from spring to summer. This is further evidence of a possible earlier transition into a summer weather pattern with lower wind speeds.
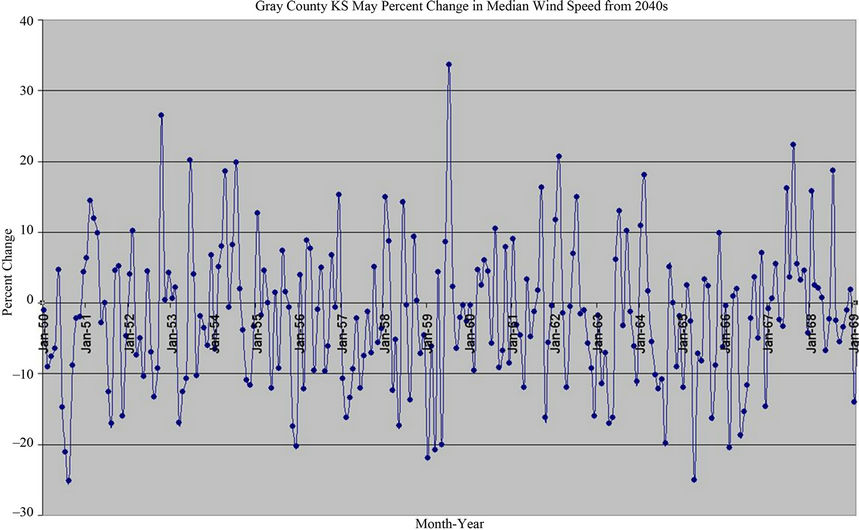
Figure 7. Monthly percent change from the 2040s for the Gray County, Kansas Wind Farm.
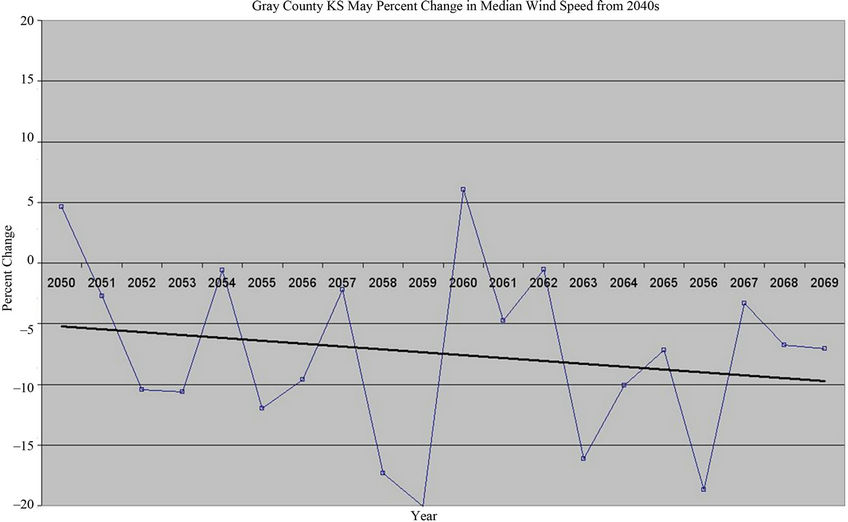
Figure 8. Percent change in May wind speed from 2040-2070 for the Gray County, Kansas Wind Farm.
5. Summary
This paper examined the potential changes in wind speed and wind power density for the US Western High Plains by comparing the time periods 1970-2000 and 2040-2070 using model output and reanalysis data. Much of the study region is projected to see a small decrease of 0.5% to 1.5% in overall 10 meter median wind speed between 1970-2000 and 2040-2070. There is a pronounced East to West pattern in the wind power density. Further west near the Rocky Mountains, 4% to 6% decreases are projected but further southeast across southwest Kansas 3% to 4% increases are indicated. This could be due to later development of storm systems or more frequent upper level ridging over the southwest United States under future climate change scenarios.
Investigation of the patterns within the future estimates showed some notable wind speed and wind power density trends. A 2% to 3% overall decrease in 10 meter median wind speed was found from 2040 to 2070 which will lead to a 7% to 10% decrease in wind power density across the southern half of the study area. The decreasing trends become more apparent during the most important seasons for wind power production (e.g., winter and spring). The southwest portion of the study area is predicted to see declines of 5% in median wind speeds in the winter which expand further north and become decreases of 8% across a large portion of western Kansas and central Nebraska during the spring. These decreases would lead to a 14% to 17% decrease in wind power densities for winter months and a 12% to 16% decrease in spring months for these areas. The reason for the more significant effect on the southern half of the study area could be an earlier transition to a summer time weather pattern where the jet stream shifts further north and upper level ridging becomes dominant over the southern plains. The month of May was analyzed and found to have large and consistent decreases, further highlighting the suggestion of an earlier transition to a summertime weather pattern.
This research illustrates that wind statistics are affected on a wide range of time scales. Projected climate change can pose a problem for decision makers on the siting of new wind farms, as well as pose challenges to utility wind power predictions. As this paper has shown, there are projected to be both large-scale changes and substantial variability within the future estimated wind speeds. Much more research of this type needs to be undertaken to more fully understand the impacts of climate change on the wind energy resource.
6. Acknowledgements
We wish to thank the North American Regional Climate Change Assessment Program (NARCCAP) for providing the data used in this paper. NARCCAP is funded by the National Science Foundation (NSF), the US Department of Energy (DoE), the National Oceanic and Atmospheric Administration (NOAA), and the US Environmental Protection Agency Office of Research and Development (EPA).
REFERENCES
- US Department of Energy, “20% Wind Energy by 2030: Increasing Wind Energy’s Contribution to US Electric Supply,” Golden, CO. DOE/GO-102008-2567, 2008.
- J. S. Greene, M. Morrissey and S. E. Johnson, “Wind Climatology, Climate Change, and Wind Energy,” Geography Compass, Vol. 4, No. 11, 2010, pp. 1592-1605. doi:10.1111/j.1749-8198.2010.00396.x
- S. C. Pryor, R. J. Barthelmie, D. T. Young, E. S. Takle, R. W. Arritt, D. Flory, W. J. Gutowski Jr., A. Nunes and J. Roads, “Wind Speed Trends over the Contiguous United States,” Journal of Geophysical Research, Vol. 114, 2009, Article ID: D14105. doi:10.1029/2008JD011416
- S. C. Pryor and R. J. Barthelmie, “Climate Change Impacts on Wind Energy: A Review,” Renewable and Sustainability Energy Reviews, Vol. 14, No. 1, 2010, pp. 430-437. doi:10.1016/j.rser.2009.07.028
- D. J. Sailor, M. Smith and M. Heart, “Climate Change Implications for Wind Power Resources in the Northwest United States,” Renewable Energy, Vol. 33, No. 11, 2008, pp. 2393-2406. doi:10.1016/j.renene.2008.01.007
- P. B. Breslow and D. J. Sailor, “Vulnerability of Wind Power Resources to Climate Change in the Continental United States,” Renewable Energy, Vol. 27, No. 4, 2002, pp. 585-598. doi:10.1016/S0960-1481(01)00110-0
- M. Segal, Z. Pan, R. W. Arritt and E. S. Take, “On the Potential Change in Wind Power over the US Due to Increases of Atmospheric Greenhouse Gases,” Renewable Energy, Vol. 24, No. 2, 2001, pp. 235-243. doi:10.1016/S0960-1481(00)00194-4
- J. Enloe, J. O’Brien and S. Smith, “ENSO Impacts on Peak Wind Gusts in the United States,” Journal of Climate, Vol. 17, 2003, pp. 1728-1737. doi:10.1175/1520-0442(2004)017<1728:EIOPWG>2.0.CO;2
- K. Klink, “Atmospheric Circulation Effects on Wind Speed Variability at Turbine Height,” Journal of Applied Meteorology and Climatology, Vol. 46, No. 4, 2007, pp. 445- 456. doi:10.1175/JAM2466.1
- J. S. Greene, K. McNabb, R. Zwilling, M. Morrissey and S. Stadler, “Analysis of Vertical Wind Shear in the Southern Great Plains and Potential Impacts on Estimation of Wind Energy Production,” International Journal of Global Energy Issues, Vol. 32, No. 3, 2009, pp. 191-211. doi:10.1504/IJGEI.2009.030651
- L. O. Mearns, et al., “The North American Regional Climate Change Assessment Program Dataset,” National Center for Atmospheric Research Earth System Grid Data Portal, Boulder, 2010. http://www.earthsystemgrid.org/browse/viewProject.htm?projectId=ff3949c8-2008-45c8-8e27-5834f54be50f
- IPCC, “Climate Change,” In: S. Solomon, D. Qin, M. Manning, Z. Chen, M. Marquis, K. B. Averyt, M. Tignor and H. L. Miller, Eds., The Physical Science Basis. Contribution of Working Group I to the 4th Assessment Report of the Intergovernmental Panel on Climate Change, Cambridge University Press, Cambridge, 2007, pp. 750- 800.
- L. O. Mearns, W. J. Gutowski, R. Jones, L.-Y. Leung, S. McGinnis, A. M. B. Nunes and Y. Qian, “A Regional Climate Change Assessment Program for North America,” EOS, Vol. 90, No. 36, 2009, pp. 311-312. doi:10.1029/2009EO360002
- Oklahoma Wind Power Initiative (OWPI): “Calculation of Wind Power Density,” 2000. http://www.seic.okstate.edu
- S. Jangamshetti, H. Rau and V. Guruprasada, “Height Extrapolation of Capacity Factors for Wind Turbine Generators,” IEEE Power Engineering Review, Vol. 19, No. 6, 1999, pp. 48-49. doi:10.1109/39.768517
- M. L. Ray, A. L. Rogers and J. G. McGowan, “Analysis of Wind Shear Models and Trends in Different Terrain,” Conference Proceeding: American Wind Energy Association Windpower, Anaheim, 22-25 May 2006.
- W. D. Lubitz, “Accuracy of Vertically Extrapolating Meteorological Tower Wind Speed Measurements,” Canadian Wind Energy Association Annual Conference, Winnipeg, 11-13 October 2006.
- M. Schwartz and D. Elliott, “Wind Shear Characteristics at Central Plains Tall Towers,” NREL/CP-500-40019, 2006.
- S. A. McAfee and J. L, Russell, “Northern Annular Mode Impact on Spring Climate in the Western United States,” Geophysical Research Letters, Vol. 35, No. L17701, 2008, p. 5.
- COMET Program, “Introduction to Climatology,” Corporation for Atmospheric Research (UCAR), 2008. https://www.meted.ucar.edu/training_module.php?id=499