International Journal of Astronomy and Astrophysics
Vol.3 No.1(2013), Article ID:29444,15 pages DOI:10.4236/ijaa.2013.31005
High Energy Studies on the Non-Thermal Emissions from Cassiopeia A & Tycho
1Physics Department, Bogazici University, Istanbul, Turkey
2Physics Department, Yildiz Technical University, Istanbul, Turkey
Email: mustafa.bozkurt@boun.edu.tr
Received November 13, 2012; revised December 25, 2012; accepted January 9, 2013
Keywords: Supernova Remnants; Non-Thermal Emission
ABSTRACT
Chandra X-ray Observatory and Fermi Gamma Ray Space Telescope analysis of young supernova remnants (SNRs) Cassiopeia A (Cas A) and Tycho were performed to understand the nature of the high energy emission from SNRs and to observationally test the diffuse shock acceleration (DSA) theory. In this study, we present the highest significances of these shell-like and young SNRs in gamma-ray as a strong evidence for cosmic ray accelerators. Gamma-ray analysis of Cas A and Tycho were performed with Fermi-LAT at significances of 26σ and 8σ, respectively. Chandra analyses were performed on the thin filaments from the shells of Cas A and Tycho. Extracted X-ray spectra have been fitted with power-law model predicting the non-thermal emissions. Best fit chi-squared values for the regions from shells of Cas A and Tycho have been presented in the X-ray analyses which are supporting the DSA theory.
1. Introduction
A supernova (SN) explosion results in structures called a supernova remnant (SNR), releasing huge amount of energy 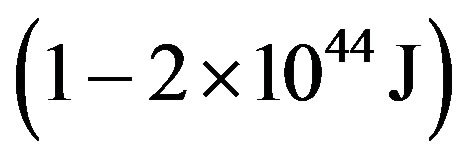 into the space. According to Green’s catalogue (2009), 274 SNRs are identified in our Galaxy. SNRs are objects, which are so energetic that they can be accepted as the main high energy sources to accelerate particles up to TeV energies [1]. Thus, especially young SNRs (at the ages from few hundred to a thousand years) such as Cas A or Tycho can be accepted as one of the high energy emissions sites since they have still energetic charged particles after the explosion. The last observed SNR, Cas A, is a well studied, shell-type, and galactic SNR. It’s angular size is 2.5’ in radius, corresponding physical size is 2.34 pc and at the distance of 3.4 kpc [2]. It has a shock speed of 5200 km/s and age of nearly 320 yr [3]. Chandra X-ray observatory revealed detailed image of Cas A having thin structures near the forward shock. X-ray observations show line emitting shell arising from reverse shocked ejecta rich in O, Si, Ar, Ca, and Fe [4]. Fermi Large Area Telescope (LAT) detection of Cas A announced with a significance of 12.2σ and the integral photon flux above 500 MeV of
  photons cm−2·s−1 [5]. VERITAS observations have given estimation of integral flux for Cas A is about 3% of the Crab-Nebula flux above 200 GeV [6]. Tycho is another young and shell-type SNR. Expansion of Tycho has been observed in radio by VLA [7]. The radio emission is also consistent with the acceleration of cosmic ray electrons by the forward shock [8]. X-ray spectrum of Tycho is dominated by very strong line emissions of Si, S, and Fe and the major fraction (60%) of the X-ray continuum emission comes from non-thermal synchrotron process [9]. The Fermi-LAT Collaboration announced the detection of Tycho in the energy range from ∼0.4 to 100 GeV. The integrated spectrum is found as
  photons cm−2·s−1 with a photon index of
  [8]. Detection of non-thermal X-ray synchrotron emission from the rims of the remnant of Tycho suggests that the shocks in SNRs can accelerate cosmic ray particles up to TeV energies [10]. This idea is supported by VERITAS observations; they declared TeV detection with a flux of 0.9% of the Crab Nebula [11].
Cas A and Tycho are in the transition phase between free expansion and adiabatic (Sedov) stages. In this phase,the mass of swept-up interstellar matter (MISM) is comparable to the mass of material ejected by the SN explosion (MEj). Ejected material arising from SN is decelerated by swept-up interstellarmatter. It produces another shock wave propagating inward, called reverse shock.Between these two shock waves, interaction of swept-up ISM and ejected materials produces nonthermal dominated X-ray emission and forms a bright shell-like structure [12]. Cas A and Tycho are shell-like SNRs having corresponding effective downstream magnetic field values are between 240 μG and 360 μG [13] in which the electrons accelerated to the GeV energies are the main sources of non-thermal emission.
SNRs are observable from radio to TeV energies. We performed gamma ray analysis by means of Fermi-LAT and X-ray analysis with Advanced CCD Imaging Spectrometer (ACIS) of Chandra Observatory on SNRs, Cas A and Tycho. Fermi has energy range from 20 MeV to 300 GeV. It covers the whole sky every 3 hours by orbiting at an altitude of 550 km and at an inclination of 28.5˚. Fermi-LAT having a wide field of view (~2 sr) and large peak effective area  provides opportunity to broadly observe gamma ray sky [14]. The Chandra—ACIS consists of ten
  pixel CCDs having energy ranges
 . It enables to study X-rays from high energy regions of the universe [15]. The data used in the Chandra analysis was taken from the observations of Cas A and Tycho on S and I chips of ACIS, respectively.
In this study, first we concentrated on Fermi-LAT analyses to find out if the remnants are strong gamma-ray emitters. Archival data of Fermi observations was used to produce counts maps, residual maps and spectral distributions of gamma rays from Cas A and Tycho. In the X-ray part, for both SNRs, we produced images in various energy ranges to detect especially the locations of hard X-rays (2.5 - 8 keV) expected that they are dominantly coming from synchrotron emission. Then, we focused on Chandra spectral analysis of 12 thin filaments (5 for Cas A and 7 for Tycho) associated with forward shock regions at the shells. We generated spectra for each region fitted with power-law model to understand properties of non-thermal emissions. Analysis details of Cas A and Tycho performed in this study is explained in detail in the 2nd and 3rd sections. Analysis results and comparisons of present findings can be seen in the Section 5th.
2. Gamma-Ray Analysis
In Fermi analysis, the LAT data having energy range of 200 MeV - 300 GeV was required from Fermi Science Support Center (FSSC) in a 20˚ region for both SNRs. Binned likelihood tutorial of FSSC was followed in the analysis. Zenith angle cut was used as 105˚ to exclude times of high background from Earth atmosphere. Also, rock angle of 52˚ (recommended by the LAT team) was used to eliminate pointed observations from the dataset.
2.1. Fermi Observations of Cas A
Fermi observation of Cas A between the dates 08/04/2008 and 01/30/2012 at the point of right ascension (RA): 350.85˚ and declination (Dec): 58.81˚ was used in the analysis. Total exposure time was nearly 34 months. Fermi analysis of Cas A was performed in 10˚ region of interest (ROI) around the center of stated coordinates and the range 0.5 - 50 GeV and the range 0.5 - 50 GeV. The background model consists of 10 sources having the distance smaller than 10˚ and having significance bigger than 5σ. Galactic diffuse emission 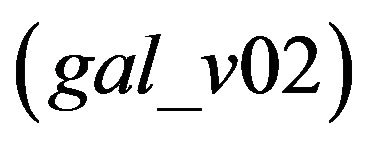 and isotropic extragalactic emission
 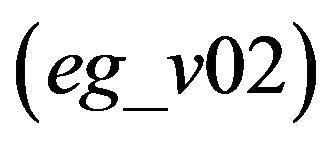 components were added to the background model. P6_V11_ DIFFUSE post-launch instrument response function was used in Cas A analysis.
2.2. Fermi AnalysisResults of Cas A
Observation of the source at the significance of 26σ with a integral photon flux of  photons cm−2·s−1 has performed for the given energy range. The photon index of Cas A was found to be 2.02 ± 0.04. Figure 1 clearly shows Cas A within the ROI. Also, Figures 2 and 3 demonstrate test significance (TS) and count spectrums of Cas A produced in the Fermi analysis, respectively. The TS spectrum shows higher significance for the range
  with the highest TS is at around 4 GeV. Count spectrum shows expected power law distribution of gamma ray photons for the given energy range.
2.3. Fermi Observations of Tycho
Fermi observation of Tycho between the dates 08/04/2008 and 05/17/2012 was used in the analysis. The data used in this study canbe found at Fermi Science SupportCenter (FSSC) (http://fermi.gsfc.nasa.gov/cgi-bin/ssc/LAT/LATDataQuery.cgi). Total exposure time was nearly 43 months. Tycho’s Fermi data was extracted from the position RA: 6.40˚ and DEC: 64.12˚. Fermi analysis of Tycho was performed in 10˚ region of interest (ROI) and the range 0.2 - 200 GeV. The background model consists of 9 sources having the distance smaller than ~6˚ and having significance bigger than 5σ. Also, galactic diffuse  and isotropic extragalactic emission
  components were added to the background model. IRFofP7SOURCE_V6 was used in the analysis.
2.4. Fermi Analysis Results of Tycho
In Fermi-LAT analysis of Tycho, the integral photon flux of  photons
 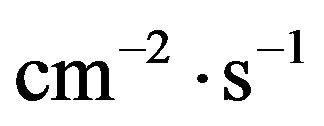 and photon index of 2.98 ± 0.20 were measured with a significance of 8σ. Figure 4 clearly shows the counts map of Tycho within
  analysis region .Since Tycho is a weak source, a residual map was generated to show Tycho in
  region in Figure 5. First a counts map was produced for Tycho. gtmodel tool was used with the
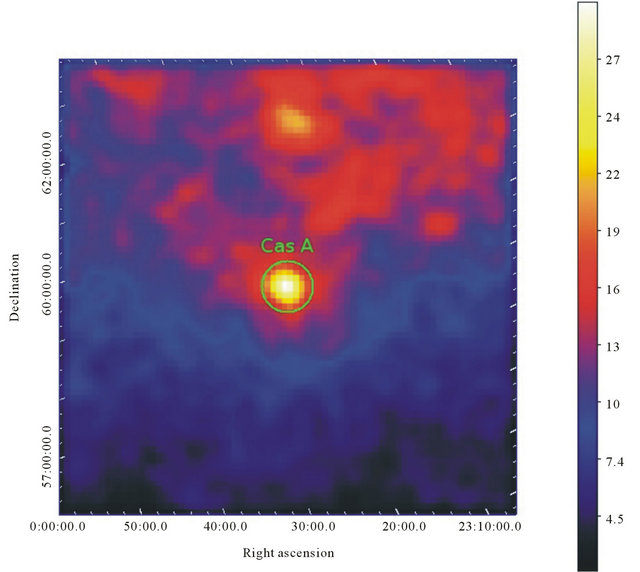
Figure 1. Fermi 10˚ × 10˚ counts map of Cas A smoothed with 3σ in the energy range of 0.5 - 50 GeV. Cas A is observed at the center of the image. The right panel shows energy distribution associated to different colors in GeV.
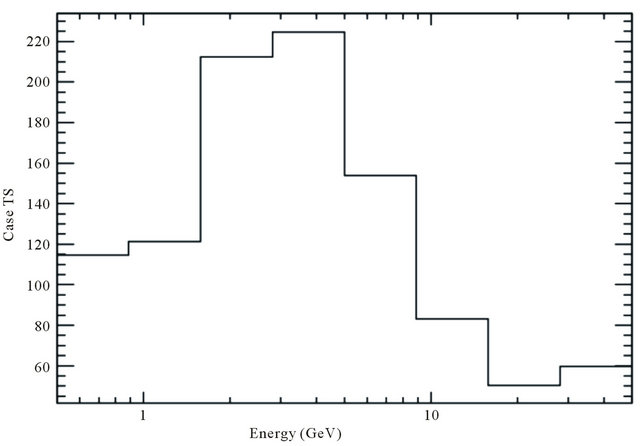
Figure 2. TS spectrum of Cas A. Relatively high significance has observed up to 10 GeV. Maximum significance is observed at nearly 4 GeV.
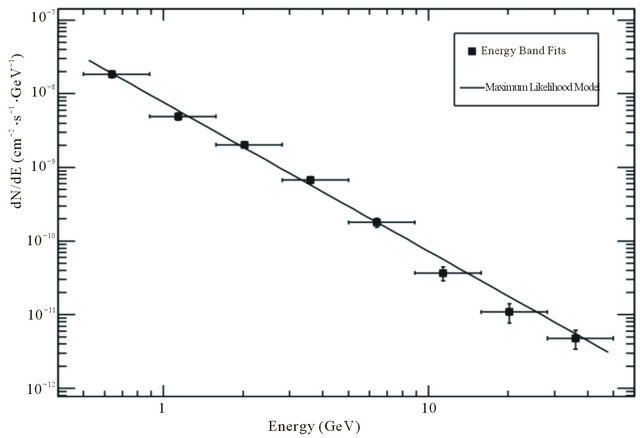
Figure 3. Count spectrum of Cas A. Spectum is fitted with power-law model. It show clear non-thermal distribution of gammaray photons in 0.5 - 50 GeV energy range.
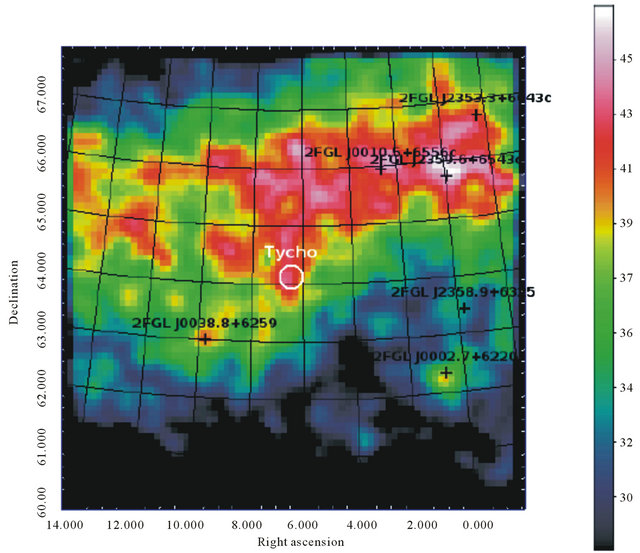
Figure 4. Fermi 8˚ × 8˚ counts map of Tycho smoothed with 3σ in the energy range of 0.2 - 200 GeV. The right panel shows energy distribution associated to different colors in GeV.
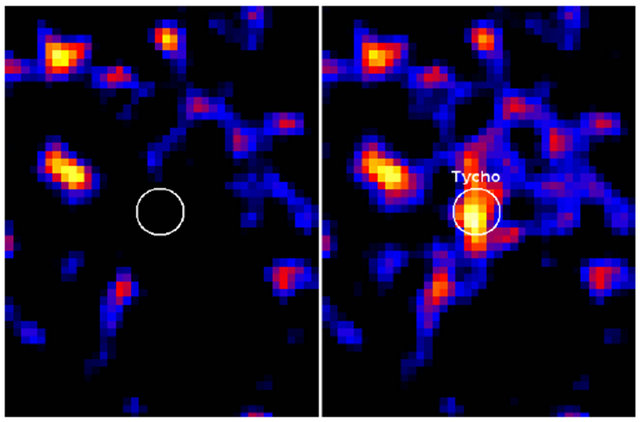
Figure 5. Residual map of Tycho smoothed with 3σ. The left map was built with background xml model file including Tycho. The right map was built with background xml file not including Tycho. The difference shows the detection of Tycho.
XML model file including Tycho and to create an output model counts map. This tool was used to correlate the data and model predictions. It creates a model map of a selected region based on the fit parameters. (Description and parameters of gtmodel tool can be found at http://fermi.gsfc.nasa.gov/ssc/data/analysis/scitools/help/gtmodel.txt). We subtracted this model counts map from the original counts map to obtain a residual map. The same step was repeated by removing Tycho from our background xml file. So, we had two residual maps one showing Tycho and the other not. The existence of Tycho in the region of interest can be clearly seen with comparison of right and left panels of Figure 5.
3. X-Ray Analysis
In Chandra analysis, ciao-4.4 science threads were followed and a new event2 class file was created for both SNRs, Cas A and Tycho. The regions for spectral analysis were selected at the shell of the remnants where photons having energy 2.5 - 8 keV (hard X-rays) are dominant. These higher energy X-ray photons are considered to be originated from synchrotron emission. The selected regions were fitted with xspec’s powerlaw by adding wabs additive model which corresponds tophoto-electric absorption for hydrogen. Also, gaussian components were applied to the models at around 1.0 keV, 1.3 keV, 1.85 keV, 2.38 keV, 3.05 keV and 6.55 keV, which we attribute to Fe xxı, Mg xı, Si K xııı, S K xv, Ar xvıı and Fe Kα line emissions, respectively.
3.1. Chandra Observations of Cas A
Chandra observation of Cas A was taken on S3 CCD chip (chip no: 7) of Advanced CCD Imaging Spectrometer (ACIS). The observation, having obs-id of 4638, performed in April 2004 was used. Exposure time was given as 166720 s to the point RA: 23h 23'26". 70 DEC: +58˚49'03" [16]. Cas A was observed in graded datamode and timed readmode.
3.2. Chandra Analysis Results of Cas A
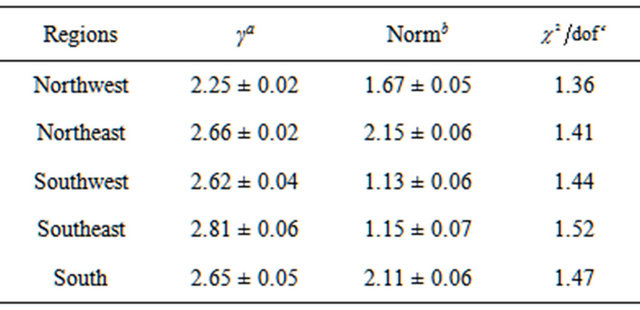
3 images were produced from evt2 file for the energies of 0.3 -1.5 keV, 1.5 - 2.5 keV and 2.5 - 8 keV. 5 thin filaments dominant in 2.5 - 8 keV range were selected from different parts of the shells of Cas A to be fitted with non-thermal power-law model. Figure 6 shows combination of 0.3 - 1.5 keV (red), 1.5 - 2.5 keV (green), and 2.5 - 8 keV (blue) images. The results of the spectral analysis for the regions are presented below. The gaussian components were added to the models of all regions for the emissions of Fe xxı, Si K xııı, and S K xv. Additionally, Mg xı, and Fe Kα line emissions were observed in south region and Mg xı emission was observed in southeast region of Cas A. Figures 8-12 show the spectra produced for northeast, southeast, northwest, southwest and south regions, respectively. Table 1 gives best fit parameters of these regions fitted with power-law model. Reduced chi-squared values between 1.36 - 1.51 were calculated for the regionsof Cas A.
3.3. Chandra Observations of Tycho
Chandra observation of Tycho is performed on 4 combined CCD chips (I0, I1, I2, and I3) of ACIS. Observation ID is 10095, the exposure time for the point RA: 00 h 25'19" and DEC: 64˚08'10" is 175670 s. The observation
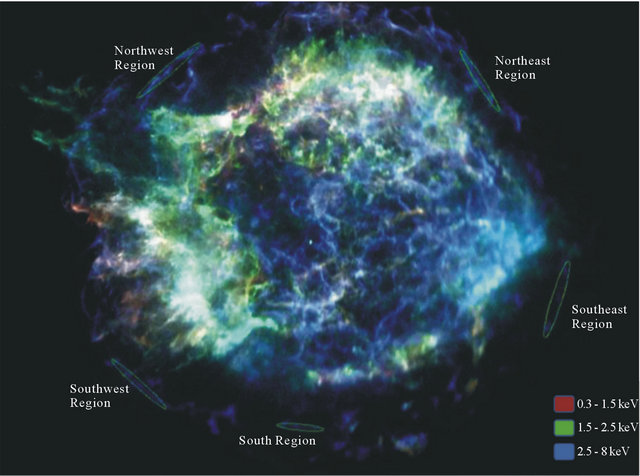
Figure 6. Chandra combined image of Cas A. Thin elliptical areas show the regions that spectral analyses were performed on.

Figure 7. Chandra combined image of Tycho. Thin elliptical areas show the regions that spectral analyses were performed on.
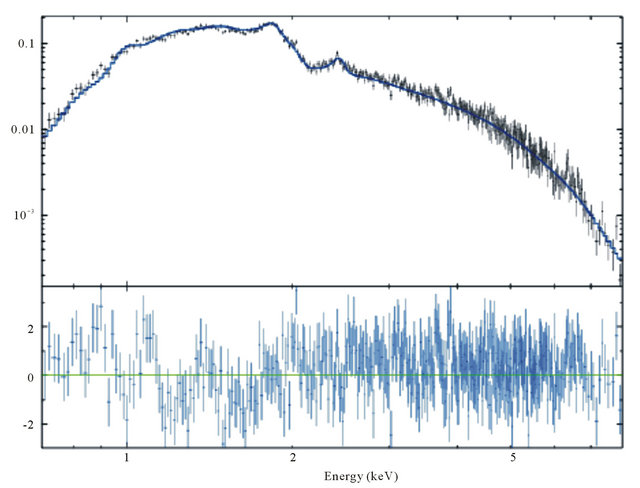
Figure 8. X-ray spectrum of the northeast region of 

 Cas A.
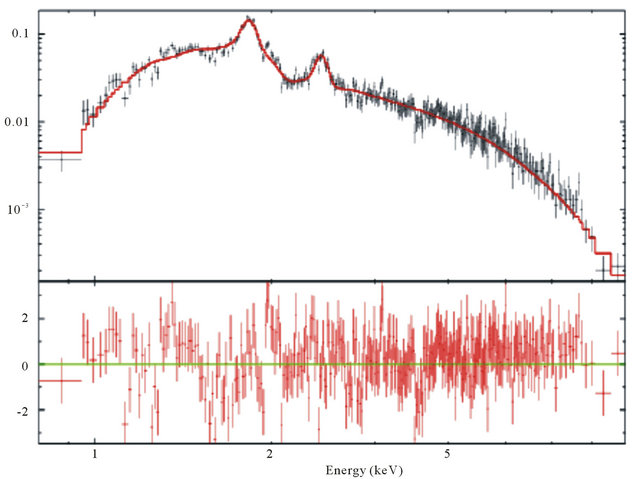
Figure 9. X-ray spectrum of the southeast region of 

 Cas A.
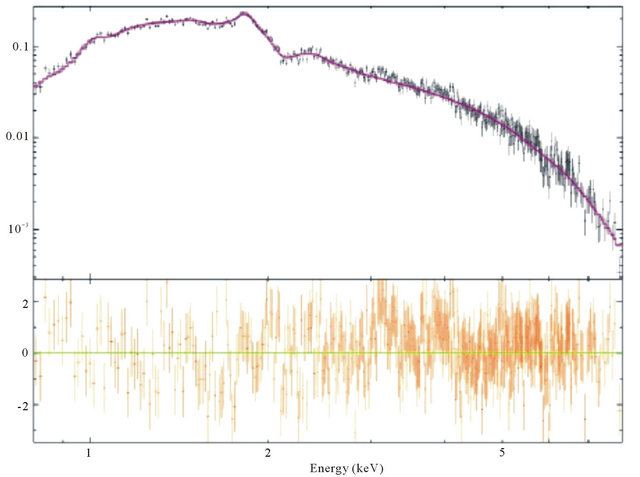
Figure 10. X-ray spectrum of the northwest region of 

 Cas A.
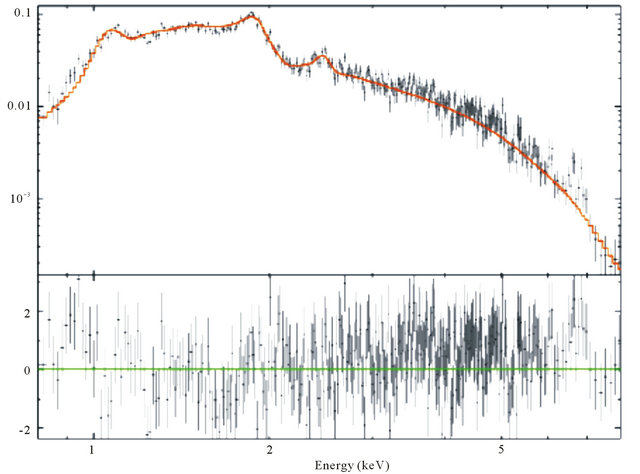
Figure 11. X-ray spectrum of the southwest region of 

 Cas A.
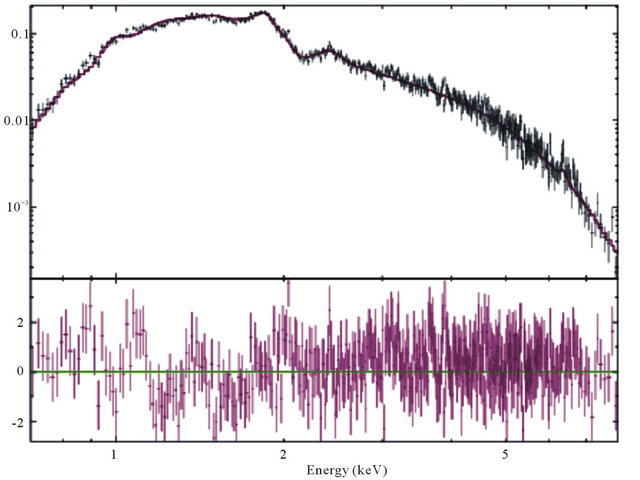
Figure 12. X-ray spectrum of the south region of Cas A.

 Table 1. Best fit spectral values of regions selected from Cas A.
date is April 2009. The observation wasperformed in timed readmode and faint datamode.
3.4. Chandra Analysis Results of Tycho
 , and 2.5 - 8 keV (blue) images were produced and combined in the X-ray image analysis of Tycho. 7 regions were selected from the shell of the remnant. Thin filaments selected from the shell were fitted with power-law model. The north, southeast, south and east regions have Si and S emissions peaks. The northeast region does not show a distinctive line emission. The southwest region has Fe xxı, Si and S emissions. The west region has Fe xxı, Si, S, Ar and Fe Kα emissions. Figure 7 shows combination of
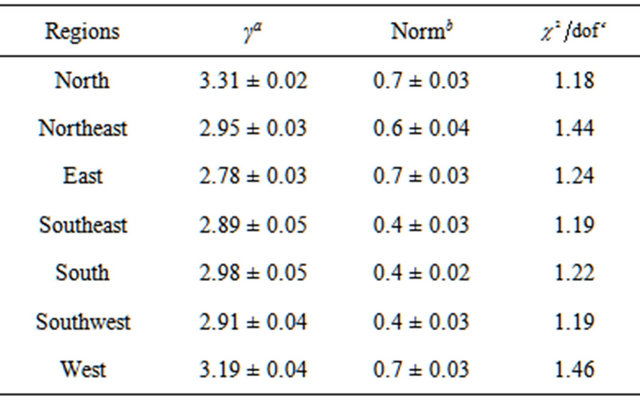
 , and 2.5 - 8 keV (blue) images of Tycho. Figures 13-19 show the spectrums of north, west, southeast, east, south, southwest and northeast regions, respectively. Table 2 shows results of spectrums of the regions modeled with powerlaw. Reduced chi-squared values between 1.18 - 1.46 were measured for the regions of Tycho.
4. Cosmic Ray Acceleration and SNRs
The origin and acceleration mechanism of cosmic rays (CRs), consisting primarily of relativistic protons, ions and electrons, have been a long-standing mystery since the discovery of CRs [10]. Supernova Remnants (SNRs) have long been considered to be the primary source of galactic CRs having energies below the so called “knee”, ∼1015 eV. Observations of X-ray synchrotron emission from shock fronts of Tycho suggested the idea that shocks of SNRs would be cosmic ray accelerators [17]. X-ray synchrotron radiation is an evidence for relativistic cosmic ray electrons. After Tycho, RCW 86 [18], G347.3-0.5 and G266.2-1.2 [19] have been categorized into synchrotron X-rays emitting SNRs [8]. Recently, a significant number of SNRs dominating non-thermal emissions, especially from their shells, has been revealed by Chandra. Additionally, Fermi Gamma-ray Space Telescope [5,8] and ground-based Cherenkov telescopes, such as VERITAS [6,11] and H.E.S.S. [20] also observed TeV gamma rays from the shell of SNRs which provided reasonable evidences for the cosmic ray acceleration at the shocked shell of SNRs. The most conceivable model

Figure 13. X-ray spectrum of the north region of 

 Tycho.
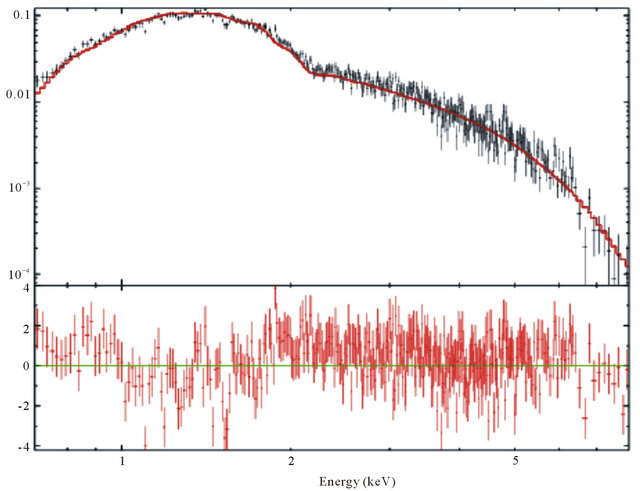
Figure 14. X-ray spectrum of the west region of Tycho.
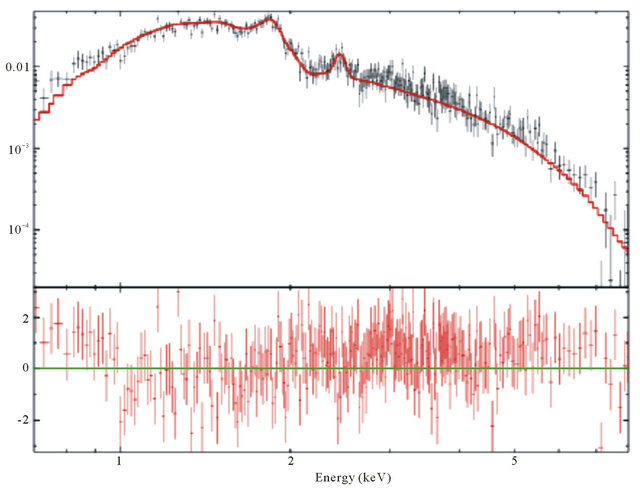
Figure 15. X-ray spectrum of the southeast region of Tycho.
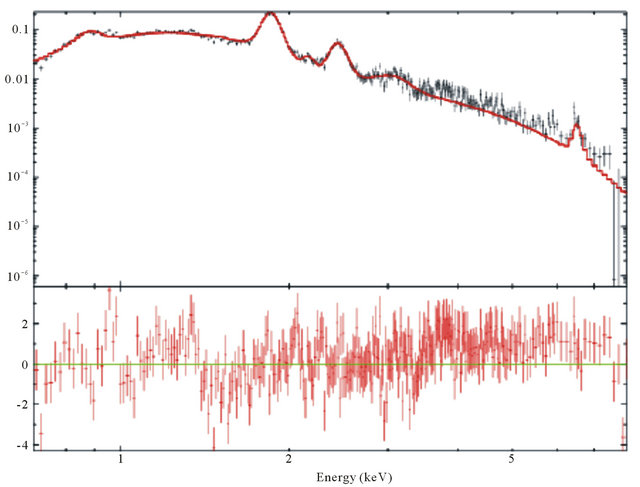
Figure 16. X-ray spectrum of the east region of Tycho.
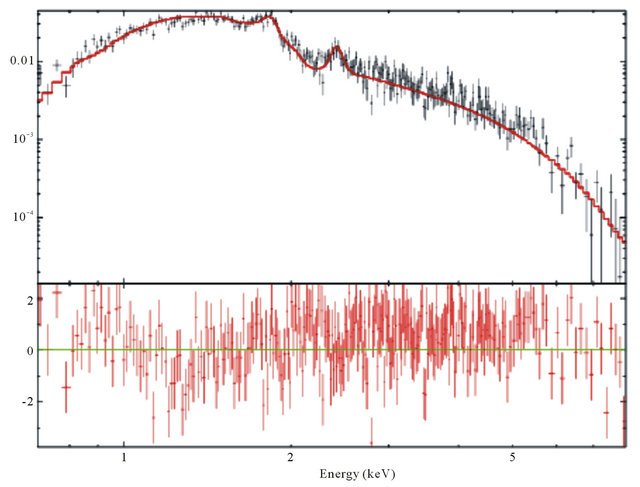
Figure 17. X-ray spectrum of the south region of Tycho.
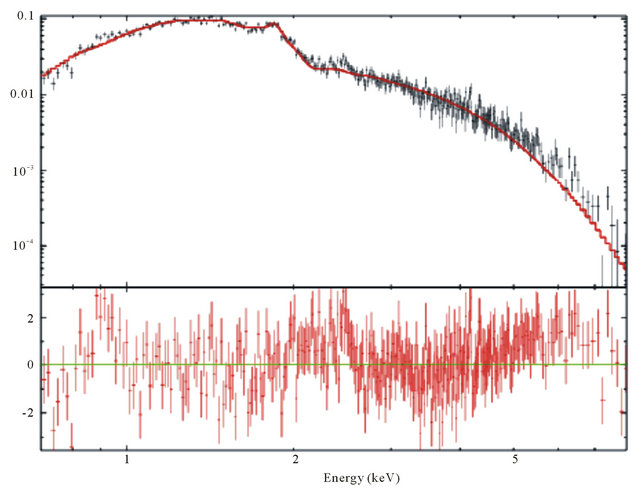
Figure 18. X-ray spectrum of the southwest region of Tycho.

Figure 19. X-ray spectrum of the northeast region of Tycho.
Table 2. Best fit spectral values of regions selected from Tycho.
to explain cosmic ray acceleration is the DSA theory of Bell [1] which suggested that the thin filaments on shells of the remnants are most possible regions where accelerated particles exist and can be observed as nonthermal X-ray emitting regions. According to this process, particles are accelerated by the shock into a power-law distribution and can be observed near the shock region as thin filaments about 0.01 - 0.4 pc [8]. Apart from Bell, Blandfor and Eichler [21] claimed that the high energy particles diffusing through Alfvén waves gain energy when they cross the shock front and bounce off approaching scattering centers. Also, Bykov [22] argued that collisionless shock waves as the main plasma heating agent created after the explosion serve the source of energetic charged particles and radiation. However, there are still some significant deficiencies for the origin of cosmic ray acceleration, because dynamical evolution of SNRs can affect cosmic ray acceleration process (e.g., explosion energy, mass of ejecta, ambient density) [17]. We still lack the information about the maximum energy of particles, their magnetic field configurations, the injection efficiency from thermal plasma, and the history of acceleration of particles.
5. Summary and Discussion
SNRs have the mechanism that can accelerate the particles up to TeV energies. Gamma ray production in SNRs is of leptonic or hadronic origins. In order to explain obliquely the existence of these high energy charged particles, we need to detect GeV photons produced by electrons (leptonic) with inverse Compton, and relativistic bremsstrahlung processes or by protons with neutral pion decay (hadronic) process in SNRs. The observation of Cas A in gamma-ray at the significance of 26σ is a strong detection with an integral photon flux of (17.6 ± 0.11) × 10−9 photons cm−2·s−1 and the photon index of 2.02 ± 0.04 in the energy range of 0.5 - 50 GeV. Fermi detection of Cas A shows low error intervals for flux and spectral index. Analysis results gave 0.6% error for flux value and 2% error for spectral index. The 10˚ × 10˚ counts map clearly reveals the existence of Cas A in a given energy range. We also produced spectral significance and counts spectrums to show distributions of gamma-ray photons coming from Cas A. In Fermi-LAT analysis of Tycho, the integral photon flux of  photons cm−2·s−1 was measured with a significance of 8σ in the energy range of 0.2 - 200 GeV. We found relatively low flux and significance values for Tychoin comparison to Cas A. Since Tycho is a weak source in gamma ray, a residual map was built to show SNR Tycho in a 8˚ × 8˚ region by removing Tycho from background model. The comparison of residual maps indicates existence of Tycho in given energy range. The diffuse shock acceleration theory of Fermi has claimed that the particles are accelerated up to very high energies due to magnetic inhomogeneities of the opposite sides of shock waves. The Fermi mechanism is applied to collisionless shock where the mean free path of particles is much larger than length scale of shock transition. Sequential diffusion causes increase in the speed of the particle and these multiple reflections hugely increase energy of the particles. In SNRs, charged particles can gain energy by crossing the shock repeatedly. The X-rays are produced in high magnetic fields by process synchrotron emission which favors power-law energy distribution. In X-ray analysis of shell-like SNRs, these shock regions can be observed in thin filaments at the shell structures of remnants. So, we concentrated on these regions at shells of the SNRs. The thin filaments selected from different parts of the shells of Cas A and Tycho were analyzed in the X-ray band. Extracted spectrums have been fitted with power-law model predicting the non-thermal emission. Also, some gaussian components were added to the models to meet line emission peaks of elements for related energies. Reasonable chi-squared values, 1.36 - 1.51 for Cas A and 1.18 - 1.46 for Tycho have been found in the analyses. In the Chandra-ACIS analysis, we showed more thin filaments to be fitted with xspec’s power-law model and got lower chi-squared values for Tycho.
6. Conclusion
Summing up the results presented here, let us conclude some fundamental aspects of this study. The detection of Cas A and Tycho performed with the highest level of significances so far indicates the strong detection of these young SNRs in GeV ranges. These results make an observational contribution to the ideathat SNRs would be essential candidates for cosmic ray acceleration. Chandra analyses of these young supernova remnants observationally demonstrate that there are possible regions at the shell of the remnants associated with synchrotron emission dominant by hard X-rays. These regions can be seen as thin filaments at the shell of the remnants near the forward shock regions having non-thermal X-ray emissions. Spectra of these regions fitted with power-law verify the idea of diffuse shock acceleration suggesting that particles can be accelerated by the shock into a powerlaw distribution.
7. Acknowledgements
E. Nihal Ercanwould like to thank Bogazici University BAP (code 10B03P3) for financial support.
REFERENCES
- A. R. Bell, “The Acceleration of Cosmic Rays in Shock Fronts 2,” Monthly Notices of the Royal Astronomical Society, Vol. 182, No. 2, 1978, pp. 443-455.
- J. E. Reed, J. J. Hester, A. C. Fabian and P. F. Winkler, “The Three Dimensional Structure of the Cassiopeia A Supernova Remnant I. the Spherical Shell,” Astrophysical Journal, Vol. 440, No. 2, 1995, pp. 706-711. doi:10.1086/175308
- J. Ballet, “X-Ray Synchrotron Emission from Supernova Remnants,” Advances in Space Research, Vol. 37, No. 10, 2006, pp. 1902-1908. doi:10.1016/j.asr.2005.03.047
- J. Vink and J. M. Laming, “On the Magnetic Fields and Particle Acceleration in Cassiopeia A,” Astrophysical Journal, Vol. 584, No. 2, 2003, pp. 758-769. doi:10.1086/345832
- A. A. Abdo, et al., “Fermi-LAT Discovery of GeV Gamma Ray Emission from the Young Supernova Remnant Cassiopeia A,” Astrophysical Journal, Vol. 710, No. 1, 2010, pp. 92-97. doi:10.1088/2041-8205/710/1/L92
- A. Acciari, et al., “Observations of the Shell Type SNR Cassiopeia A at TeV Energies with VERITAS,” Astrophysical Journal, Vol. 714, No. 1, 2010, pp. 163-169. doi:10.1088/0004-637X/714/1/163
- D. M. Katz-Stone, N. E. Kassim, T. Lazio, W. Joseph and R. O’Donnell, “Spatial Variations of the Synchrotron Spectrum within Tycho’s Supernova Remnant (3C10): A Spectral Tomography Analysis of Radio Observations at 20 and 90 Centimeter Wavelengths,” Astrophysical Journal, Vol. 529, No. 1, 2000, pp. 453-462. doi:10.1086/308251
- F. Giordano, et al., “Fermi LAT Detection of the Young Supernova Remnant Tycho,” Astrophysical Journal, Vol. 744, No. 1, 2012, pp. 32-37. doi:10.1088/2041-8205/744/1/L2
- A. Bamba, R. Yamazaki, T. Yoshida, T. Terasawa and K. Koyama, “A Spatial and Spectral Study of Nonthermal Filaments in Historical Supernova Remnants Observational Results with Chandra,” Astrophysical Journal, Vol. 621, No. 2, 2004, pp. 793-802. doi:10.1086/427620
- V. F. Hess, “Penetrating Radiation in Seven Free Ballon Flights,” Physics Zeits, Vol. 13, No. 1084, 1912, pp. 1-4.
- A. Acciari, et al., “Discovery of TeV Gamma Ray Emission from Tycho’s Supernova Remnant,” Astrophysical Journal, Vol. 730, No. 2, 2010, pp. 20-24. doi:10.1088/2041-8205/730/2/L20
- H. Yamaguchi, “X-Ray Study of Ejecta Dominated Supernova Remnants with Suzaku,” Ph.D. Thesis, Kyoto University, Kyoto, 2008.
- H. J. Völk, E. G. Berezhko and L. T. Ksenofontov, “Magnetic Field Amplification in Tycho and Other Shell Type Supernova Remnants,” 29th International Cosmic Ray Conference Pune, Vol. 3, No. 9, 2005, pp. 233-236.
- B. W. Atwood, et al., “The Large Area Telescope on the Fermi Gamma Ray Space Telescope Mission,” Astrophysical Journal, Vol. 697, No. 2, 2009, pp. 1071-1102. doi:10.1088/0004-637X/697/2/1071
- B. S. Williams and K. R. Gage, “The Chandra X-Ray Observatory Mission Planning Process: Managing and Implementing Constraints,” Proceedings of the SPIE, Vol. 6270, No. 7, 2006, pp. 215-231. doi:10.1117/12.673346
- U. Hwang, et al., “A Million Second Chandra View of Cassiopeia A,” Astrophysical Journal, Vol. 615, No. 2, 2004, pp. 117-120. doi:10.1086/426186
- J. S. Warren, J. P. Hughes, C. Badenes, P. Ghavamian, C. F. McKee, D. Moett, P. P. Plucinsky, P. Rakowski, E. Reynoso and P. Slane, “Cosmic Ray Acceleration at the forward Shock in Tycho’s Supernova Remnant: Evidence from Chandra X-Ray Observations,” Astrophysical Journal, Vol. 634, No. 1, 2005, pp. 376-389. doi:10.1086/496941
- K. J. Borkowski, J. Rho, S. P. Reynolds and D. K. Kristy, “Thermal and Nonthermal X-Ray Emission in Supernova Remnant RCW 86,” Astrophysical Journal, Vol. 550, No. 1, 2001, pp. 334-345. doi:10.1086/319716
- P. Slane, J. P. Hughes, R. J. Edgar, P. P. Plucinsky, E. Miyata, H. Tsunemi and B. Aschenbach, “RX J0852.0- 4622: Another Nonthermal Shell Type Supernova Remnant (G266.2-1.2),” Astrophysical Journal, Vol. 548, No. 2, 2001, pp. 814-819. doi:10.1086/319033
- F. A. Aharonian, et al., “HESS Upper Limits for Kepler’s Supernova Remnant,” Astronomy & Astrophysics, Vol. 488, No. 1, 2008, pp. 219-223. doi:10.1051/0004-6361:200809401
- R. Blandford and D. Eichler, “Particle Acceleration at Astrophysical Shocks: A Theory of Cosmic Ray Origin,” Physics Reports, Vol. 154, No. 1, 1987, pp. 1-75. doi:10.1016/0370-1573(87)90134-7
- A. M. Bykov, “Shocks and particle acceleration in SNRs: theoretical aspects,” Advances in Space Research, Vol. 33, No. 4, 2004, pp. 366-375. doi:10.1016/j.asr.2003.12.002

