Journal of Diabetes Mellitus
Vol.3 No.2(2013), Article ID:31334,8 pages DOI:10.4236/jdm.2013.32011
Downregulation of Nrf2 and HO-1 expression contributes to oxidative stress in type 2 diabetes mellitus: A study in Juana Koslay City, San Luis, Argentina
![]()
1Laboratory of Diabetes, Department of Biochemistry and Biological Sciences, School of Chemistry,Biochemistry and Pharmacy, National University of San Luis, San Luis, Argentina; *Corresponging Author: msojeda@unsl.edu.ar
2Laboratory of Pathological & Biological Chemistry, National University of San Luis & IMIBIO-SL-National Bureau of Science and Technology (CONICET), San Luis, Argentina
3Juana Koslay Regional Center, Ministry of Health of the Province of San Luis, San Luis, Argentina
Copyright © 2013 Susana Siewert et al. This is an open access article distributed under the Creative Commons Attribution License, which permits unrestricted use, distribution, and reproduction in any medium, provided the original work is properly cited.
Received 17 March 2013; revised 16 April 2013; accepted 24 April 2013
Keywords: Type 2 Diabetes Mellitus; HO-1; Nrf2 and TBAR’S
ABSTRACT
Oxidative stress is associated with diabetes mellitus, a condition characterized by increased prevalence and progression rate of cardiovascular disease. NFE2-related factor 2 (Nrf2) is a master regulator of cellular detoxification responses and redox status. The aim of this study was to examine associations between type 2 Diabetes Mellitus (T2DM), oxidative stress and the expression of NFE2-related factor 2 (Nrf2) in a population of diabetic patients living in Juana Koslay City, San Luis, Argentina. In addition, we evaluated the functional relevance of Nrf2 by measuring the HO-1 expression among persons with type 2 diabetes. We measured clinical and biochemical parameters related to lipid metabolism and oxidative stress in a population of Type 2 Diabetes Mellitus patients (T2DM, n = 40) and controls (Co, n = 30). Compared to Co, T2DM patients had higher fasting serum glucose, glycated hemoglobin, triglycerides, total cholesterol, low-density lipoprotein cholesterol, and thiobarbituric acid reactive substances and lower high-density lipoprotein cholesterol. T2DM individuals had also higher atherogenic index and body mass index than controls. We also founded that HO-1 mRNA in whole blood was lower in T2DM than controls, suggesting that T2DM may have an altered antioxidant response to oxidative stress. Interestingly, we found reduced Nrf2 mRNA in whole blood from T2DM compared to Co. The results from this study provide novel evidence that genes associated to antioxidant defense mechanisms are markedly reduced in patients with type 2 diabetes, and that the reduction in the expression of these genes could be associated to hyperglycemia and increased levels of MDA. Linear regression analysis revealed that there was a strong and positive correlation between the changes of Nrf2 and HO-1 expression levels.
1. INTRODUCTION
The pathogenesis of Type 2 Diabetes Mellitus (T2DM) has not been fully elucidated; however, there is growing evidence linking this disease to oxidative stress [1-3]. Oxidative stress, resulting from increased production or decreased removal of reactive oxygen species (ROS), plays a key role in the pathogenesis of late diabetes complications [2] and insulin—stimulated glucose uptake [4].
Increasing evidence indicates that increased production of reactive oxygen or nitrogen species (ROS or RNS) and/or impaired endogenously protective mechanism is the major factor responsible for the development and progression of vascular complications in diabetic patients, although several other mechanisms were also proposed [5-7].
One of the most important antioxidant machineries is the Nrf2 system, with the transcription factor Nrf2 as the central component [8]. The transcriptional factor NFE2- related factor 2 (Nrf2), a member of the cap’n’collar family, is a master regulator of cellular detoxification responses and redox status [9]. Under physiological conditions Nrf2 locates in the cytoplasm and binds to its inhibitor kelch-like ECH-associated protein 1 (KEAP1) [10]. KEAP1 could mediate a rapid ubiquitination and subsequent degradation of Nrf2 by the proteasome [10]. Upon exposure of cells to oxidative stress or electrophilic compounds, Nrf2 is released from KEAP1 and translocates into the nucleus. There, it binds to antioxidant-responsive elements (ARE) in the genes encoding antioxidant enzymes such as NADPH quinoneoxidoreductase (NQO1), heme oxygenase-1 (HO-1), glutathione S transferase, superoxide dismutase (SOD), catalase, and γ-glutamylcysteine synthetase, increasing their expression to play a role in the detoxification, antioxidant, and anti-inflammatory processes [9-11].
Among a panel of potential candidate genes related to oxidative stress, the heme oxygenase-1 (HO-1) gene has drawn much attention with its potent antiinflammatory, antioxidant, and antiproliferative effects [12]. Heme oxygenase is a microsomal rate-limiting enzyme responsible for the oxidation and degradation of heme into biologically active metabolites—biliverdin, which is rapidly reduced to bilirubin by biliverdin reductase, carbon monoxide, and iron [13]. Three mammalian heme oxygennase isoforms have been identified. Among them, the inducible isoform HO-1 is a stress-responsive protein ubiquitously distributed in mammalian tissues and can be induced by various oxidative agents [14,15]. The induction of HO-1 has been considered an adaptive cellular defense response protecting cells or tissues against injuries in pathophysiological states, attributed to the antioxidant properties of bilirubin and biliverdin, the extrusion and sequestration of cellular free iron by ferritin, and the antiapoptotic and anti-inflammatory effects of carbon monoxide [12,14-16]. The beneficial role of HO-1 in diabetes has been reported in animal models and in in vitro assays involving exposure to glucose [12,17], but little information on humans is available.
Our aim in this study was to examine associations between type 2 Diabetes Mellitus (T2DM), oxidative stress and the expression of NFE2-related factor 2 (Nrf2) in a population of diabetic patients living in Juana Koslay City, San Luis, Argentina. In addition, we evaluated the functional relevance of Nrf2 by measuring the HO-1 expression among persons with type 2 diabetes.
2. RESEARCH DESIGN AND METHODS
2.1. Subjects
The present study was carried out in accordance to the guidelines of the Helsinki Declaration. A total of 70 volunteers (40 patients with type 2 diabetes and 30 healthy age-matched controls) participated in this investigation. Criteria published by the American Diabetes Association were used to diagnose T2DM [18]. These patients reside in Juana Koslay, San Luis, Argentina. The protocol for this study was approved by the local Institutional Review Board, and a written informed consent was obtained from each patient to be enrolled. During an initial interview with each patient, they were asked for diseases, medication and smoking histories. Exclusion criteria included liver, kidney and thyroid diseases, as well as the use of anti-lipemic drugs.
2.2. Anthropometric and Clinical Data
For each subject enrolled, height (meters) and weight (Kg) measurements were acquired. Height and weight were measured to the nearest 0.5 cm and 0.1 Kg, respectively. The body mass index (BMI) was calculated as weight divided by height squared (Kg/m2). Those patients with a BMI equal or greater than 30.00 Kg/m2 were considered as obese.
2.3. Blood Sampling
Blood samples were obtained from patients that had fasted overnight for a minimum of 12 h and were drawn from the antecubital vein between 08:00 am and 09:30 am. Blood sample were obtained with or without anticoagulants to obtain plasma and serum, respectively. After separation of plasma, cell pellets were used to extract RNA (see below).
2.4. Biochemical Measurement
Fasting plasma glucose (FPG) was measured by using a glucose oxidase method with a commercial enzymatic kit (Wiener Lab, Rosario, Argentina) and Glycated hemoglobin (HbA1c) concentration was measured with a coupled ionic-exchange chromatography/spectrophotometric assay (BioSystems, Barcelona, Spain) in a Bayer Express Plus Chemistry Analyzer (Bayer Diagnostics, Siemens, Germany). Total cholesterol (TC), triglycerides (TG) and HDL-c concentrations were measured using commercial kits by following manufacturer’s instructions (Wiener Lab, Rosario, Argentina) in a Bayer Express Plus Chemistry Analyzer (Bayer Diagnostics, Siemens, Germany). Low density lipoprotein-cholesterol (LDL-c) was calculated with the Friedewald formula: LDL-c = total cholesterol (mg/dL) − HDL-c (mg/dL) – triglycerides (mg/dL)/5 [19].
2.5. Lipid Peroxidation Assay
Plasma lipid peroxidation was determined as described by Jentzsch et al. (1969). Plasma protein was precipitated in trichloroacetic acid (TCA). MDA produced during lipid peroxidation, reacts with thiobarbituric acid (TBA) and generas a pink-colored complex. After some further steps, the absorbance of the supernatant was measured spectrophotometrically at 532 nm (Bayer Diagnostics, Siemens, Germany) using 1,1,3,3-Tetra ethoxypropane (Sigma Chemical, St Louis, MO) as standard. TBARS concentration was determined in triplicate and all results are presented in M.
2.6. Measurement of Gene Expression
Total RNA was isolated from cell pellets using the TRIzol reagent following manufacturer’s instructions (Life Technologies, Carlsbad, CA). Agarose gel electrophoresis and ethidium bromide staining confirmed the purity and integrity of isolated RNA. RNA concentration was assessed by spectrophotometric measurements at 260/280 nm. Then, ten micrograms of total RNA were reverse-transcribed with 200 units of moloney-murine leukemia virus (MMLV) reverse transcriptase (Promega) using random hexamers as primers in 20 μL reaction mixture following the instructions provided by the manufacturer. The reverse transcription reactions were performed using a GeneAmp PCR system 2400 (PerkinElmer, Wellesley, MA) with conditions at 65˚C for 10 min, 37˚C for 60 min, and 90˚C for 5 min. PCR was used to quantify human Nrf2, HO-1 and Cyclophiline A expression. PCRs were carried out in 35 μl reactions. Each amplification reaction included 20 ng of cDNA, 20 pmol of each PCR primer and 1 unit of AmpliTaq Gold DNA polymerase (Perkin-Elmer, Waltham, MA). These reactions were performed in a buffer 1X containing 1.5 mmol/L MgCl2, 50 mmol/L KCl, 20 mmol/L Tris-HCl (pH 8.4), and 200 pmol/L of each deoxynucleotide triphosphate. cDNA and control preparations were amplified using the following conditions: 95˚C for 2 min followed by 40 cycles of: denaturation for 1 min at 95˚C, primer annealing for 1 min at 60˚C, and extension for 1 min at 72˚C; followed by a final extension at 72˚C for 5 minutes. Deoxy-oligonucleotide primers were constructed from the published cDNA sequence of HO-1, Nrf2 and Cyclophiline A, and the PCR products resulted in 323, 201 and 166 bp fragments, respectively. Cyclophiline A controls were performed for all PCRs. The primers sequences are presented in Table 1.
The PCR products were electrophoresed on 2% (w/v) agarose gel with 0.01% (w/v) ethidium bromide. The image was visualized and photographed under UV transillumination. The intensity of each band was measured using NIH Scion Image 1.6.3 software and reported as the values of band intensity units.
2.7. Statistics
All results are presented as mean ± SD. Student’s t-test was used for the analysis of data with a Gaussian distribution. The Pearson’s product moment and Spearman’s correlation coefficients were used to determine the relationships between the studied parameters. Statistical significance was accepted at p < 0.05.
3. RESULTS
3.1. Subject Characteristics
Seventy individuals were included in this study, 40 of them were diabetic and 30 were controls. Table 2 shows the demographic characteristics of both groups. 54.3% were women and 45.7% were men, age distribution was not different between the groups with a media age of 56.3 years old. The average value of BMI was 27.1 kg/m2 for the control group and 30 kg/m2 for the diabetic one. There was a significant difference in weight and BMI between both groups. Diabetic female subjects were more obese than diabetic male subjects.
As shown in Table 3, fasting plasma glucose and HbA1c concentrations were higher in the diabetic group when compared with age-matched control subjects. Total cholesterol, TG and LDL-c were increased in the diabetic group, while HDL-c was significantly lower in these patients, when compared to controls. LDL cholesterol was lower in diabetic female than in diabetic male subjects. The atherogenic index (AI) was two fold above the control value in the diabetic patients, what suggests a higher risk for cardiovascular diseases in these patients.
Abbreviations used: TG, triglycerides; TC, total cholesterol; LDL, low density lipoprotein; HDL, high den-
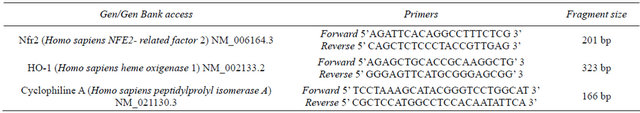
Table 1. Primers sequences for RT-PCR.
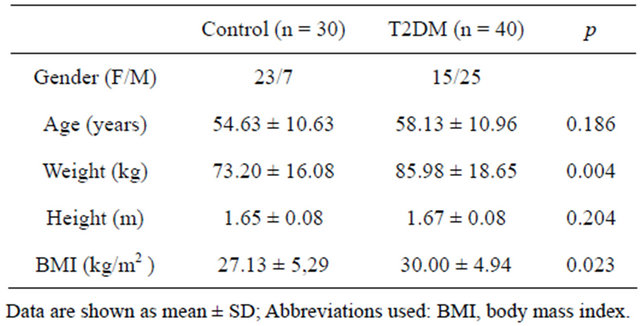
Table 2. Anthropometric characteristics in control and T2DM patients.
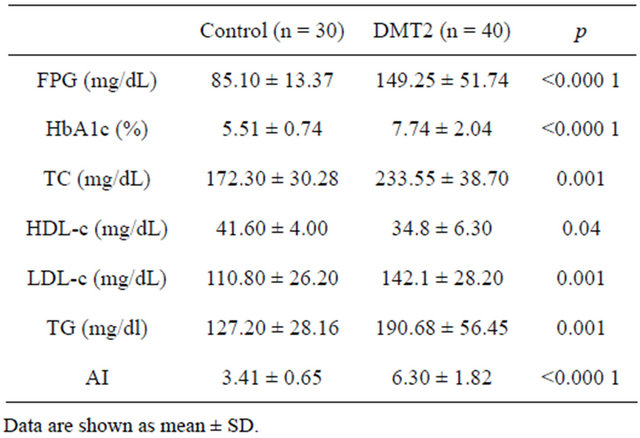
Table 3. Biochemical characteristics in control and T2DM patients.
sity lipoprotein; FPG, fasting plasma glucose; HbA1c, glycated hemoglobin; AI: TC/HDL-c
3.2. Prooxidant Status
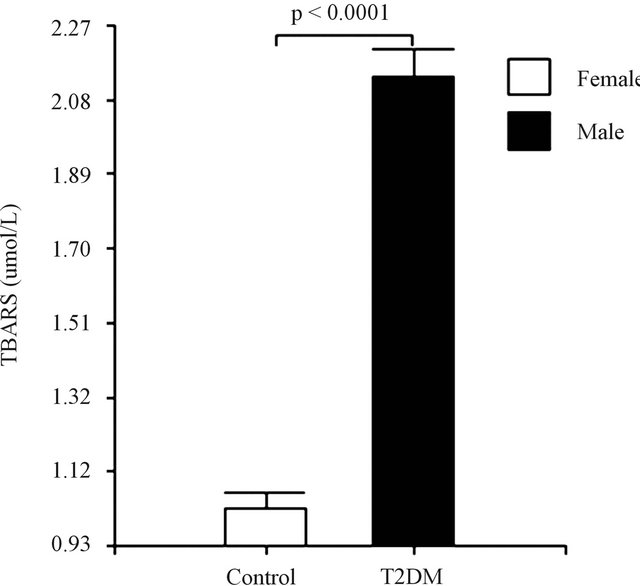
The malon-dialdehyde (MDA) concentration was assessed to evaluate the oxidative stress using the thiobarbituric acid-reactive substances (TBAR’S) method. The results obtained are consistent, with a significant increase in TBAR’S levels in the diabetic group, when compared to age-matched control subjects (Figure 1(a)). TBAR’S levels were lower in diabetic female than in diabetic male subjects (Figure 1(b)).
3.3. mRNA Expression
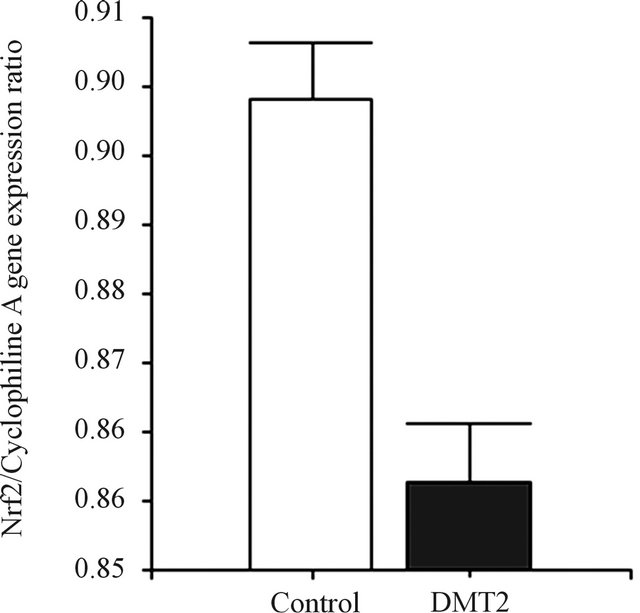
As shown in Figure 2, Nfr2 gene expression was significantly higher (0.90 ± 0.04 Nrf2/Cyclophiline A gene expression ratio) in leucocytes from controls when compared to type 2 diabetic patients (0.86 ± 0.04, p < 0.0001). Similarly, HO-1 gene expression was significantly higher in controls (0.80 ± 0.03 HO-1/Cyclophiline A gene expression ratio) when compared to the T2DM patients (0.74 ± 0.07, p < 0.003) (Figure 3). Nfr2 and HO-1 gene expression were not different between genders in both groups.
 (a)
(a)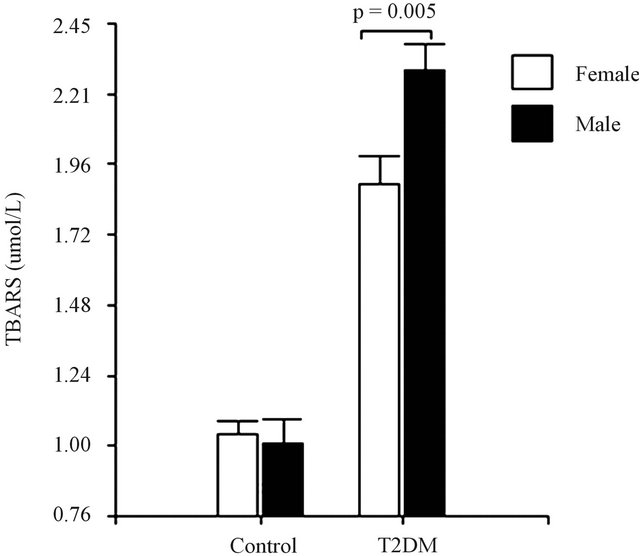 (b)
(b)
Figure 1. (a) Lipid peroxidation among healthy controls and diabetic subjects. (b) Lipid peroxidation among female and male in diabetic subjects. Data are expressed as mean ± SEM.
 (a)
(a)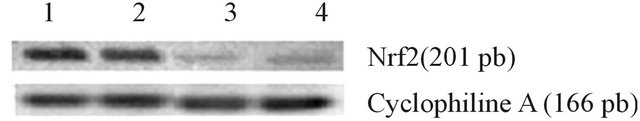 (b)
(b)
Figure 2. Expression of Nrf2. (a) The bar graphs represent the densitometric analysis of Nrf2 gene expression in leucocytes of controls (lanes 1 and 2) and type 2 diabetic patients (lane 3 and 4). (b) The expression of Nrf2 was assessed by RT PCR, using specific primers, and it was normalized against the expression of the housekeeping gene Cyclophiline A, as reported in Material and Methods. Data are expressed as mean ± SEM.
 (a)
(a)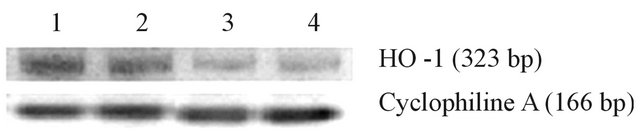 (b)
(b)
Figure 3. Expression of HO-1. (a) The bar graphs represent the densitometric analysis of HO-1 gene expression in leucocytes of controls (lanes 1 and 2) and type 2 diabetic patients (lane 3 and 4). (b) The expression of HO-1 was assessed by RT PCR, using specific primers, and it was normalized against the expression of the housekeeping gene Cyclophiline A, as reported in Material and Methods. Data are expressed as mean ± SEM.
3.4. Correlation and Lineal Regression Studies
Because both Nrf2 and HO-1 mRNA were reduced in the diabetic group, we performed correlations to determine whether this reduction was associated with metabolic factors that are important for insulin resistance. When the data from all diabetic patients were pooled together, HbA1c was positively correlated with FPG and BMI (r = 0.484, p = 0.001; r = 0.307, p = 0.04, respectively).
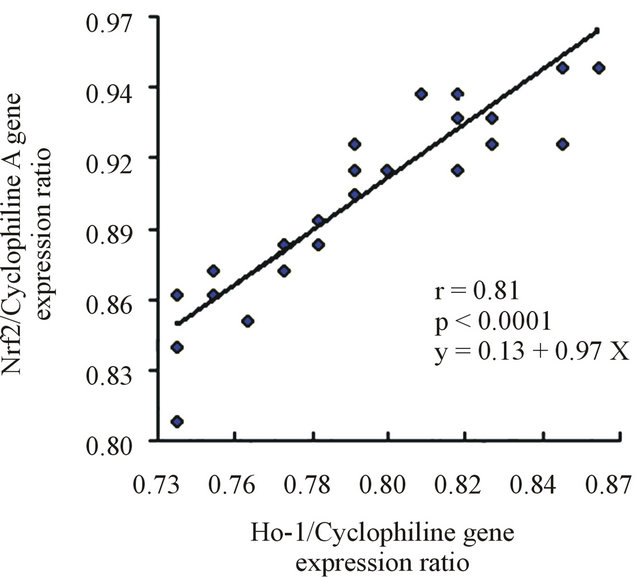
A subsequent linear regression analysis revealed that there was a significant and positive correlation between the changes of the Nrf2 and HO-1 expression levels, independent of the changes of the other measured factors. Figure 4 shows the linear regression analysis between the expression of Nrf2 and HO-1 in both groups.
4. DISCUSSION
Here we measured some anthropometrical, clinical and biochemical parameters in a population of men and women diagnosed to be T2DM-patients, which reside in Juana Koslay city, San Luis—a state located in the central region of Argentina. In this study we report for the first time that T2DM patients have lower Nrf2 and HO-1 mRNAs in blood, when compared to healthy controls.
 (a)
(a)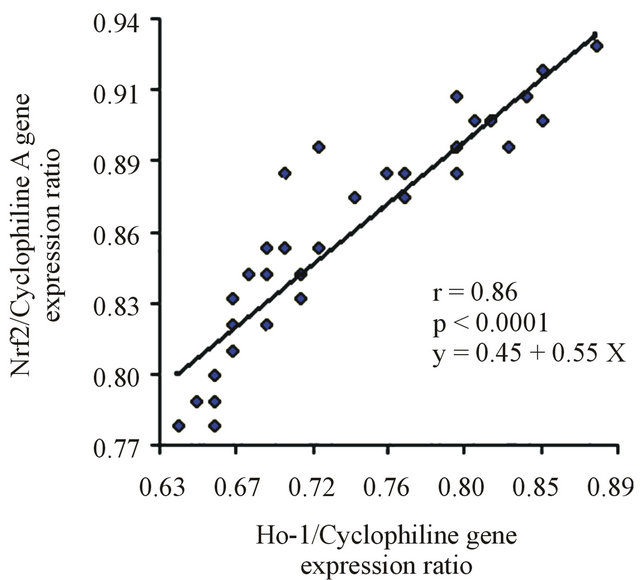 (b)
(b)
Figure 4. (a) Linear regression between Nrf2 and HO-1 in the control group. (b) Lineal regression between Nrf2 and HO-1 in T2DM.
This change was accompanied by an increased plasma concentration of TBAR’S.
Type 2 Diabetes Mellitus (T2DM) is common and is characterized by hyperglycemia, insulin resistance, and a relative impairment in insulin secretion. Abdominal obesity, specifically, is associated with resistance to the effects of insulin on the utilization of fatty acids and on peripheral glucose levels. Insulin resistance is integral in the pathogenesis of T2DM and is frequently accompanied by hypertension, high serum LDL, low serum highdensity lipoprotein, and high serum triglyceride levels, which promote the development of atherosclerotic cardiovascular disease [20].
Hyperglycemia is a major factor in the development of diabetic complications, although the mechanisms of how increased glucose levels contribute to these changes have not been fully elucidated. Adverse biochemical changes associated to hyperglycemia include increased flux of glucose through the polyol pathway, enhanced nonenzymatic glycation and activation of the diacylglycerolprotein kinase C pathway. Hyperglycemia may also result in increased production of ROS within numerous biochemical pathways that have the potential to initiate adverse changes in the endothelial function [21]. Oxygen-free radicals had been suggested to be a contributory factor in complications of diabetes mellitus. There are many reports that indicate that the changes in biochemical parameters are due to diabetes-induced oxidative stress.
Our results indicate the presence of higher levels of MDA in plasma of type 2 patients as compared to healthy controls. Increased levels of MDA in diabetic subjects are indication of lipid peroxidation. Increased production of MDA has also been demonstrated in the erythrocyte membranes of diabetic patients [22,23] and high-lipid peroxides levels are also observed in diabetic rats [24].
Oxidative stress is a consequence of an unbalance between the production of oxidants and antioxidants, which affects the structure, function and turnover of macromolecules leading to tissue dysfunction [25]. Oxidative stress has been suggested to be an important mechanism in the development of type 2 diabetes [1,2]. Nrf2 maintain the balances controlling the antioxidant defense in the body which are at stake in a variety of conditions including diabetes and diabetic neuropathy. In response to oxidative stress, Nrf2 escapes ubiquitination by dissociating from its negative regulator KEAP1 (Kelch-like ECH-associated protein 1), translocates to the nucleus, and activates the genes involved in the synthesis of antioxidant enzymes [26]. These genes carry a special Nrf2- binding site, called the antioxidant response element (ARE), in their promoter region [27]. Nrf2 itself contains an ARE in its promoter.
Lipid peroxidation leads to the formation of a number of short-length electrophilic fatty acid-derivatives and lipid peroxides, which are known to trigger Nrf-2 pathway activation and synthesis of antioxidant proteins and other proteins involved in the removal of electrophilic compounds [28,29]. Although acute activation of Nrf2 occurs in vivo in response to oxidized phospholipids’ signaling, increased ROS production, hyperglycemia, and shear stress [30-32], in chronic disease states the antioxidant response is often insufficient to maintain redox balance and prevent disease progression [33,34]. Our T2DM patients have increased lipid peroxidation and lower Nrf2 mRNA in blood than controls.
Like many other antioxidant genes, HO-1 gene expression is triggered by the binding of Nrf2 to the antioxidant response element in its gene’s promoter. In the anti-oxidative system, HO-1 acts as a key factor in mechanisms to mitigate oxidative stress because of its potent anti-inflammatory, antioxidant, and anti-proliferative actions [12]. In addition, impaired HO-1 protein expression/activity may be related to the pathogenic process induced by oxidative stress. Although accumulating evidence from animal studies supports a beneficial role of HO-1 in the diabetic state [12,17], it is still not clear whether HO-1 exerts a similar biologic effect in humans. We studied HO-1 expression in leucocytes from control and T2DM patients. As expected, decreased levels of HO-1 mRNA expression were observed in diabetic patients when compared to healthy controls. These findings suggest that reduced HO-1 expression may contribute to the development of type 2 diabetes, consistent with the results of several small clinical studies which found decreased mRNA expression of HO-1 in peripheral blood mononuclear cells [35], skeletal muscle [36], and retinal pigment epithelium [37] among patients with type 2 diabetes.
Taken together our data indicate that the decreased expression of HO-1 and increased levels of TBAR’S observed in T2DM could be a consequence of a reduced expression of Nrf2. Continuous oxidative stress may be a consequence of a reduced capacity of T2DM patients to trigger Nrf2-dependent antioxidant response against a positive energy balance.
The results from this study provide novel evidence that genes associated to antioxidant defense mechanisms are markedly reduced in patients with type 2 diabetes, and that the reduction in the expression of these genes could be associated to hyperglycemia and increased levels of MDA. The linear regression analysis revealed that there is a strong and positive correlation between the changes of the Nrf2 and HO-1 expression levels.
REFERENCES
- Baynes, J.W. and Thorpe, S.R. (1999) Role of oxidative stress in diabetic complications: A new perspective of an old paradigm. Diabetes, 48, 1-9. doi:10.2337/diabetes.48.1.1
- Evans, J.L., Goldfine, I.D., Maddux, B.A. and Grodsky, G.M. (2002) Oxidative stress and stress-activated signaling pathways: A unifying hypothesis of type 2 diabetes. Endocrine Reviews, 23, 599-622. doi:10.1210/er.2001-0039
- Hooper, P.L. (2003) Diabetes, nitric oxide, and heat shock proteins. Diabetes Care, 26, 951-952. doi:10.2337/diacare.26.3.951
- Rudich, A., Tirosh, A., Potashnik, R., Hemi, R., Kanety, H. and Bashan, N. (1998) Prolonged oxidative stress impairs insulin-induced GLUT4 translocation in 3T3-L1 adipocytes. Diabetes, 47, 1562-1569. doi:10.2337/diabetes.47.10.1562
- King, G.L. and Loeken, M.R. (2004) Hyperglycemiainduced oxidative stress in diabetic complications. Histochemistry and Cell Biology, 122, 333-338. doi:10.1007/s00418-004-0678-9
- Jeong, I.K. and King, G.L. (2011) New perspectives on diabetic vascular complications: The loss of endogenous protective factors induced by hyperglycemia. Diabetes and Metabolism Journal, 35, 8-11. doi:10.4093/dmj.2011.35.1.8
- Matough, F.A., Budin, S.B., Hamid, Z.A., Alwahaibi, N. and Mohamed, J. (2012) The role of oxidative stress and antioxidants in diabetic complications. Sultan Qaboos University Medical Journal, 12, 5-18.
- Nguyen, T., Nioi, P. and Pickett, C.B. (2009) The Nrf2- antioxidant response element signaling pathway and its activation by oxidative stress. Journal of Biolpgical Chemistry, 284, 13291-13295. doi:10.1074/jbc.R900010200
- Sykiotis, G.P., Habeos, I.G., Samuelson, A.V. and Bohmann, D. (2011) The role of the antioxidant and longevity-promoting Nrf2 pathway in metabolic regulation. Current Opinion in Clinical Nutrition and Metabolic Care, 14, 41-48.
- McMahon, M., Itoh, K., Yamamoto, M. and Hayes, J.D. (2003) Keap1-dependent proteasomal degradation of transcription factor Nrf2 contributes to the negative regulation of antioxidant response element-driven gene expression. Journal of Biolpgical Chemistry, 278, 21592- 21600. doi:10.1074/jbc.M300931200
- Donovan, E.L., McCord, J.M., Reuland, D.J., Miller, B.F. and Hamilton, K.L. (2012) Phytochemical activation of Nrf2 protects human coronary artery endothelial cells against an oxidative challenge. Oxidative Medicine and Cellular Longevity, 2012, 9. doi:10.1155/2012/132931
- Deshane, J., Wright, M. and Agarwal, A. (2005) Heme oxygenase-1 expression in disease states. Acta Biochimica Polonica, 52, 273-284.
- Maines, M.D. (1997) The heme oxygenase system: A regulator of second messenger gases. Annual Review of Pharmacology and Toxicology, 37, 517-554. doi:10.1146/annurev.pharmtox.37.1.517
- Otterbein, L.E., Soares, M.P., Yamashita, K. and Bach, F.H. (2003) Heme oxygenase-1: Unleashing the protective properties of heme. Trends in Immunology, 24, 449- 455. doi:10.1016/S1471-4906(03)00181-9
- Otterbein, L.E. and Choi, A.M. (2000) Heme oxygenase: colors of defense against cellular stress. American Journal of Physiology, Lung Cellular and Molecular Physiology, 279, L1029-L1037.
- Immenschuh, S. and Ramadori, G. (2000) Gene regulation of heme oxygenase-1 as a therapeutic target. Biochemical Pharmacology, 60, 1121-1128. doi:10.1016/S0006-2952(00)00443-3
- Song, F., Qi, X., Chen, W., Jia, W., Yao, P., Nussler, A.K., Sun, X. and Liu, L. ((2007) Effect of Momordica grosvenori on oxidative stress pathways in renal mitochondria of normal and alloxan-induced diabetic mice. Involvement of heme oxygenase-1. European Journal of Nutrition, 46, 61-69. doi:10.1007/s00394-006-0632-9
- The Expert Committee of the Diagnosis and Classification of Diabetes Mellitus. (1997) Report of the expert committee on the diagnosis and classification of diabetes mellitus. Diabetes Care, 20, 1183-1197.
- Friedewald, W.T., Levy, R.I. and Fredrickson, D.S. (1972) Estimation of the concentration of low-density lipoprotein cholesterol in plasma, without use of the preparative ultracentrifuge. Clinical Chemistry, 18, 499-502.
- DeFronzo, R.A. and Ferrannini, E. (1991) Insulin resistance. A multifaceted syndrome responsible for NIDDM, obesity, hypertension, dyslipidemia, and atherosclerotic cardiovascular disease. Diabetes Care, 14, 173-194. doi:10.2337/diacare.14.3.173
- Giugliano, D., Ceriello, A. and Paolisso, G. (1996) Oxidative stress and diabetic vascular complications. Diabetes Care, 19, 257-267. doi:10.2337/diacare.19.3.257
- Mahboob, M., Rahman, M.F. and Grover, P. (2005) Serum lipid peroxidation and antioxidant enzyme levels in male and female diabetic patients. Singapore Medical Journal, 46, 322-324.
- Maritim, A.C., Sanders, R.A. and Watkins, J.B. (2003) Diabetes, oxidative stress, and antioxidants: A review. Journal of Biochemical and Molecular Toxicology, 17, 24-38. doi:10.1002/jbt.10058
- Unlüçerçi, Y., Bekpinar, S. and Koçak, H. (2000) Testis glutathione peroxidase and phospholipid hydroperoxide glutathione peroxidase activities in aminoguanidine-treated diabetic rats. Archives of Biochemistry and Biophysics, 379, 217-220. doi:10.1006/abbi.2000.1876
- Ragheb, R., Shanab, G.M., Medhat, A.M., Seoudi, D.M., Adeli, K. and Fantus, I.G. (2009) Free fatty acid-induced muscle insulin resistance and glucose uptake dysfunction: Evidence for PKC activation and oxidative stress activated signaling pathways. Biochemical and Biophysical Research Communications, 389, 211-216. doi:10.1016/j.bbrc.2009.08.106
- Kobayashi, A., Ohta, T. and Yamamoto, M. (2004) Unique function of the Nrf2-Keap1 pathway in the inducible expression of antioxidant and detoxifying enzymes. Methods in Enzymology, 378, 273-286. doi:10.1016/S0076-6879(04)78021-0
- Zhang, D.D. (2006) Mechanistic studies of the Nrf2- KEAP1 signaling pathway. Drug Metabolism Reviews, 38, 769-789. doi:10.1080/03602530600971974
- Motohashi, H. and Yamamoto, M. (2004) Nrf2-Keap1 defines a physiologically important stress response mechanism. Trends in Molecular Medicine, 10, 549-557. doi:10.1016/j.molmed.2004.09.003
- Vomhof-Dekrey, E.E. and Picklo Sr., M.J. (2012) The Nrf2-antioxidant response element pathway: A target for regulating energy metabolism. Journal of Nutritional Biochemistry, 23, 1201-1206. doi:10.1016/j.jnutbio.2012.03.005
- He, M., Siow, R.C., Sugden, D., Gao, L., Cheng, X. and Mann, G.E. (2011) Induction of HO-1 and redox signaling in endothelial cells by advanced glycation end products: A role for Nrf2 in vascular protection in diabetes. Nutrition, Metabolism and Cardiovascular Diseases, 21, 277- 285.
- Kadl, A., Meher, A.K., Sharma, P.R., Lee, M.Y., Doran, A.C., Johnstone, S.R., Elliott, M.R., Gruber, F., Han, J., Chen, W., Kensler, T., Ravichandran, K.S., Isakson, B.E., Wamhoff, B.R. and Leitinger, N. (2010) Identification of a novel macrophage phenotype that develops in response to atherogenic phospholipids via Nrf2. Circulation Research, 107, 737-746. doi:10.1161/CIRCRESAHA.109.215715
- Warabi, E., Takabe, W., Minami, T., Inoue, K., Itoh, K., Yamamoto, M., Ishii, T., Kodama, T. and Noguchi, N. (2007) Shear stress stabilizes NF-E2-related factor 2 and induces antioxidant genes in endothelial cells: Role of reactive oxygen/nitrogen species. Free Radical Biology and Medicine, 42, 260-269. doi:10.1016/j.freeradbiomed.2006.10.043
- Jyrkkänen, H.K., Kansanen, E., Inkala, M., Kivelä, A.M., Hurttila, H., Heinonen, S.E., Goldsteins, G., Jauhiainen, S., Tiainen, S., Makkonen, H., Oskolkova, O., Afonyushkin, T., Koistinaho, J., Yamamoto, M., Bochkov. V.N., Ylä-Herttuala, S. and Levonen, A.L. (2008) Nrf2 regulates antioxidant gene expression evoked by oxidized phospholipids in endothelial cells and murine arteries in vivo. Circulation Research, 103, e1-e9. doi:10.1161/CIRCRESAHA.108.176883
- Ungvari, Z., Bailey-Downs, L., Gautam, T., Jimenez, R., Losonczy, G., Zhang, C., Ballabh P., Recchia, F.A., Wilkerson, D.C., Sonntag, W.E., Pearson, K., de Cabo, R. and Csiszar, A. (2011) Adaptive induction of NF-E2-related factor-2-driven antioxidant genes in endothelial cells in response to hyperglycemia. American Journal of Physiology, 300, H1133-H1140. doi:10.1152/ajpheart.00402.2010
- Adaikalakoteswari, A., Balasubramanyam, M., Rema, M. and Mohan, V. (2006) Differential gene expression of NADPH oxidase (p22phox) and hemoxygenase-1 in patients with type 2 diabetes and microangiopathy. Diabetic Medicine, 23, 666-674. doi:10.1111/j.1464-5491.2006.01879.x
- Bruce, C.R., Carey, A.L., Hawley, J.A. and Febbraio, M.A. (2003) Intramuscular heat shock protein 72 and heme oxygenase-1 mRNA are reduced in patients with type 2 diabetes: Evidence that insulin resistance is associated with a disturbed antioxidant defense mechanism. Diabetes, 52, 2338-2345. doi:10.2337/diabetes.52.9.2338
- da Silva, J.L., Stoltz, R.A., Dunn, M.W., Abraham, N.G. and Shibahara, S. (1997) Diminished heme oxygenase-1 mRNA expression in RPE cells from diabetic donors as quantitated by competitive RT/PCR. Current Eye Research, 16, 380-386. doi:10.1076/ceyr.16.4.380.10695
NOTES
*Corresponding author.